Copyright
©The Author(s) 2002.
World J Gastroenterol. Jun 15, 2002; 8(3): 562-566
Published online Jun 15, 2002. doi: 10.3748/wjg.v8.i3.562
Published online Jun 15, 2002. doi: 10.3748/wjg.v8.i3.562
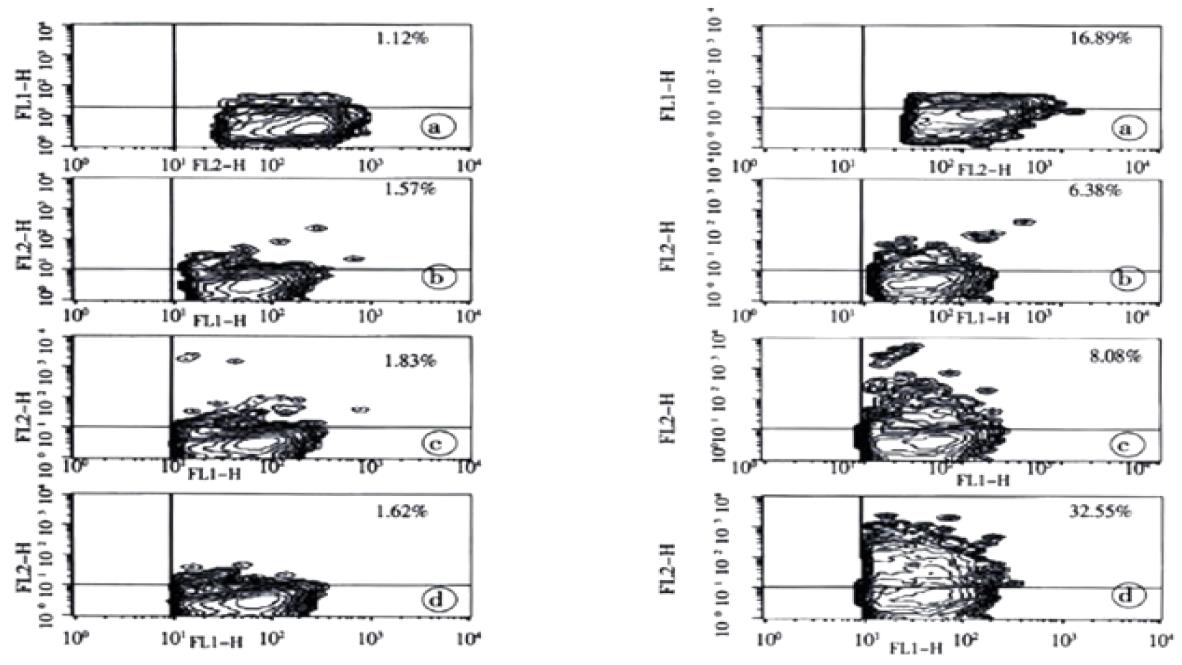
Figure 1 Contour plots of cytokine expression in CD14+ cells.
These contour plots show representative experiments for the detection of spontaneous expression (buffer control, left column) and HCV NS5b-induced expression (1 μg/mL, right column) of IL-1β (a), IL-10 (b), IL-12 (c) and TNF-((d) in peripheral blood CD14+ monocytes of patient # 23 with chronic hepatitis C at 12 hours of incubation.
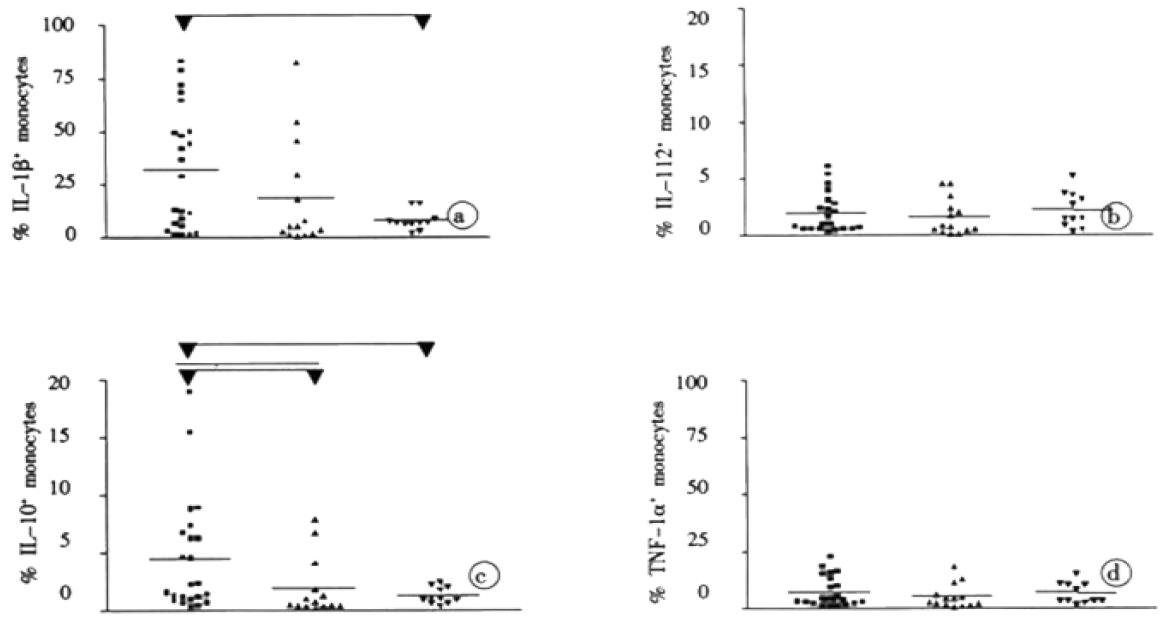
Figure 2 Induction of cytokines by the HCV NS4 protein.
The graph displays the fractions of IL-1β (a), IL-10 (b), IL-12 (c) and TNF-((d) producing monocytes 12 hours after stimulation with recombinant NS4 protein (1 μg/mL) for patients with chronic hepatitis C (filled squares), aviremic anti-HCV seropositives (upward triangles), and non-HCV related controls (downward triangles). Each dot represents the mean percentage of a single patient obtained from triplicate experiments. The horizontal bar gives the mean of each group.
- Citation: Woitas RP, Petersen U, Moshage D, Brackmann HH, Matz B, Sauerbruch T, Spengler U. HCV-specific cytokine induction in monocytes of patients with different outcomes of hepatitis C. World J Gastroenterol 2002; 8(3): 562-566
- URL: https://www.wjgnet.com/1007-9327/full/v8/i3/562.htm
- DOI: https://dx.doi.org/10.3748/wjg.v8.i3.562


