Copyright
©The Author(s) 2002.
World J Gastroenterol. Jun 15, 2002; 8(3): 546-550
Published online Jun 15, 2002. doi: 10.3748/wjg.v8.i3.546
Published online Jun 15, 2002. doi: 10.3748/wjg.v8.i3.546
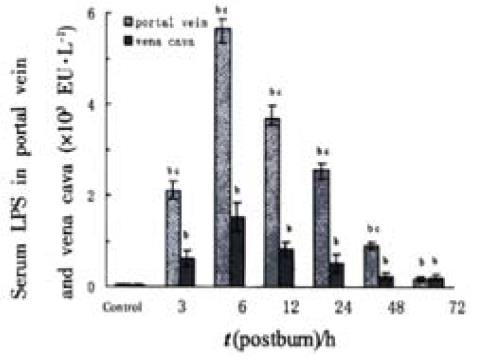
Figure 1 Comparison of the LPS levels postburn in portal vein and in vena cava.
bP < 0.01, vs control; cP < 0.01, portal vein vs vena cava
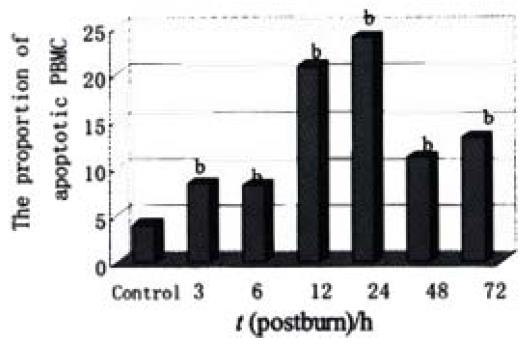
Figure 2 The relative proportions of apoptotic lymphocytes postburn.
bP < 0.01, vs control
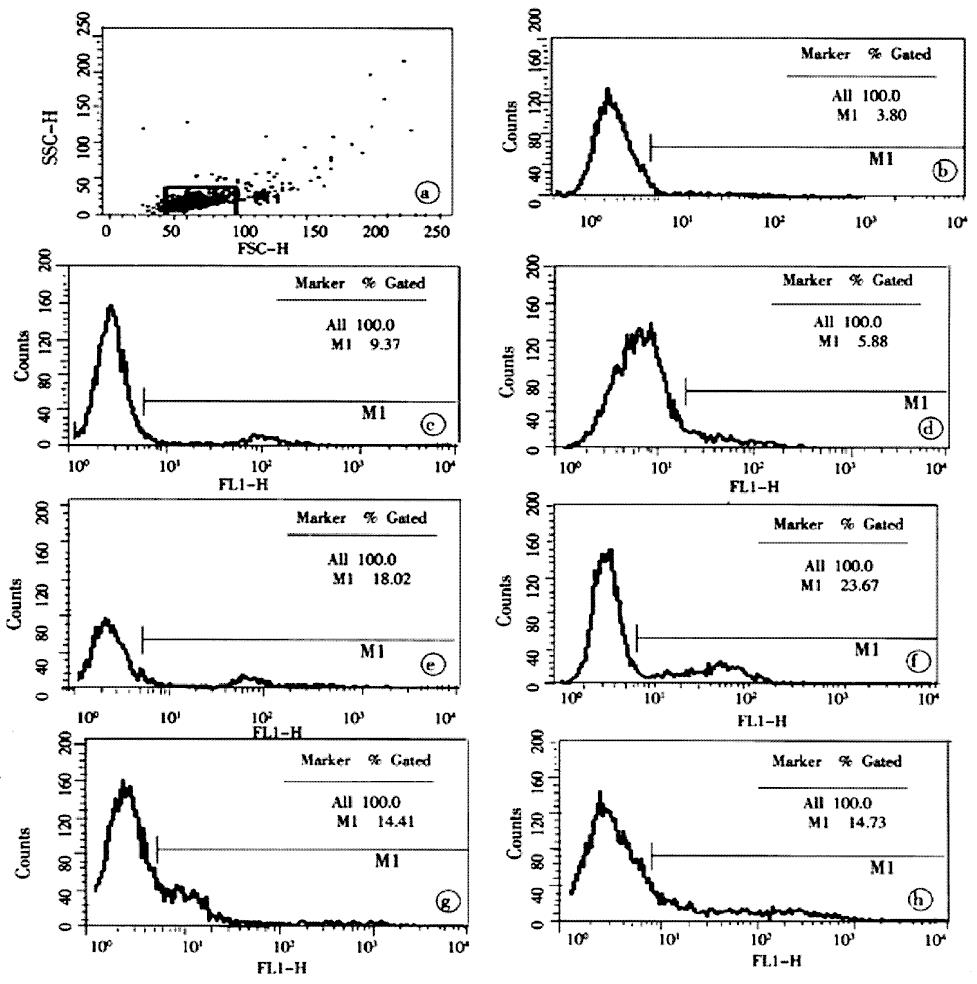
Figure 3 The results of typical flow cytometric analysis of postburn apoptotic lymphocytes.
a, b, c, d, e, f, g and h were the relative proportion of apoptotic lymphocytes isolated from one rat in the control and group 3, 6, 12, 24, 48 and 72 PBH, respectively.
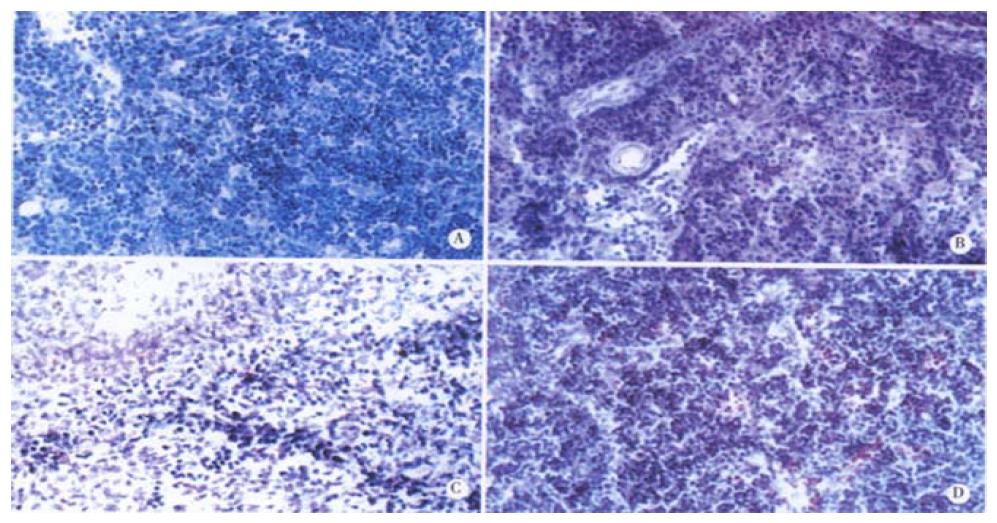
Figure 4 Apoptotic lymphocytes in spleen and MLN.
(TUNEL-POD staining × 400, the nuclei stained brown are positive apoptotic cells). A: MLN from the healthy rat; B: MLN from the rat at 3 PBH; C: Spleen from the healthy rat; D: Spleen from the rat 24 PBH.
- Citation: Xia PY, Zheng J, Zhou H, Pan WD, Qin XJ, Xiao GX. Relationship between lymphocyte apoptosis and endotoxin translocation after thermal injury in rats. World J Gastroenterol 2002; 8(3): 546-550
- URL: https://www.wjgnet.com/1007-9327/full/v8/i3/546.htm
- DOI: https://dx.doi.org/10.3748/wjg.v8.i3.546


