Copyright
©The Author(s) 2002.
World J Gastroenterol. Jun 15, 2002; 8(3): 524-527
Published online Jun 15, 2002. doi: 10.3748/wjg.v8.i3.524
Published online Jun 15, 2002. doi: 10.3748/wjg.v8.i3.524
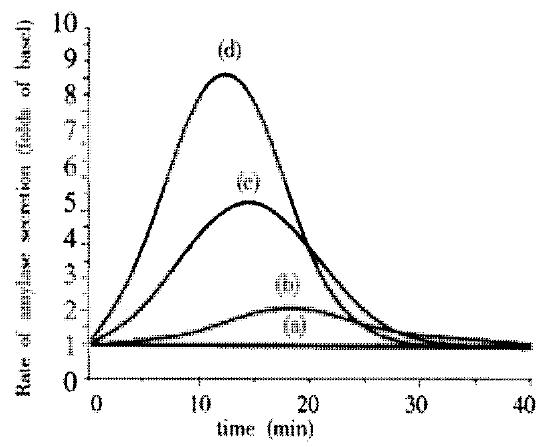
Figure 1 Rate kinetics of amylase secretion stimulated by SA (I) in the rat pancreatic acini.
The results were expressed at the ratio of amylase secretion during the incubation to the basal secretion. a: basal value was standardized as 1, b: 1 × 10⁻⁶ mol/L SA (I), c: 5 × 10⁻⁶ mol/L SA (I), d: 1 × 10⁻⁵ mol/L SA (I). The values represented the -x±s from four independent experiments.
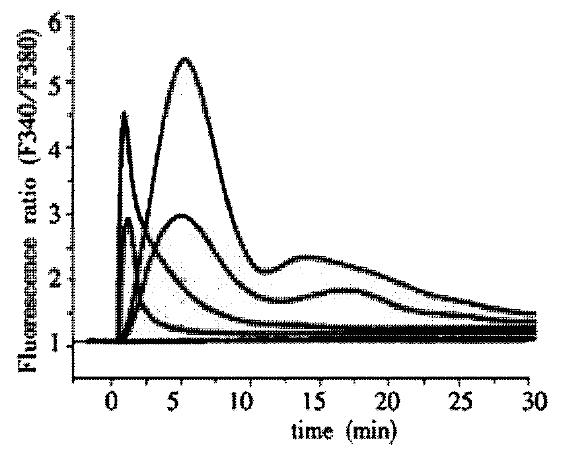
Figure 2 Kinetics of SA (I) and CCK-8 evoked [Ca2+]i and effects of GDP in a single rat pancreatic acinar cell.
[Ca2+]i were expressed by Fluorescence ratio F340/F380. a. 1 × 10⁻⁹ mol/L CCk-8; b. 1 × 10⁻⁹ mol/L CCk-8 + 5 × 10⁻³ mol/L GDP; c. 5 × 10⁻⁶ mol/L SA (I); d. 5 × 10⁻⁶ mol/L SA (I) + 5 × 10⁻³ mol/L GDP; e. Base. Time 0 is determined by the time of adding drug.
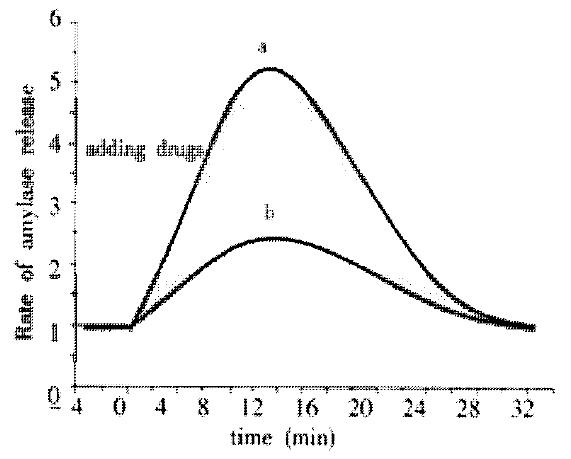
Figure 3 Inhibitory of GDP on rate course of SA (I) stimulated amylase secretion in rat pancreatic acini (base secretion rate is normalized as 1.
0). a. 5 × 10⁻⁶ mol·L-1 SA (I); b. 5 × 10⁻⁶ mol·L-1 SA (I) + 5 × 10⁻³ mol·L-1 GDP. The data points represent from four separate experiments.
- Citation: Yu Y, Yang WX, Wang H, Zhang WZ, Liu BH, Dong ZY. Characteristics and mechanism of enzyme secretion and increase in [Ca2+]i in Saikosaponin (I) stimulated rat pancreatic acinar cells. World J Gastroenterol 2002; 8(3): 524-527
- URL: https://www.wjgnet.com/1007-9327/full/v8/i3/524.htm
- DOI: https://dx.doi.org/10.3748/wjg.v8.i3.524


