Copyright
©The Author(s) 2002.
World J Gastroenterol. Jun 15, 2002; 8(3): 464-468
Published online Jun 15, 2002. doi: 10.3748/wjg.v8.i3.464
Published online Jun 15, 2002. doi: 10.3748/wjg.v8.i3.464
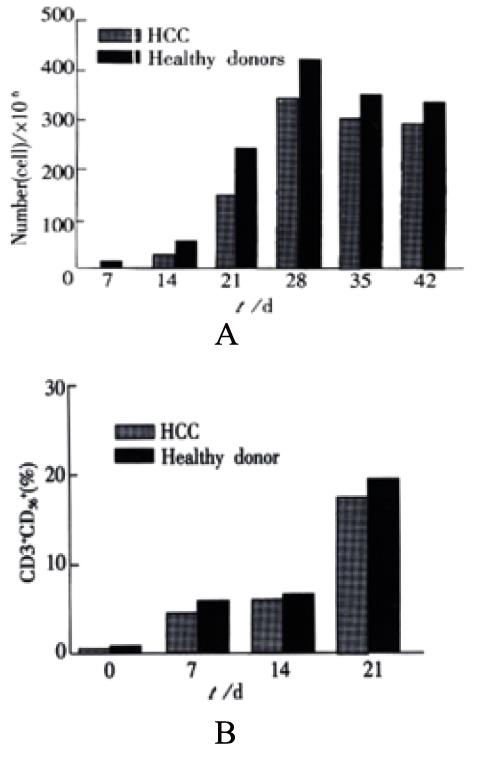
Figure 1 A: Proliferation of CIK cells in vitro culture system.
B: The percentages of double CD3+CD56+ positive cells at various incubation time in vitro culture system.
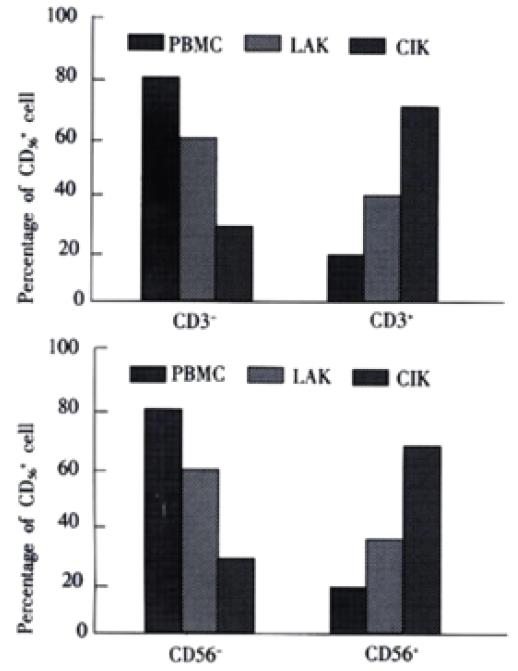
Figure 2 Subsets of CIK cells from patients with primary HCC.
CIK cells were counterstained for CD3 and CD56 at day 12 of CIK generation and the percentage of positively stained cells was determined by flow cytometry. PBMC and LAK were stained like CIK cells. LAK cells were used at day 6 of generation. Upper. CD56+ subsets of CIK cells, LAK, PBMC. Subsets of CD56+ cells were compared to the total number of CD56+ cells. The figure represents data from three different experiments. Results are presented as mean value ± SEM. Lower. CD3+ subsets of CIK cells, LAK, PBMC. Subsets of CD3+ cells were compared to the total number of CD3+ cells. The figure represents data from three different experiments. Results are presented as mean value ± SEM.
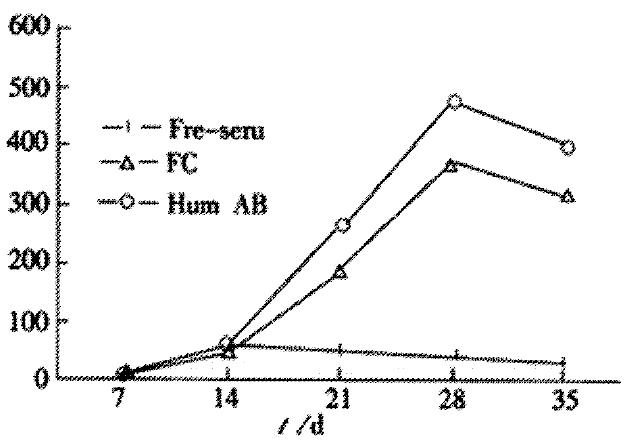
Figure 3 Effects of different culture system on growth of CIK cells
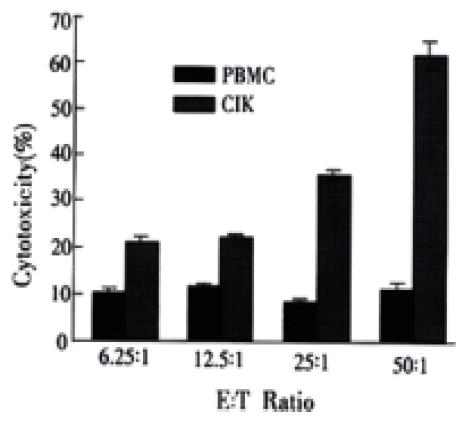
Figure 4 Cytotoxic activity of CIK, PBMC cells against primary HCC cells
-
Citation: Wang FS, Liu MX, Zhang B, Shi M, Lei ZY, Sun WB, Du QY, Chen JM. Antitumor activities of human autologous cytokine-induced killer (CIK) cells against hepatocellular carcinoma cells
in vitro andin vivo . World J Gastroenterol 2002; 8(3): 464-468 - URL: https://www.wjgnet.com/1007-9327/full/v8/i3/464.htm
- DOI: https://dx.doi.org/10.3748/wjg.v8.i3.464


