Copyright
©The Author(s) 2002.
World J Gastroenterol. Apr 15, 2002; 8(2): 357-362
Published online Apr 15, 2002. doi: 10.3748/wjg.v8.i2.357
Published online Apr 15, 2002. doi: 10.3748/wjg.v8.i2.357
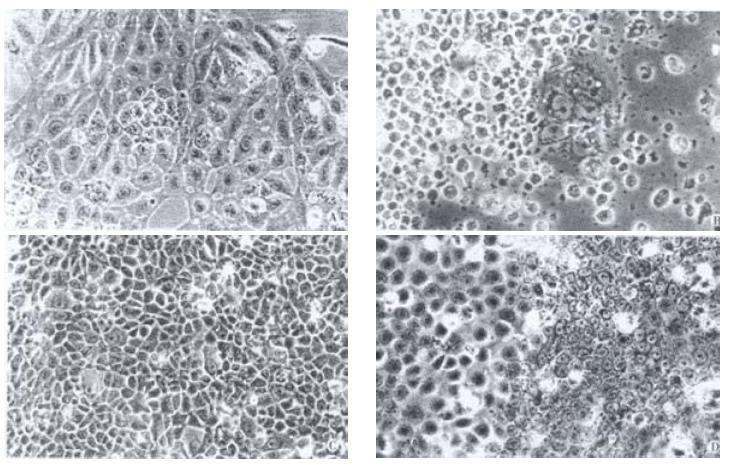
Figure 1 Morphologic changes in living cells of SHEE.
A: Cell in 6-10th passages showed differential phenotype (phase-contrast microscopy, Ph × 400); B: Cells of 16th passage displayed apoptosis with a few of cells survived (Ph × 400); C: Cells of 20th passage displayed hyperplasia (Ph × 200); D: Cells of 30th passage displayed proliferative activity with diphasic differentiation (Ph × 400).
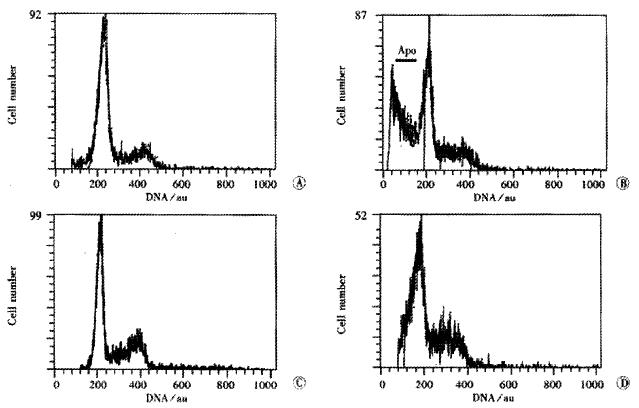
Figure 2 DNA histogram of SHEE cells.
A: 10th passage; B: 16th passage; C: 20th passage; D: 30th passage. Apo: Apoptotic peak; AU. Arbitrary unite.
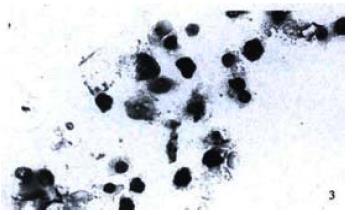
Figure 3 TUNEL positive apoptotic nuclei in 16th passage of SHEE.
(× 400)
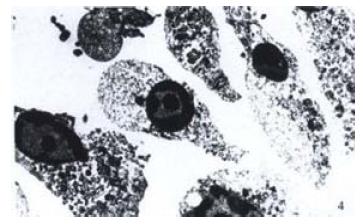
Figure 4 Electron-photomicrograph of apoptotic cells in 16th passage Shrunken cells and rounded nuclei with marginated condensed chromatin.
(EM × 3000).
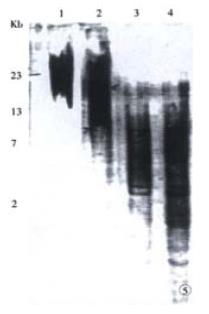
Figure 5 Telomere length of SHEE series using Southern blot.
1: Normal esophagus; 2: Cells of 10th passage; 3: Cells of 20th passage; 4: Cells of 30th passage;
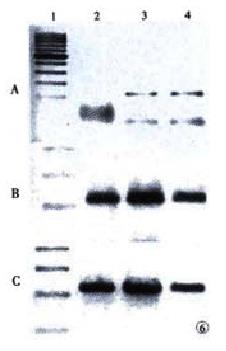
Figure 6 Gel electrophoretogram of hTERT (A), hTR (B) and GAPDH (C).
Lane 1: marker; Lane 2: 10th passage; Lane 3: 20th passage; Lane 4: 30th passage.
Figure 7 Measurements of telomerase activity using TRAP assay.
Lane 1: 10th passage, negative; Lane 2: 20th passage, weak; Lane 3: 30th passage, positive; Lane 4: human esophageal squamous cell carcinoma, strong positive;
- Citation: Shen ZY, Xu LY, Li EM, Cai WJ, Chen MH, Shen J, Zeng Y. Telomere and telomerase in the initial stage of immortalization of esophageal epithelial cell. World J Gastroenterol 2002; 8(2): 357-362
- URL: https://www.wjgnet.com/1007-9327/full/v8/i2/357.htm
- DOI: https://dx.doi.org/10.3748/wjg.v8.i2.357


