Copyright
©The Author(s) 2002.
World J Gastroenterol. Apr 15, 2002; 8(2): 333-337
Published online Apr 15, 2002. doi: 10.3748/wjg.v8.i2.333
Published online Apr 15, 2002. doi: 10.3748/wjg.v8.i2.333
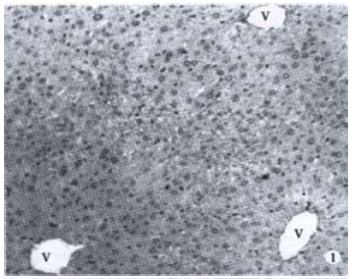
Figure 1 Light microscope observation of normal liver tissue in the control group.
V: central vein. × 100
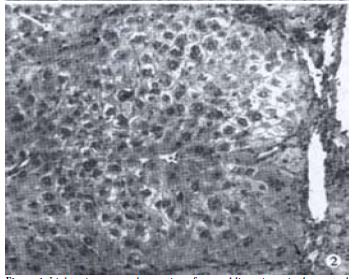
Figure 2 Light microscope observation of liver fibrosis tissue in model group.
Lots of fibrous tissue (arrows) formed in liver. A large amount of inflammatory cells soaked into the intralobular and the interlobular (tsiangle). × 200
Figure 3 TEM observation of liver in the control (A) and model group (B).
Lot of collagenous fiber (arrows) formed in model group. N: nucleus. A × 12000, B × 13500
Figure 4 Light microscope observation of liver fibrosis tissue in PA group (A) and TA group (B).
The pathological changes of liver was rather lighter compared with the model. × 200
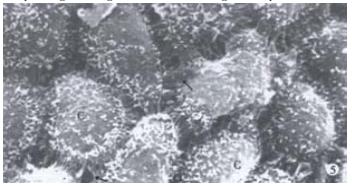
Figure 5 SEM observation of the peritoneal stomata (arrow) in the control group.
The mesothelial cells (C) and locked stomata (triangle) of the diaphragmatic peritoneum in the mice. × 2000
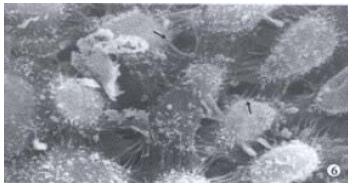
Figure 6 SEM observation of mice diaphragmatic peritoneum in the prevention A group.
Both diameter and distributive density of the peritoneal stomata (arrows) are significantly increased. × 2000
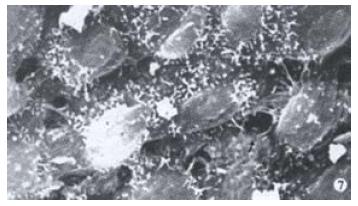
Figure 7 SEM observation of mice diaphragmatic peritoneum in the treatment A group.
Both diameter and distributive density of the peritoneal stomata (arrow) are significantly increased. × 2000
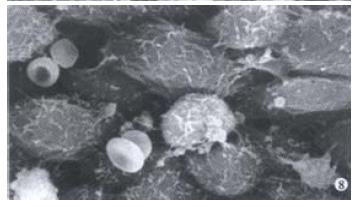
Figure 8 SEM observation of mice diaphragmatic peritoneum in the treatment A group.
Some erythrocytes (arrow) could be seen to pass through the lymphatic stomata. × 3000
- Citation: Li JC, Ding SP, Xu J. Regulating effect of Chinese herbal medicine on the peritoneal lymphatic stomata in enhancing ascites absorption of experimental hepatofibrotic mice. World J Gastroenterol 2002; 8(2): 333-337
- URL: https://www.wjgnet.com/1007-9327/full/v8/i2/333.htm
- DOI: https://dx.doi.org/10.3748/wjg.v8.i2.333


