Copyright
©The Author(s) 2002.
World J Gastroenterol. Apr 15, 2002; 8(2): 217-223
Published online Apr 15, 2002. doi: 10.3748/wjg.v8.i2.217
Published online Apr 15, 2002. doi: 10.3748/wjg.v8.i2.217
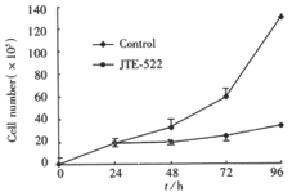
Figure 1 Effect of JTE-522 on AGS cell proliferation.
Cells were incubated in the absence or presence of 1 mmol/LJTE-522 and cell numbers determined at the time replicates at each time point (cP < 0.01).
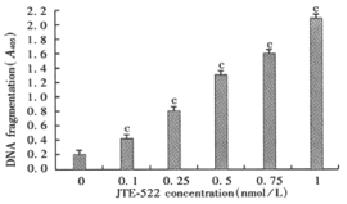
Figure 2 Effect of JTE-522 on DNA fragmentation in AGS cells.
Cytoplasmic histone-associated DNA fragments were determined using a commercial ELISA kit. Results were representative of four independent determinations.
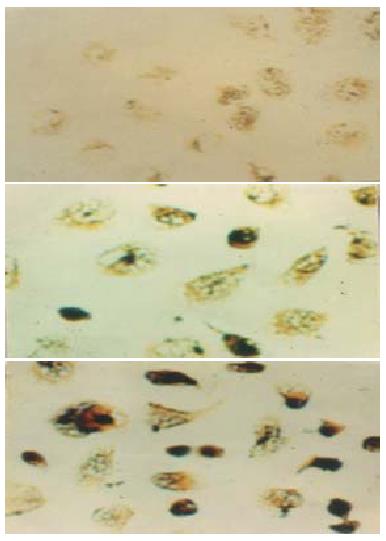
Figure 3 TUNEL assay demonstrating marked morphological changes in AGS cells after treatment with different concentrations of JTE-522.
A: control; B: 0.1 mmol/L JTE-522; C: 1 mmol/L JTE-522
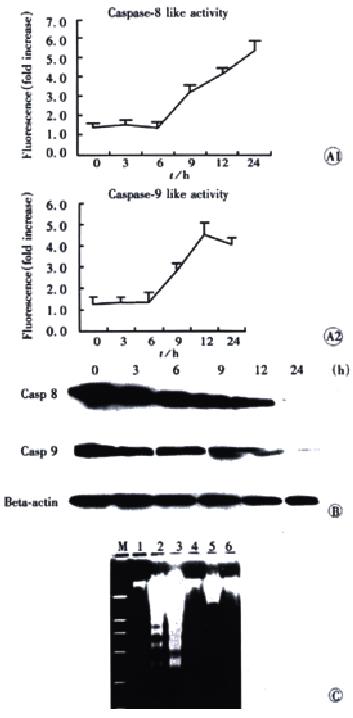
Figure 4 The role of procaspase 8 and procaspase 9 in JTE-522 induced apoptosis for indicated time.
4A: Effect of JTE-522 on caspase activities for indicated time. Data presented are the mean value of three separate experiments. 4B: Western blot shows the cleavage of procaspase 8 (Casp 8) and procaspase 9 (Casp 9). AGS cells were treated with JTE-522 for the indicated times. 4C: Effect of caspase inhibitor on JTE-522 induced DNA fragmentation. AGS cells were treated with: 1: control; 2: 1 mmol/L JTE-522; 3: 0.5 mmol/L JTE-522; 4: 50 μmol/L Z-VAD.fmk + 1 mmol/L JTE-522; 5: 50 μmol/L Ac-IETD-CHO + 1 mmol/L JTE-522; 6: 50 μmol/L Ac-LEHD-CHO + 1 mmol/L JTE-522 for 24 h.
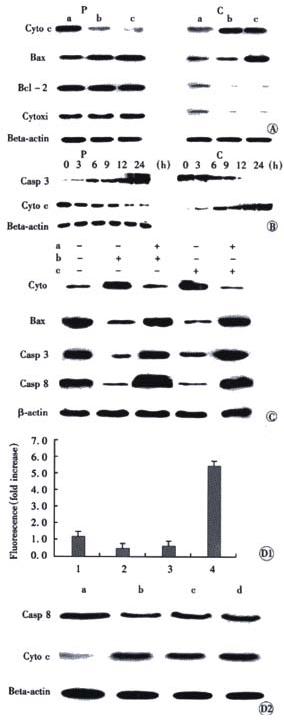
Figure 5 Effect of JTE522 on the activation of caspase, cytochrome C release and membrane translocation of Bax.
Figure 5A: AGS cells were treated with: RPMI 1640 medium for control (a) or 0.1 μmol/L staurosporine (b) or 1 mmol/L JTE-522 (c). After 24 h, the cells were collected and suspended in mitochondria isolation buffer. Cytosol (C) and pellet (P) fractions were separated and subjected to Western blotting as described in Materials and Methods. Cytochrome C (cyto c), cytochrome C oxidase subunit IV (Cyt oxi); Figure 5B: Effect of JTE522 on the changes of cytosolic cytochrome C release and procaspase 3 (casp-3); Figure 5C: Effect of caspase inhibitors on cytochrome C release and translocation of Bax. AGS cells were treated with 50 μmol/L Z-VAD.fmk (a) for 1 h or 0.1 μmol/L staurosporine (b) or 1 mmol/L JTE-522 (c) or without any treatment. The cytosol was prepared as in (A) and analyzed by Western blotting with indicated antibodies, Casp 3 (procaspase 3), Casp 8 (procaspase 8); Figure 5D: AGS cells were cultured at RPMI 1640 medium or treated with caspase inhibitors: Figure 5D1: Effect of caspase inhibitor on the activity of caspase 9: 1: control; 2: Z-VAD.fmk + 1 mmol/L JTE-522; 3: Ac-IETD-CHO + 1 mmol/L JTE-522; 4: 1 mmol/L JTE-522 for 24 h; Figure 5D2: Effect of caspase inhibitor on caspase 8 cleavage, cytochrome c release: 1: control (a); 2: Z-VAD.fmk + 1 mmol/L JTE-522 (b); 3: Ac-IETD-CHO + 1 mmol/L JTE-522 (c); 4: Ac-LEHD-CHO + 1 mmol/L JTE-522 (d). Cells were collected and analyzed for caspase 8 cleavage, cytochrome C release, or caspase-like acitivity as described in Materials and Methods.
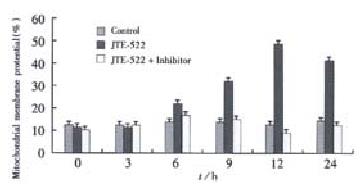
Figure 6 Time-lapsed changes of mitochondrial △Ψm in AGS cells under the treatment of JTE-522.
The data were the means of three experiment ± SD
- Citation: Li HL, Chen DD, Li XH, Zhang HW, Lü JH, Ren XD, Wang CC. JTE-522-induced apoptosis in human gastric adenocarinoma cell line AGS cells by caspase activation accompanying cytochrome C release, membrane translocation of Bax and loss of mitochondrial membrane potential. World J Gastroenterol 2002; 8(2): 217-223
- URL: https://www.wjgnet.com/1007-9327/full/v8/i2/217.htm
- DOI: https://dx.doi.org/10.3748/wjg.v8.i2.217


