Copyright
©The Author(s) 2002.
World J Gastroenterol. Feb 15, 2002; 8(1): 31-35
Published online Feb 15, 2002. doi: 10.3748/wjg.v8.i1.31
Published online Feb 15, 2002. doi: 10.3748/wjg.v8.i1.31
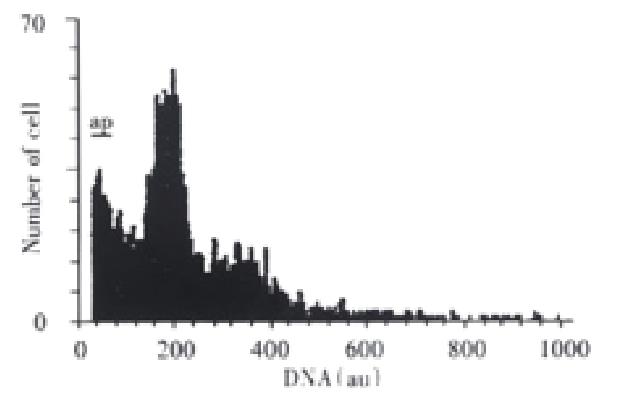
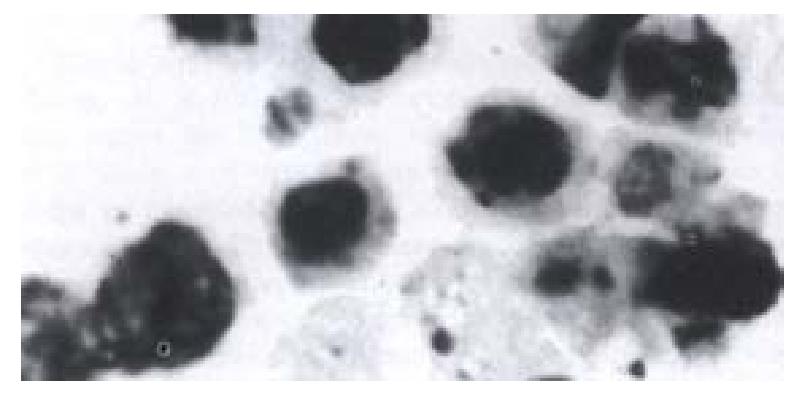
Figure 1 DNA histogram of SHEEC1 cells 24 h after Figure 2 Apoptotic changes 24 h after As2O3.
Figure 2 As2O3 adding.
ap, apoptotic peak. adding, HE × 400.
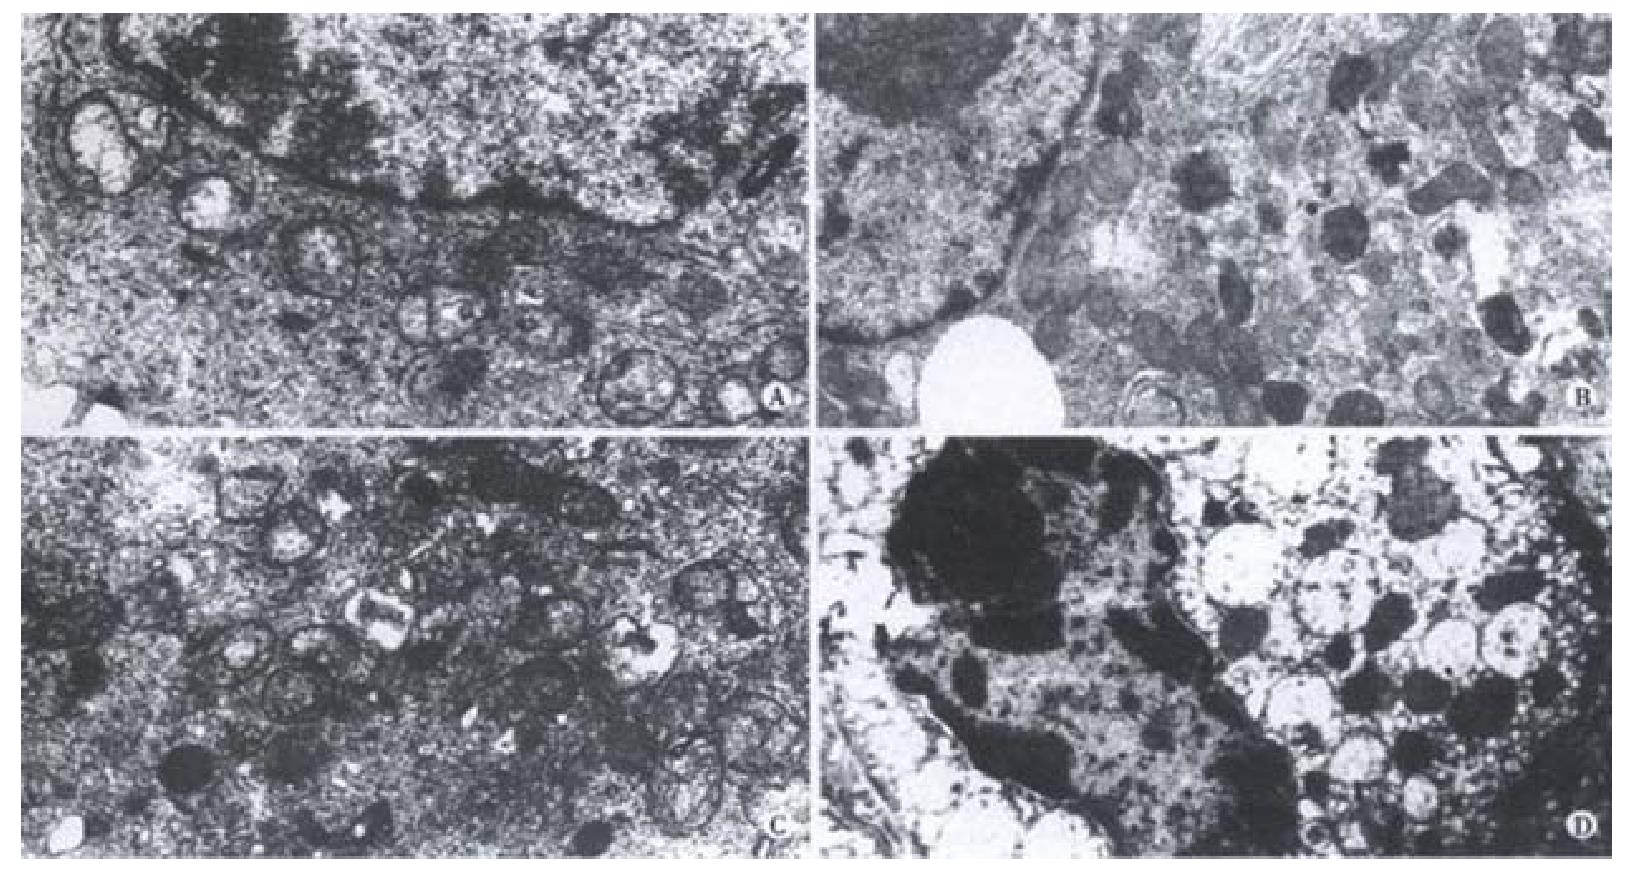
Figure 3 Apoptotic cells (EM x 15000).
Mitochondria in 1-2 arrays located around the cell nucleus, not adding As2O3; Increment of mitochondria 2-4 h after As2O3 adding; Dense substances deposition in mitochondria 4-6 h after As2O3 adding; Apoptotic cell showed cell nucleus shrank, chromatin agglutinated, mitochondria increased and swelled as balloon-like 24 h after As2O3 adding.
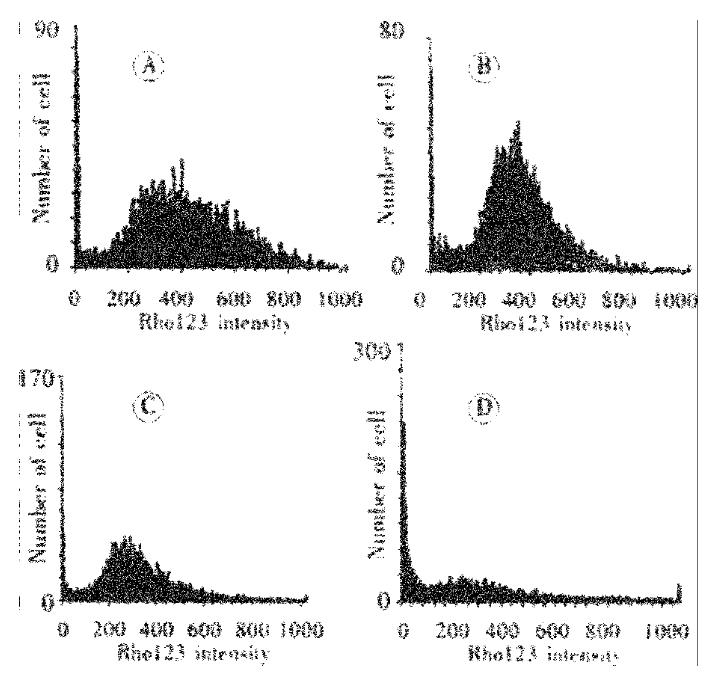
Figure 4 The histogram of mitochondrial fluorescent intensity by FCM after As2O3 adding.
A: Control; B: 2-4 h; C: 4-6 h; D: 12-24 h.
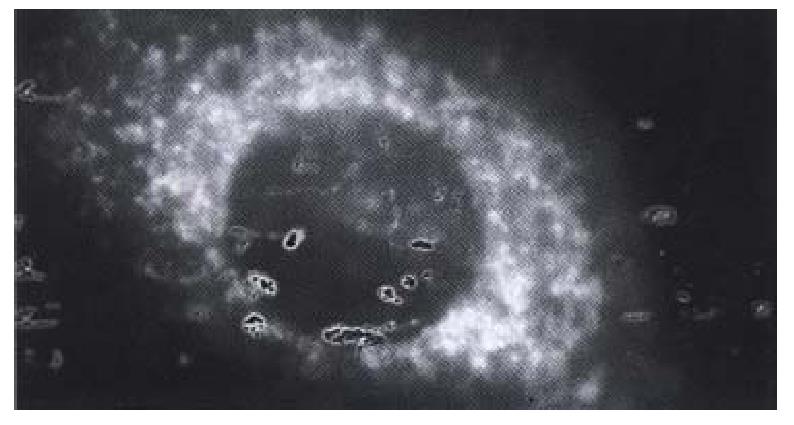
Figure 5 Increment of mitochondria with Rho123 labeled in cytoplasm of SHEEC1 after 2-4 h As2O3 adding.
× 1000
- Citation: Shen ZY, Shen J, Li QS, Chen CY, Chen JY, Zeng Y. Morphological and functional changes of mitochondria in apoptotic esophageal carcinoma cells induced by arsenic trioxide. World J Gastroenterol 2002; 8(1): 31-35
- URL: https://www.wjgnet.com/1007-9327/full/v8/i1/31.htm
- DOI: https://dx.doi.org/10.3748/wjg.v8.i1.31


