Copyright
©The Author(s) 2002.
World J Gastroenterol. Feb 15, 2002; 8(1): 188-192
Published online Feb 15, 2002. doi: 10.3748/wjg.v8.i1.188
Published online Feb 15, 2002. doi: 10.3748/wjg.v8.i1.188
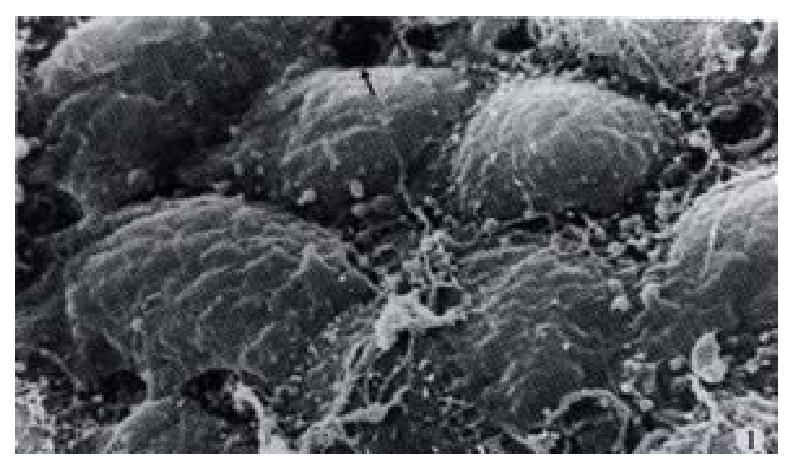
Figure 1 SEM observation of mouse diaphragmatic peritoneum in the control group.
Both the area and distribution density of the peritoneal lymphatic stomata (arrow) are small. × 3500
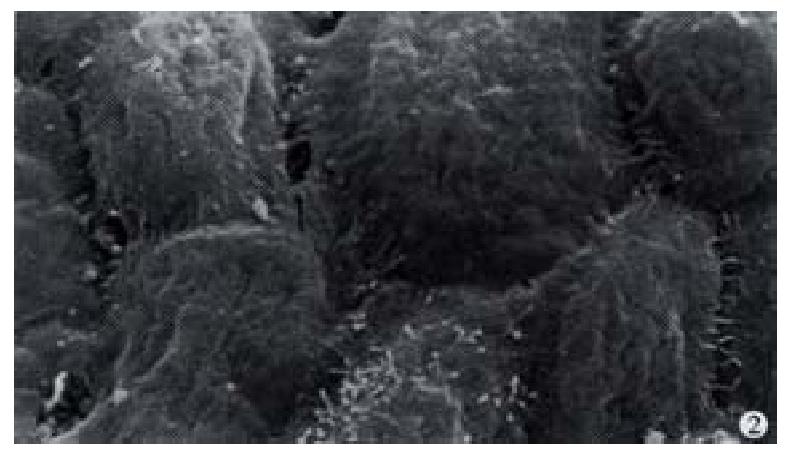
Figure 2 SEM observation of mouse diaphragmatic peritoneum in model group showing the peritoneal stomata (arrow).
× 3500
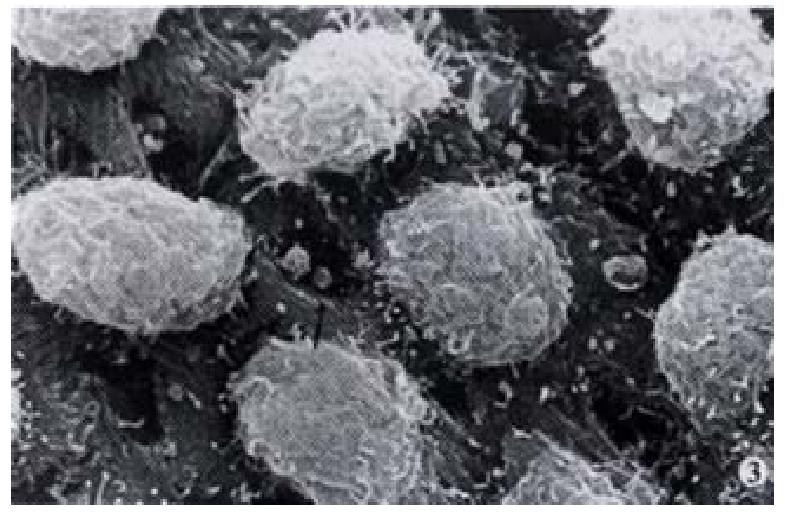
Figure 3 SEM observation of mouse diaphragmatic peritoneum in CHMI group.
The area and distribution density of the peritoneal lymphatic stomata (arrow) are significantly increased. × 3500
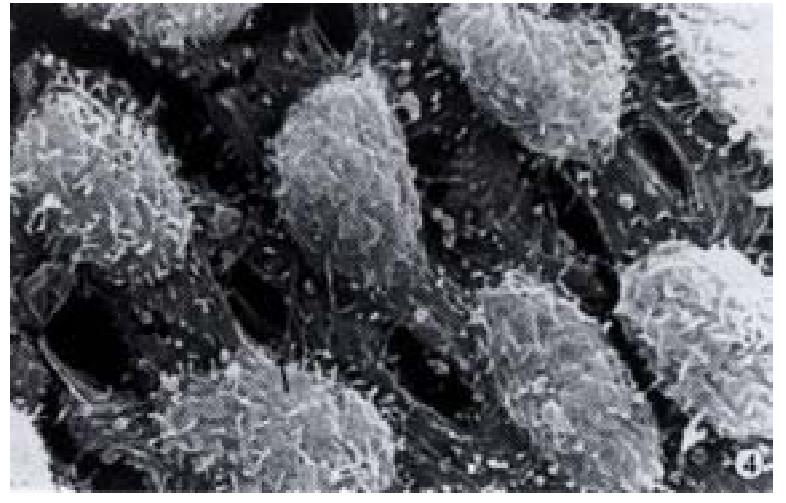
Figure 4 SEM observation of mouse diaphragmatic peritoneum in CHMII group.
The area and distribution density of the peritoneal lymphatic stomata (arrow) are significantly increased. × 3500
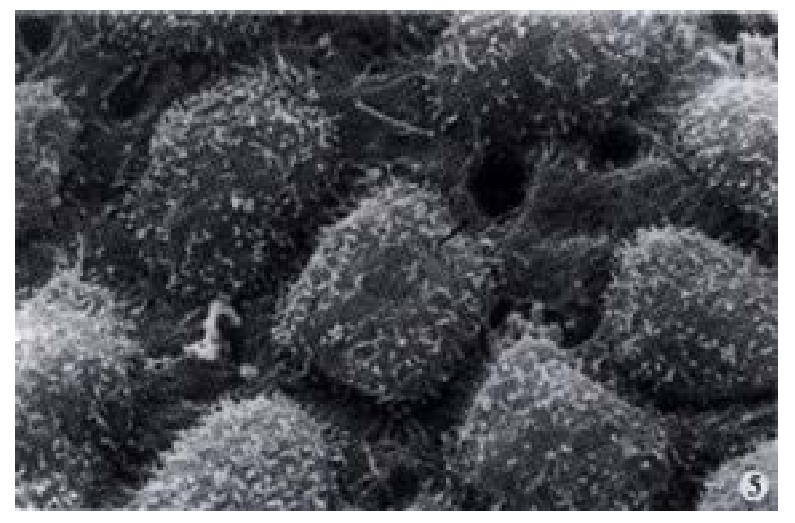
Figure 5 SEM observation of mouse diaphragmatic peritoneum in DR group.
Compared with model group, the area and distribution density of the peritoneal lymphatic stomata (arrow) are relatively increased. × 3500
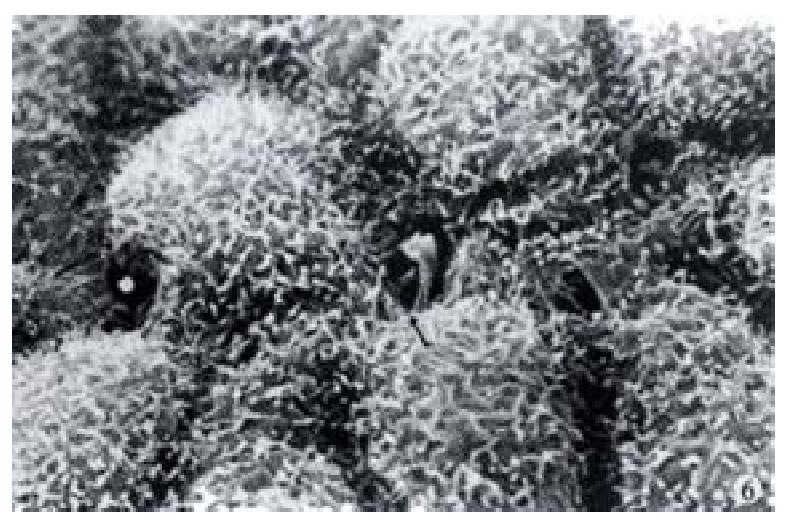
Figure 6 SEM observation of mouse diaphragmatic peritoneum in IR group.
Compared with CHMII group, the area and distribution density of the peritoneal lymphatic stomata (arrow) are relatively decreased. × 3500
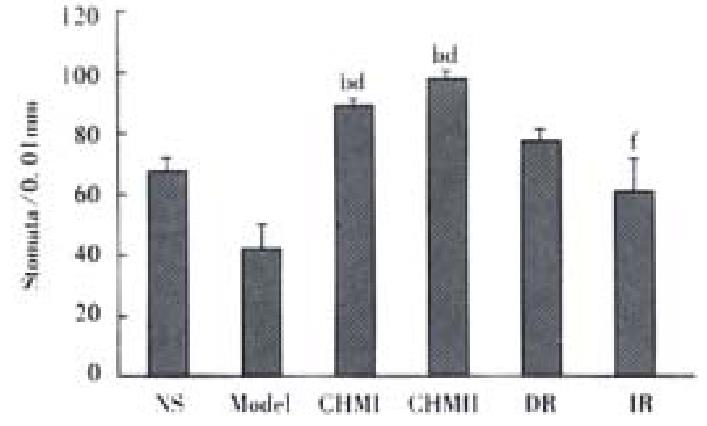
Figure 7 The influence of CHM, NO donor and NOS inhibitor on the distribution density of the lymphatic stomata.
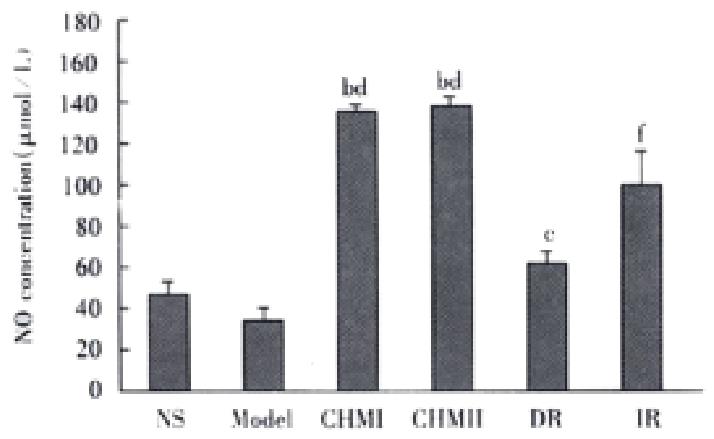
Figure 8 The change of NO concentration by using CHM,NO donor and NOS inhibitor in the mice.
- Citation: Ding SP, Li JC, Xu J, Mao LG. Study on the mechanism of regulation on peritoneal lymphatic stomata with Chinese herbal medicine. World J Gastroenterol 2002; 8(1): 188-192
- URL: https://www.wjgnet.com/1007-9327/full/v8/i1/188.htm
- DOI: https://dx.doi.org/10.3748/wjg.v8.i1.188


