Copyright
©The Author(s) 2002.
World J Gastroenterol. Feb 15, 2002; 8(1): 162-167
Published online Feb 15, 2002. doi: 10.3748/wjg.v8.i1.162
Published online Feb 15, 2002. doi: 10.3748/wjg.v8.i1.162
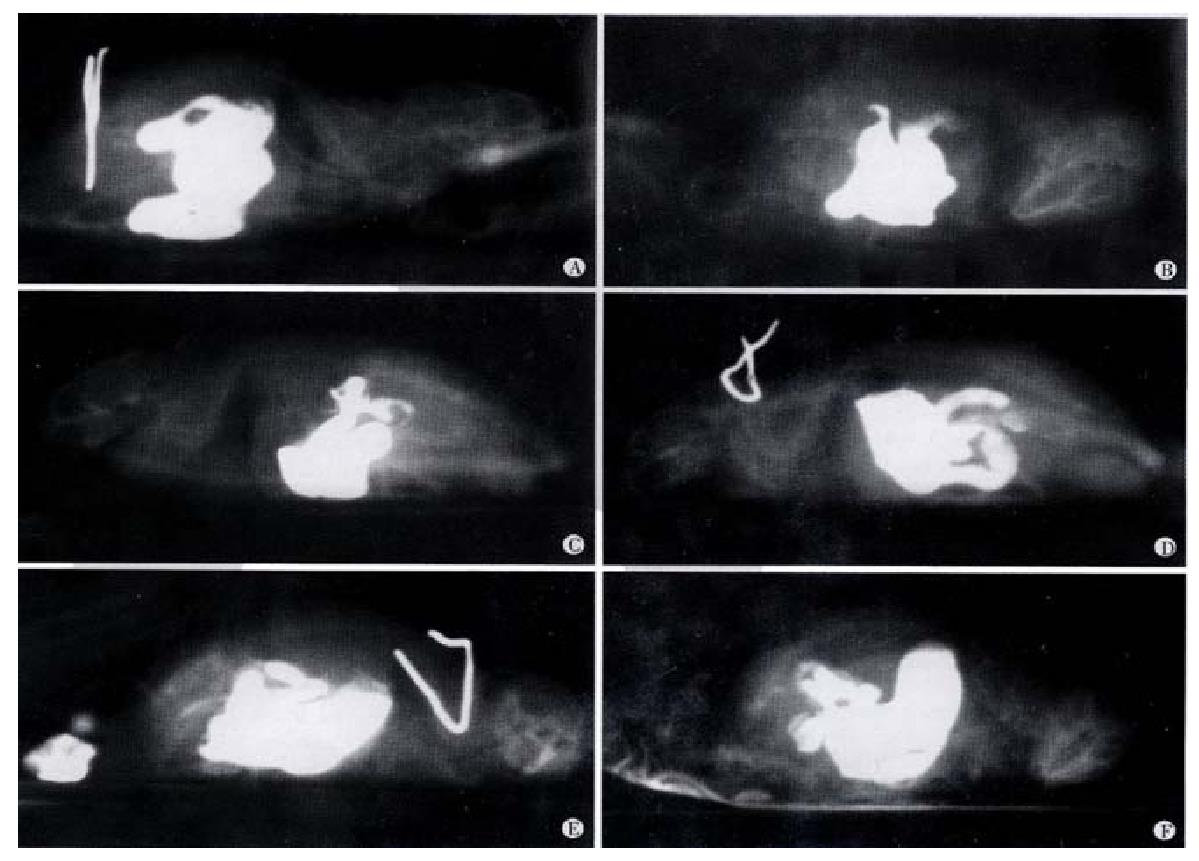
Figure 1 X- rays of gastrointestinal peristalsis in mice administered with SE.
A, B, C: 5 min, 2 h, 3 h after 9 g·L-1 NaCl gastric administration, respectively D, E, F: 5 min, 2 h, 3 h after 0.3 g SE gastric administration, respectively
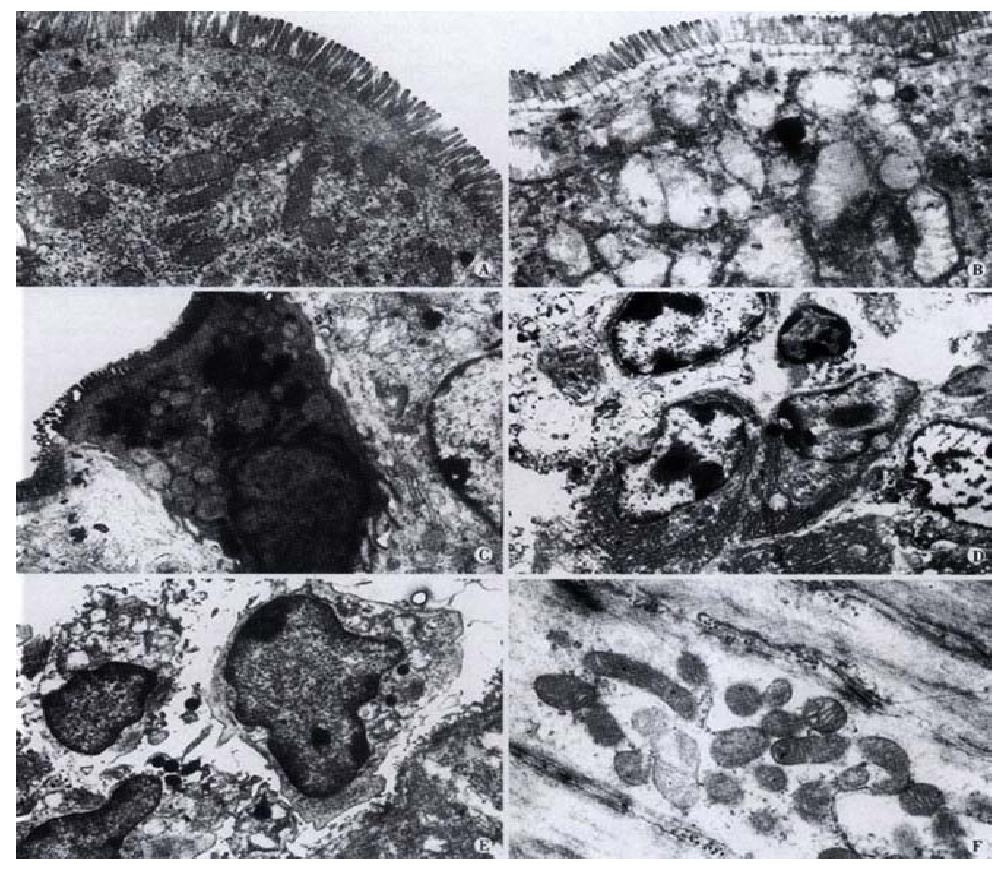
Figure 2 Ultrastructure of intestine and colon cells in mice receiving SE at week 10.
A: Normal epithelial cell; B: Intestinal cell after treatment with SE; C: Colon cell after treatment with SE; D: Increase in submucosal plasmacytes; E: Increase in submucosal macrophages; F: Minor degeneration of smooth muscle cells in intestine
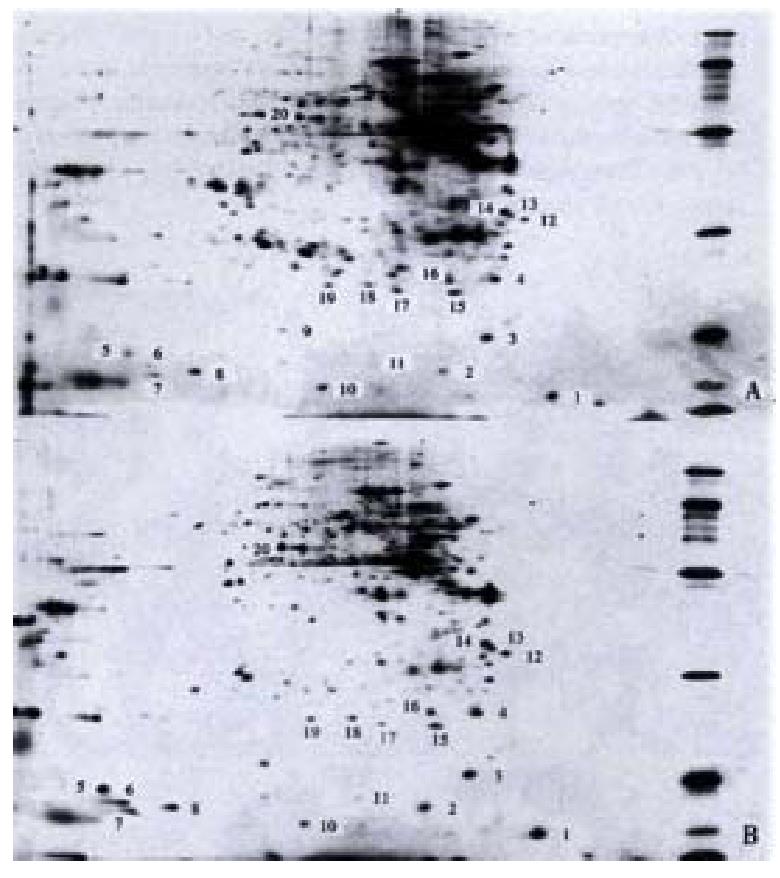
Figure 3 Proteins on two-dimension electropherosis maps A: Normal mice; B: Model mice
- Citation: Wang X, Zhong YX, Lan M, Zhang ZY, Shi YQ, Lu J, Ding J, Wu KC, Jin JP, Pan BR, Fan DM. Screening and identification of proteins mediating senna induced gastrointestinal motility enhancement in mouse colon. World J Gastroenterol 2002; 8(1): 162-167
- URL: https://www.wjgnet.com/1007-9327/full/v8/i1/162.htm
- DOI: https://dx.doi.org/10.3748/wjg.v8.i1.162


