Copyright
©The Author(s) 2001.
World J Gastroenterol. Dec 15, 2001; 7(6): 846-851
Published online Dec 15, 2001. doi: 10.3748/wjg.v7.i6.846
Published online Dec 15, 2001. doi: 10.3748/wjg.v7.i6.846
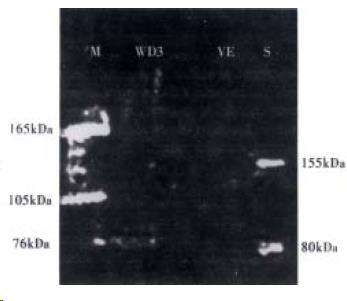
Figure 1 Western blotting analysis of WD protein separated from cultured human hepatocytes.
M: Protein molecular mass markers; WD3: The hepatocytes of one WD patient; VE: Blood vessel endotheliocyte; S: Normal human hepatocytes.
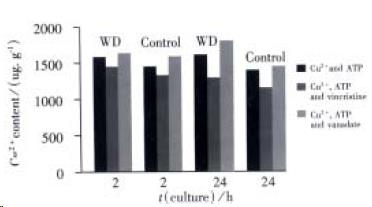
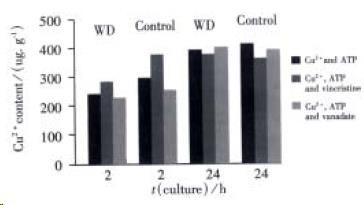
Figure 2 Cu2+ levels in hepatic cytosol at different culturing conditions.
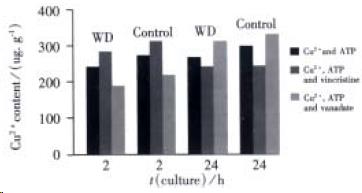
Figure 3 Cu2+ levels in hepatic microsome under different culturing conditions
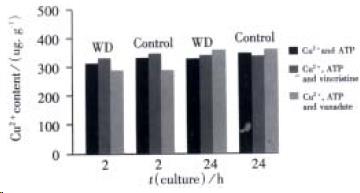
Figure 4 Cu2+ levels in hepatic lysosome under different culturing conditions.
Figure 5 Cu2+ levels in hepatic mitochondria under different culturing conditions.
- Citation: Hou GQ, Liang XL, Chen R, Tang L, Wang Y, Xu PY, Zhang YR, Ou CH. Copper transportion of WD protein in hepatocytes from Wilson disease patients in vitro. World J Gastroenterol 2001; 7(6): 846-851
- URL: https://www.wjgnet.com/1007-9327/full/v7/i6/846.htm
- DOI: https://dx.doi.org/10.3748/wjg.v7.i6.846


