Copyright
©The Author(s) 2001.
World J Gastroenterol. Dec 15, 2001; 7(6): 816-820
Published online Dec 15, 2001. doi: 10.3748/wjg.v7.i6.816
Published online Dec 15, 2001. doi: 10.3748/wjg.v7.i6.816
Figure 1 SF/HGF and c-met expression in HCC cell lines.
A: c-met transcription; B: SF/HGF transcription 1: Mark; 2: MHCC-1; 3: HepG2; 4: Hep3B; 5: SMMC7721; 6: pBS7.3; C: c-met protein expression; D: SF/HGF protein expression (1: Mark; 2: SMMC7721; 3: Hep3B; 4: HepG2; 5: MHCC-1).
Figure 2 A: cell morphology comparison.
× 400. Left: SMMC7721; Right: SF7721; Up: Control at “0” time ; Left down: SMMC7721 at 16 h after wound healing; Right down: SF7721 at 16 h after wound helaing; B: Cell morphology comparison × 400; C: Cell growth curve before and after gene transfection.
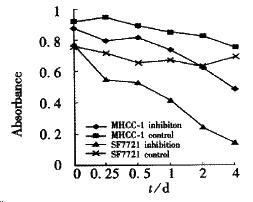
Figure 3 C-met inhibition assay.
- Citation: Xie Q, Liu KD, Hu MY, Zhou K. SF/HGF-c-Met autocrine and paracrine promote metastasis of hepatocellular carcinoma. World J Gastroenterol 2001; 7(6): 816-820
- URL: https://www.wjgnet.com/1007-9327/full/v7/i6/816.htm
- DOI: https://dx.doi.org/10.3748/wjg.v7.i6.816


