Copyright
©The Author(s) 2001.
World J Gastroenterol. Aug 15, 2001; 7(4): 551-554
Published online Aug 15, 2001. doi: 10.3748/wjg.v7.i4.551
Published online Aug 15, 2001. doi: 10.3748/wjg.v7.i4.551
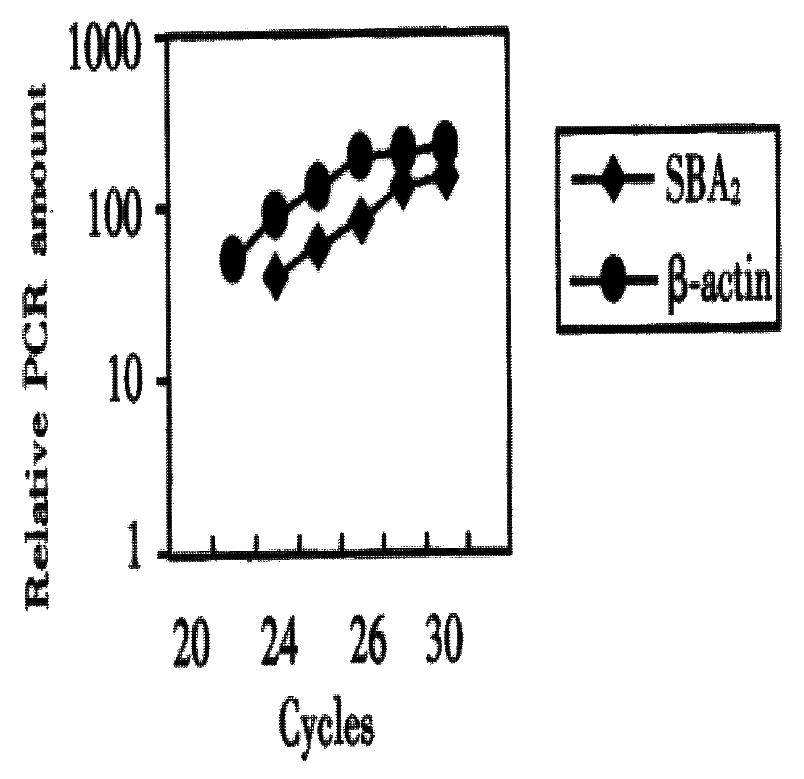
Figure 1 Detection of the exponential range by termination at se-quential PCR cycles.
1-7: Cycles of 20, 22, 24, 25, 26, 28 and 30, respectively. M: Marker (100 bp DNA ladder).
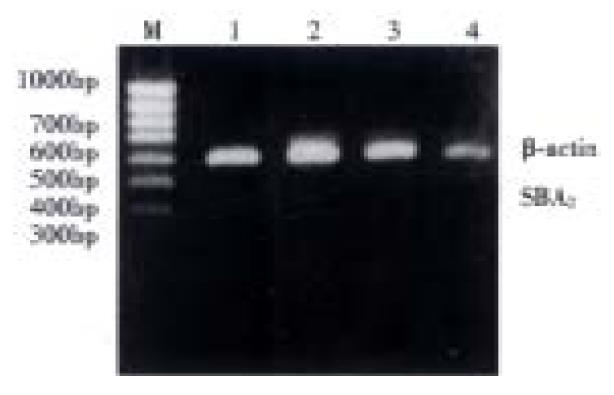
Figure 2 Detection of the exponential range by serial dilutions of cDNA.
1-4: cDNA of volume of 5, 2.5, 1.25, and 0.625 μL, respectively. M: Marker (100 bp DNA ladder).
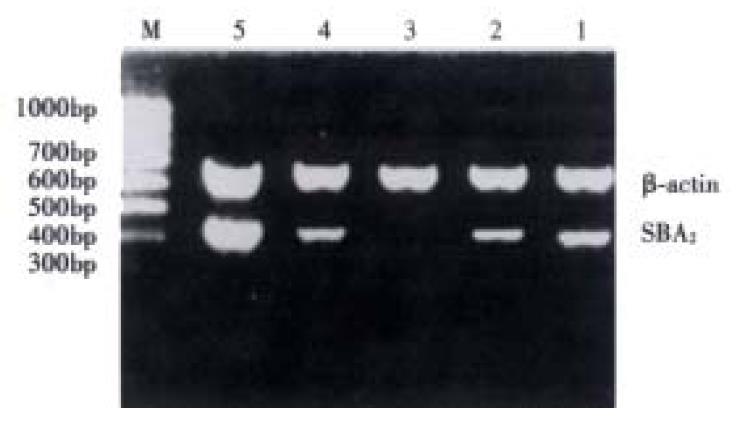
Figure 3 Relative quantification of SBA2 mRNA in colorectal tissues.
1-4: Moderately, moderately, poorly, and well differentiated CRC, respectively. 5: Healthy colorectal mucosa. M: Marker (100 bp DNA ladder).
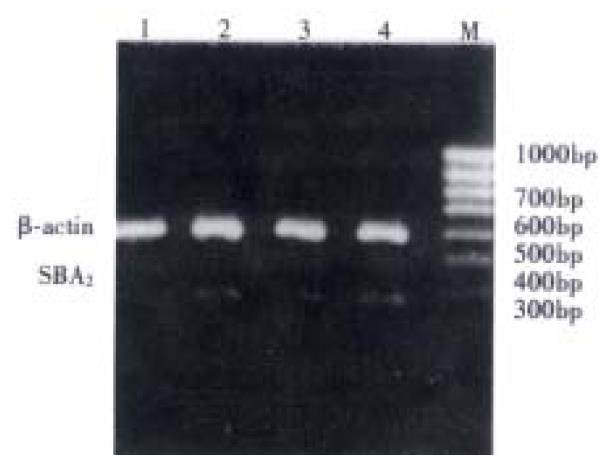
Figure 4 Relative quantification of SBA2 mRNA in cell lines of CRC.
1-4: Human CRC cell line CloneA, CX1, CCL187, and LS174T, respectively. M: Marker (100 bp DNA ladder).
- Citation: Li XG, Song JD, Wang YQ. Differential expression of a novel colorectal cancer differentiation-related gene in colorectal cancer. World J Gastroenterol 2001; 7(4): 551-554
- URL: https://www.wjgnet.com/1007-9327/full/v7/i4/551.htm
- DOI: https://dx.doi.org/10.3748/wjg.v7.i4.551


