Copyright
©The Author(s) 2001.
World J Gastroenterol. Aug 15, 2001; 7(4): 532-536
Published online Aug 15, 2001. doi: 10.3748/wjg.v7.i4.532
Published online Aug 15, 2001. doi: 10.3748/wjg.v7.i4.532
Figure 1 Changes of growth fraction of lmphocytes (G2 + S/G1 + G2 + S + M) in draining lymph nodes of Hca-F/Hca-P burden mice.
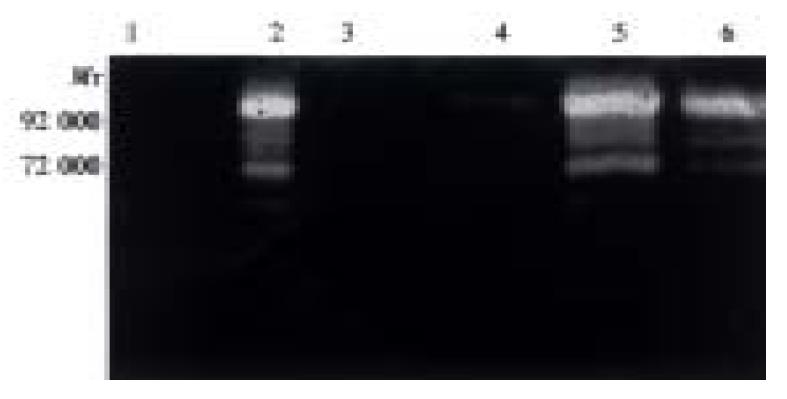
Figure 2 MMPs activity of Hca-F and Hca-P cells in RPMI 1640 with or without lymph node extract using zymographic analysis.
1. lymph node extract; 2. Type-four collagenase; 3. Hca-F cells; 4. Hca-P cells; 5. Hca-F cells in lymph node extract; 6. Hca-P cells in lymph node extract.
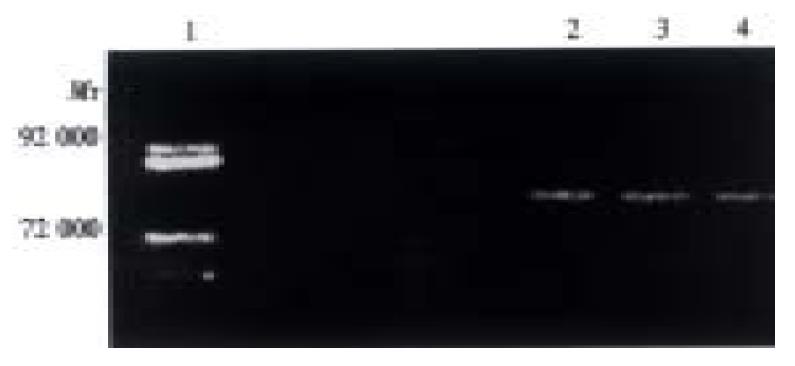
Figure 3 MMPs activity of Hca-F and Hca-P cells in liver extract by using zymographic analysis.
1. Type-four collagenase; 2. Hca-F cells in liver extract; 3. Hca-P cells in liver extract; 4. Liver extract.
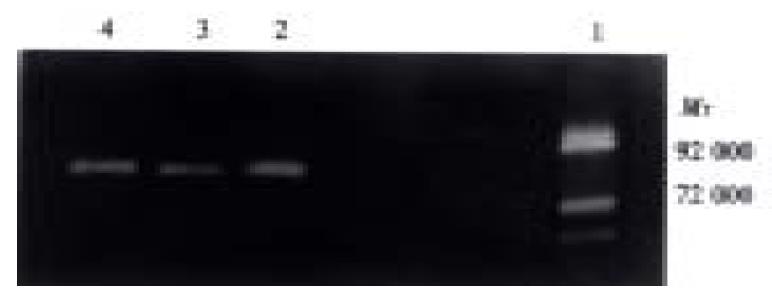
Figure 4 MMPs activity of Hca-F and Hca-P cells in spleen extract by using zymographic analysis.
1. Type-four collagenase; 2. Hca-F cells in spleen extract; 3. Hca-P cells in spleen extract; 4. Spleen extract.
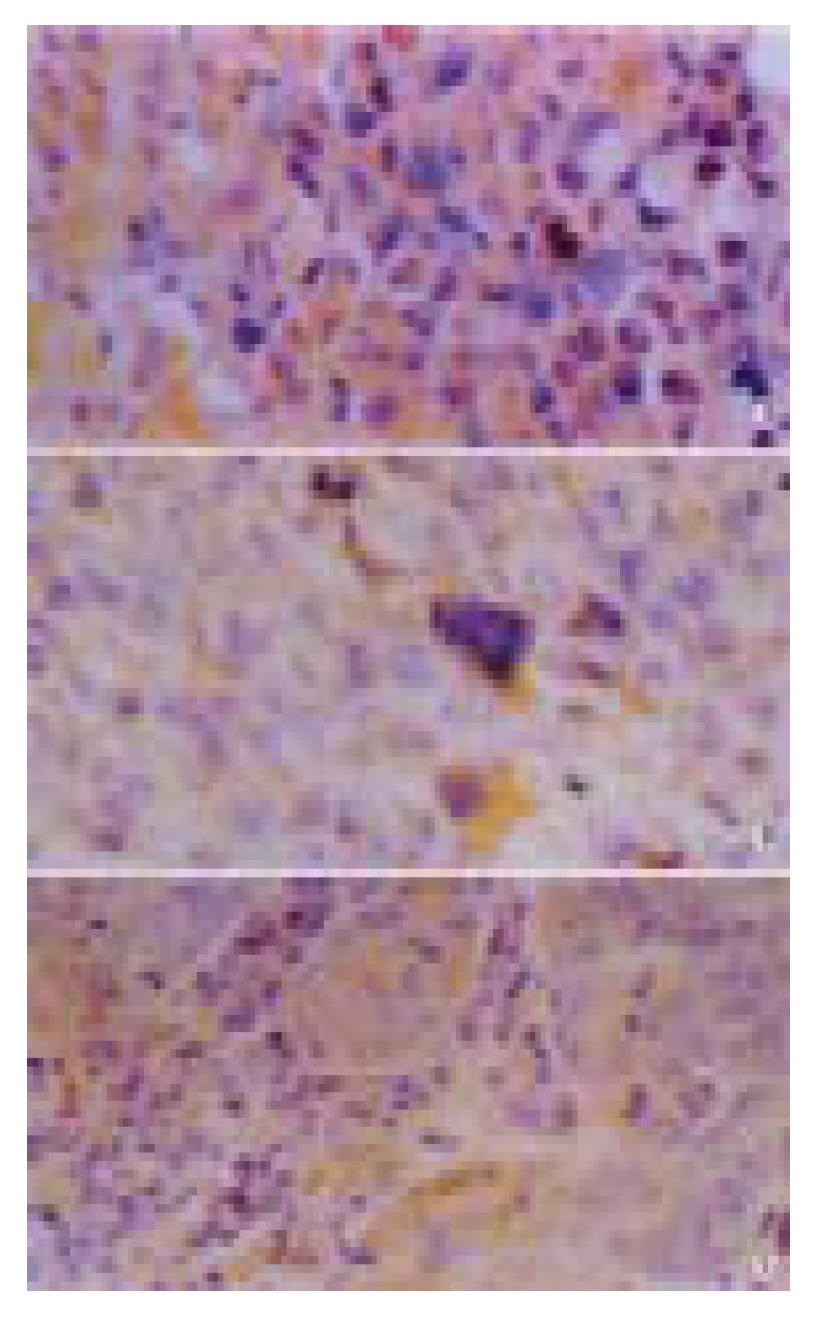
Figure 5 Fas-L expressed in Hca-F and Hca-P cells.
A: Fas-L expressed in Hca-F cells; B: in Hca-P cells; C: in metastatic Hca-F cells.
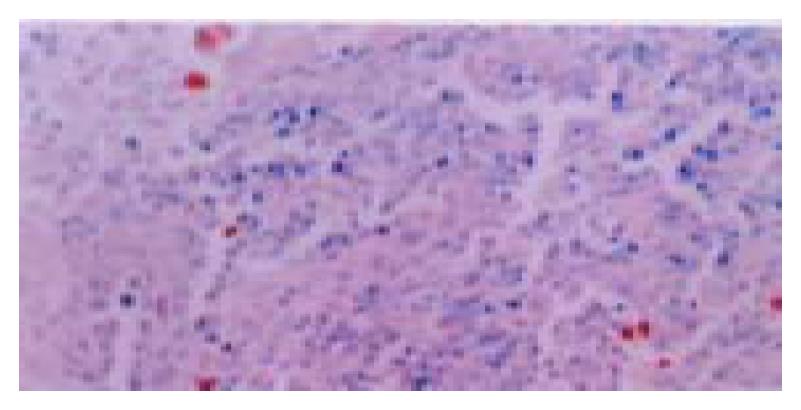
Figure 6 TUNEL of metastatic lymph node of Hca-F cells.
- Citation: Hou L, Li Y, Jia YH, Wang B, Xin Y, Ling MY, Lü S. Molecular mechanism about lymphogenous metastasis of hepatocarcinoma cells in mice. World J Gastroenterol 2001; 7(4): 532-536
- URL: https://www.wjgnet.com/1007-9327/full/v7/i4/532.htm
- DOI: https://dx.doi.org/10.3748/wjg.v7.i4.532


