Copyright
©The Author(s) 2001.
World J Gastroenterol. Aug 15, 2001; 7(4): 527-531
Published online Aug 15, 2001. doi: 10.3748/wjg.v7.i4.527
Published online Aug 15, 2001. doi: 10.3748/wjg.v7.i4.527
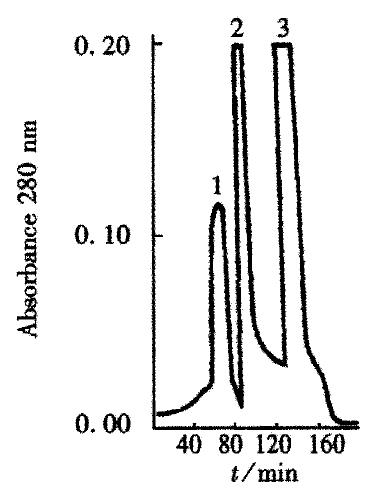
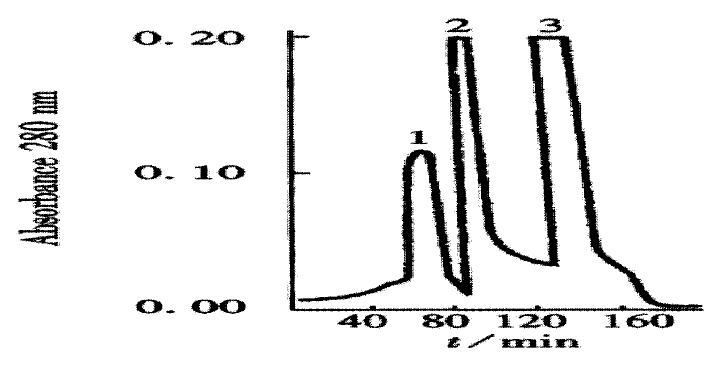
Figure 1 Ion-exchange chromatography of acid/ethanol extract on a CM Sepharose column.
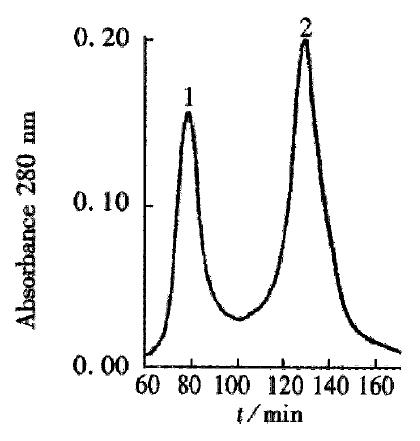
Figure 2 Gel chromatography of the CM-Sepharose peak 2 and peak 3 fractions on a Superdex-75 column.
Figure 3 Molecular mass analysis of the extracted TGFβ (SDS PAGE).
Right Lane: marker proteins.
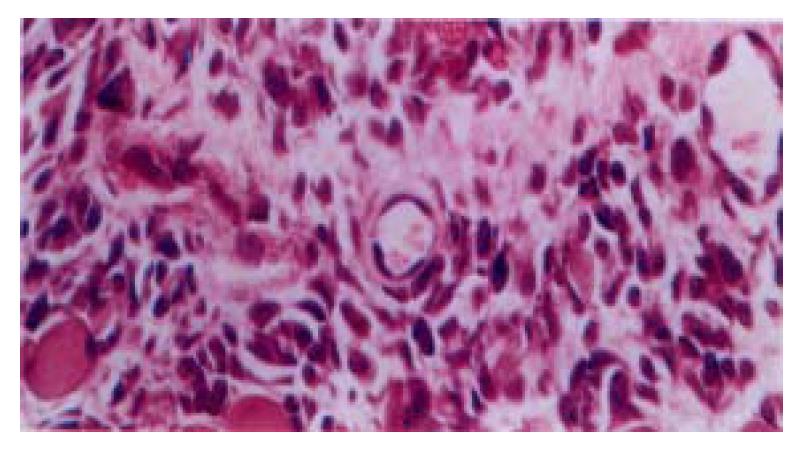
Figure 4 The granulation tissue formation after 72 hrs subcutaneous injection of TGFβ.
HE × 400
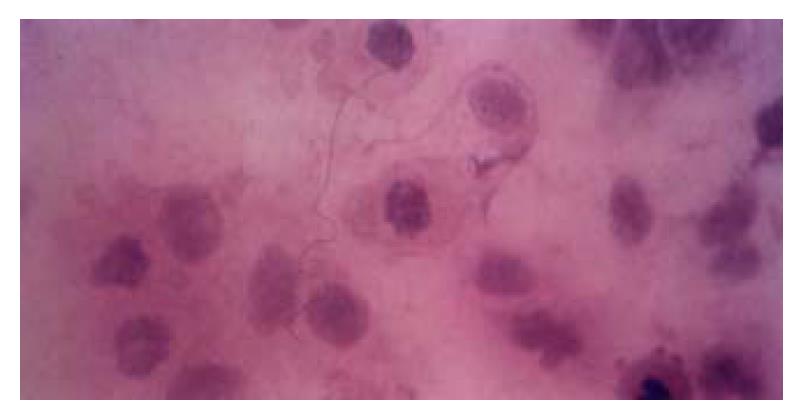
Figure 5 Hepatocytes QZG displayed apoptosis after being treated with 8 μg/L TGFβ for 12 hrs.
HE × 400
- Citation: Si XH, Yang LJ. Extraction and purification of TGFβ and its effect on the induction of apoptosis of hepatocytes. World J Gastroenterol 2001; 7(4): 527-531
- URL: https://www.wjgnet.com/1007-9327/full/v7/i4/527.htm
- DOI: https://dx.doi.org/10.3748/wjg.v7.i4.527


