Copyright
©The Author(s) 2001.
World J Gastroenterol. Jun 15, 2001; 7(3): 431-434
Published online Jun 15, 2001. doi: 10.3748/wjg.v7.i3.431
Published online Jun 15, 2001. doi: 10.3748/wjg.v7.i3.431
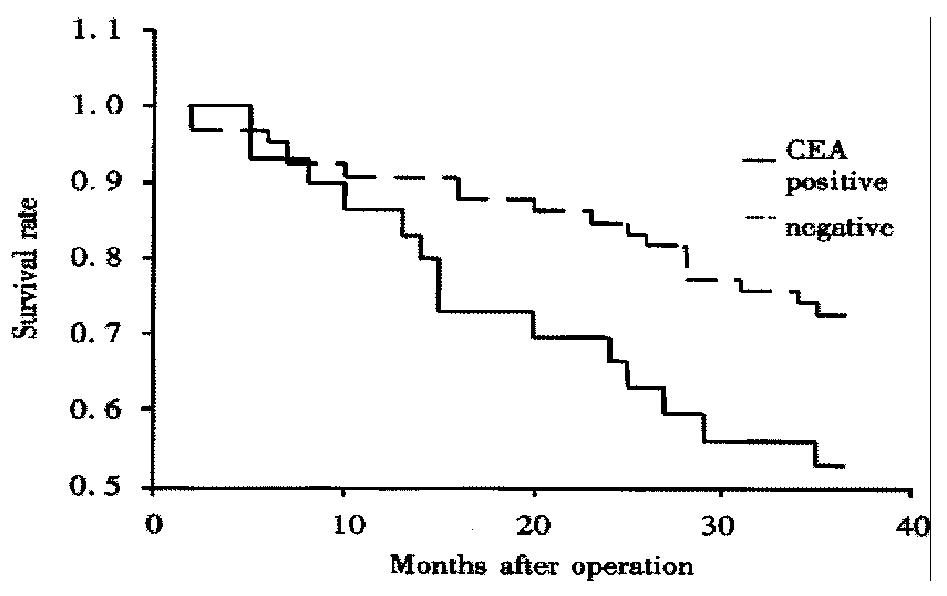
Figure 1 Survival curves of serum CEA-positive and CEA-negative patients.
The difference in survival rates was statistically significant (P = 0.042).
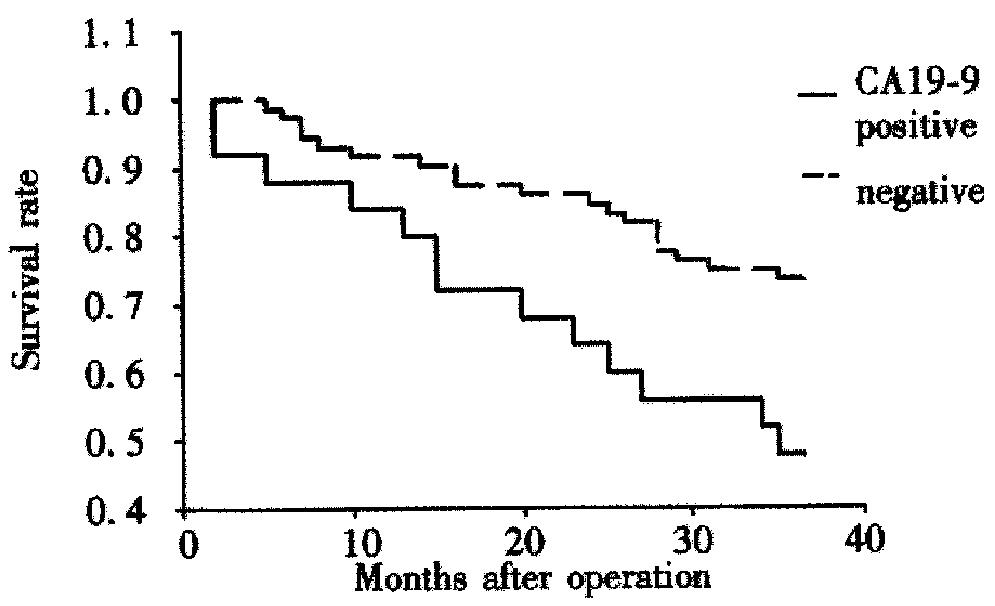
Figure 2 Survival curves of serum CA19-9 positive and CA19-9-negative patients.
The difference in survival rates was statistically significant (P = 0.011).
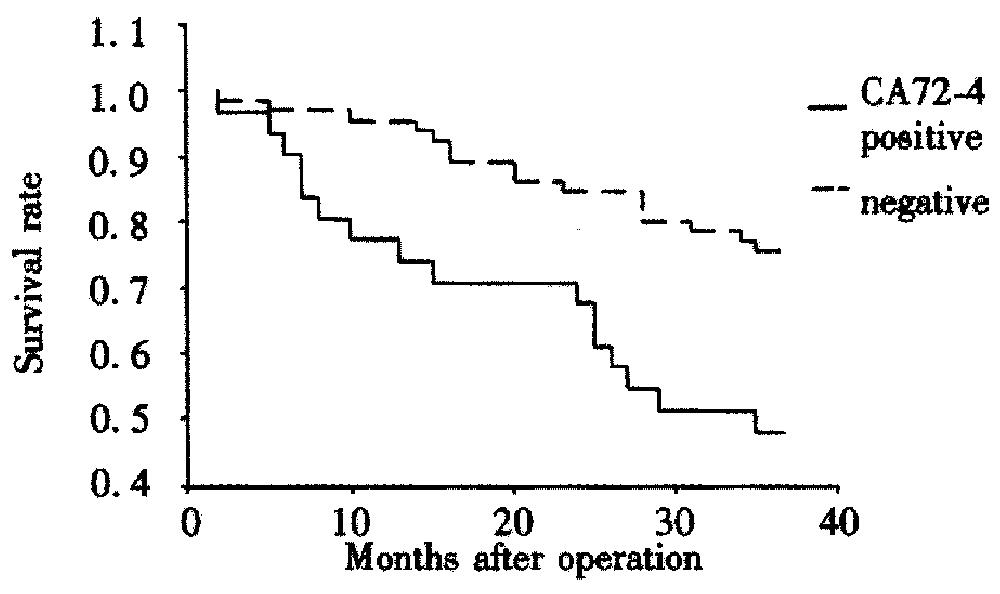
Figure 3 Survival curves of serum CA72-4 positive and CA72-4-negative patients.
The difference in survival rates was statistically significant (P = 0.003).
- Citation: Zheng CX, Zhan WH, Zhao JZ, Zheng D, Wang DP, He YL, Zheng ZQ. Prognostic value of preoperative serum levels of CEA, CA19-9 and CA72-4 in patients with colorectal cancer. World J Gastroenterol 2001; 7(3): 431-434
- URL: https://www.wjgnet.com/1007-9327/full/v7/i3/431.htm
- DOI: https://dx.doi.org/10.3748/wjg.v7.i3.431


