Copyright
©The Author(s) 2001.
World J Gastroenterol. Apr 15, 2001; 7(2): 193-197
Published online Apr 15, 2001. doi: 10.3748/wjg.v7.i2.193
Published online Apr 15, 2001. doi: 10.3748/wjg.v7.i2.193
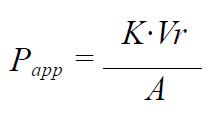
Math 1 Math(A1).
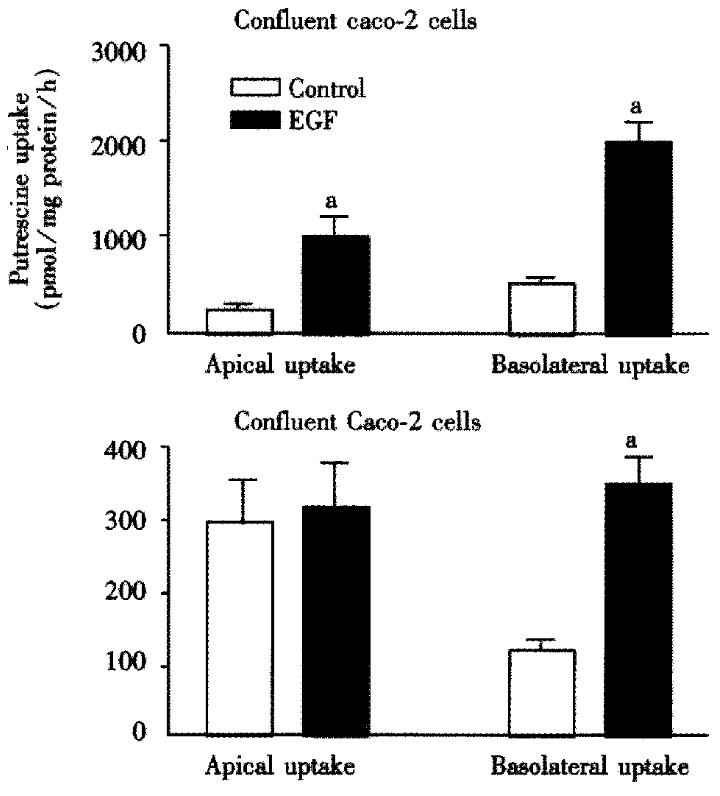
Figure 1 Apical vs.
basolateral uptake of putrescine in confluent (day 7) and differentiated (day 14) Caco-2 cells in culture. The experiments were carried out as indicated in the Methods section. EGF (100 μg/L) was added to the basolateral chamber, and the cells were incubated for 12 h. Mean ± SEM, N = 4. aP < 0.001 vs control.
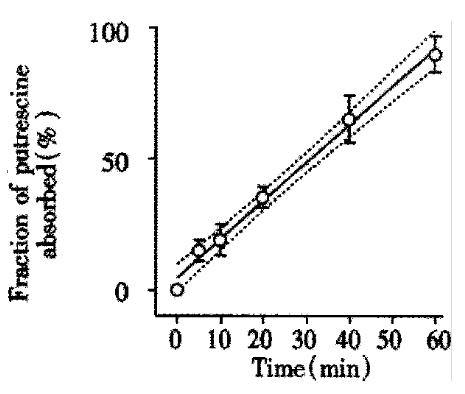
Figure 2 Transepithelial permeability of putrescine across Caco-2 cell monolayers.
The experiments were done as described in Methods section, with 100 μM (0.1 μCi/mL) putrescine added to the apical chamber and incubation time 60 min. Mean ± SEM, N = 4.
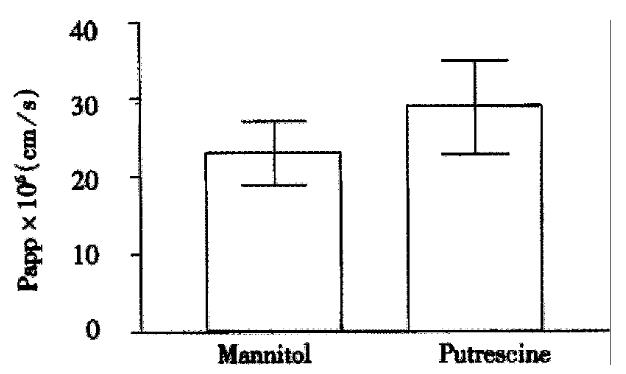
Figure 3 Apparent permeability coefficients for mannitol and putrescine.
Each bar represents mean ± SEM of six experiments. Differences between the values are not statistically significant.
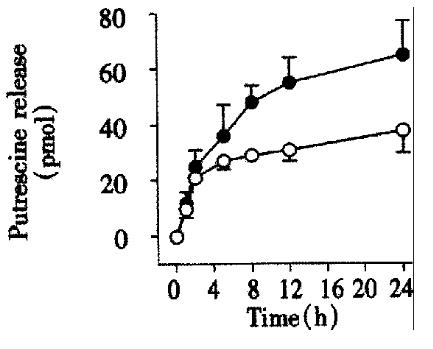
Figure 4 Putrescine release from Caco-2 cells pre-loaded with physiological concentrations (100 μmol/sample) putrescine ± EGF.
Each data point represents mean ± SEM of six experiments.
- Citation: Milovic V, Turchanowa L, Stein J, Caspary WF. Transepithelial transport of putrescine across monolayers of the human intestinal epithelial cell line, Caco-2. World J Gastroenterol 2001; 7(2): 193-197
- URL: https://www.wjgnet.com/1007-9327/full/v7/i2/193.htm
- DOI: https://dx.doi.org/10.3748/wjg.v7.i2.193


