Copyright
©The Author(s) 2000.
World J Gastroenterol. Dec 15, 2000; 6(6): 805-811
Published online Dec 15, 2000. doi: 10.3748/wjg.v6.i6.805
Published online Dec 15, 2000. doi: 10.3748/wjg.v6.i6.805
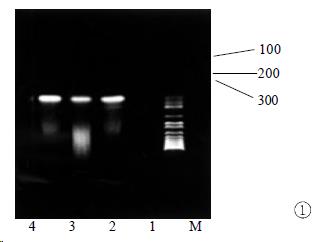
Figure 1 RT-PCR amplification result of minus-strand RNA in extrahepatic tissues.
M: markers; 1: negative control; 2-4: amplification results of kidney, heart, and pancreas. The expected size of the amplification product is 145 bp
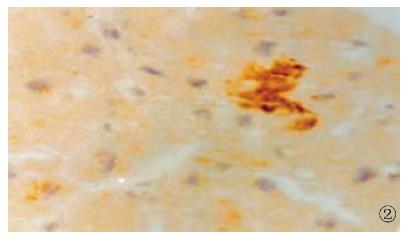
Figure 2 The expression of HCV NS3 in myocardial cells, show ing brown yellow.
S-P (DAB) × 400
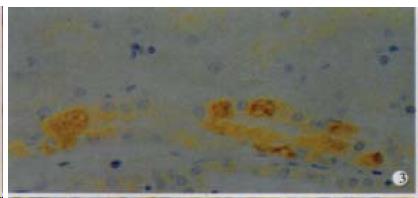
Figure 3 The expression of HCV NS5 in epithelial cells of tubules, showing brown yellow.
S-P (DAB) × 400
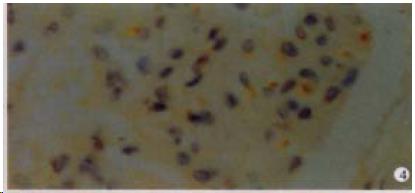
Figure 4 The expression of HCV NS5 in the glomerulus, showing brown yellow.
S-P (DAB) × 400
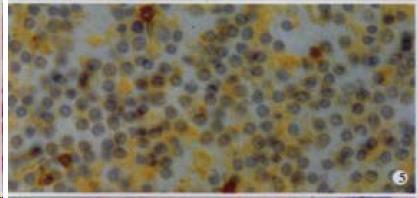
Figure 5 The expression of HCV NS3 in mononuclear cells in lymph node, showing brown yellow.
S-P (DAB) × 400
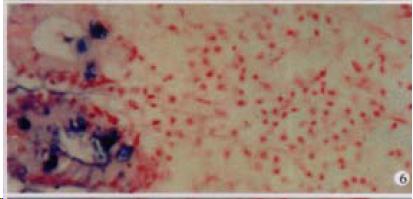
Figure 6 The expression of HCV RNA in epithelial cells of mucous membrane sinus of gallbladder, showing purple blue.
ISH × 200
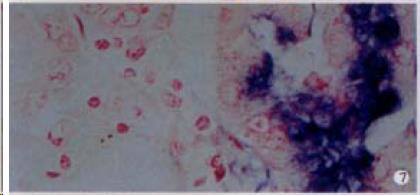
Figure 7 The expression of HCV RNA in epithelial cells of intestinal gladular, showing purple blue.
ISH × 400
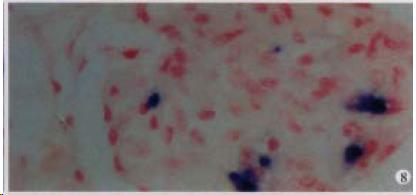
Figure 8 The expression of HCV RNA in the glomerulus, showing purple blue.
ISH × 400
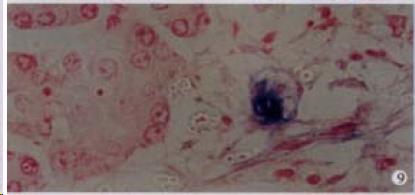
Figure 9 The expression of HCV RNA in the pancreas acinar cells, showing purple blue.
ISH × 400
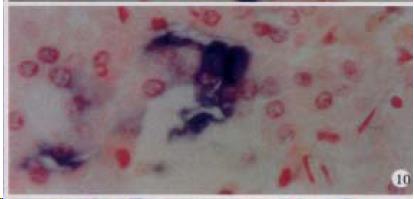
Figure 10 The expression of HCV RNA in cortex cells in adrenal gland, showing purple blue.
ISH × 400
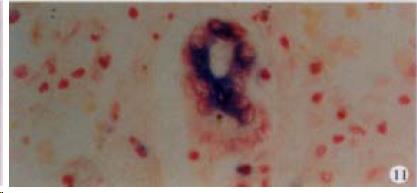
Figure 11 The expression of HCV RNA in bile duct epithelial cells in liver, showing purple blue.
ISH × 400
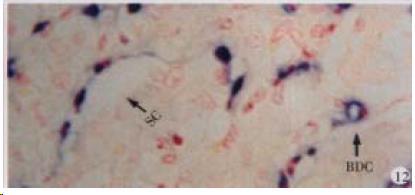
Figure 12 The expression of HCV RNA in bile duct cells (BDC), sinusoidal cells (SC) in liver, showing purple blue.
ISH × 400
- Citation: Yan FM, Chen AS, Hao F, Zhao XP, Gu CH, Zhao LB, Yang DL, Hao LJ. Hepatitis C virus may infect extrahepatic tissues in patients with hepatitis C. World J Gastroenterol 2000; 6(6): 805-811
- URL: https://www.wjgnet.com/1007-9327/full/v6/i6/805.htm
- DOI: https://dx.doi.org/10.3748/wjg.v6.i6.805


