Copyright
©The Author(s) 2000.
World J Gastroenterol. Aug 15, 2000; 6(4): 513-521
Published online Aug 15, 2000. doi: 10.3748/wjg.v6.i4.513
Published online Aug 15, 2000. doi: 10.3748/wjg.v6.i4.513
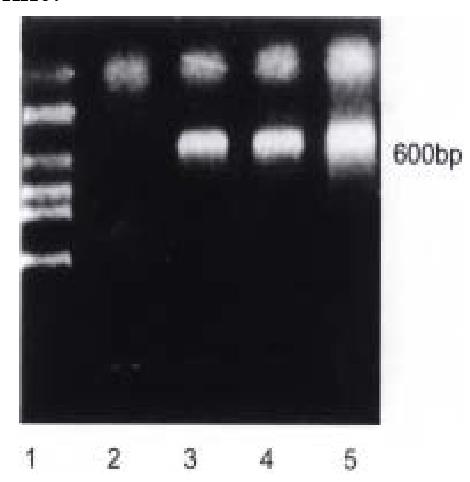
Figure 1 RT-PCR results of human p27KIP1 RNA in Bak transfected HCC-9204 cell line.
Predicted PCR product size is about 600 bp. lane 1: Molecular we ight Marker (Takara, DL 2000); lane 2: Bak (0 h); lane 3: Bak (24 h); lane 4: Bak (48 h)
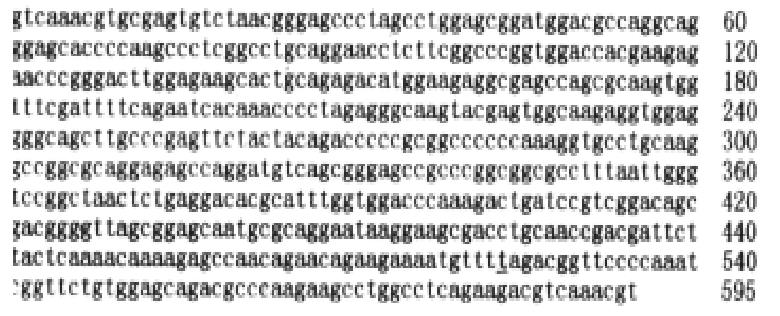
Figure 2 The nucleotide sequences of p27KIP1.
Only one nucleotide is changed from c→t at site No 524, while the sequences of amino acids are the same
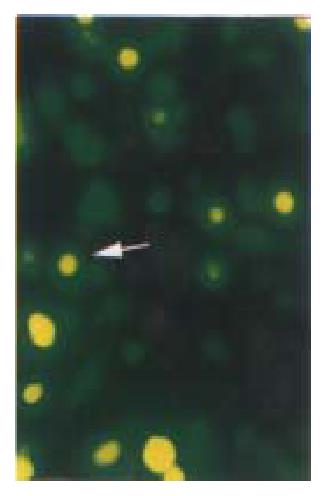
Figure 3 Cell slides under Nikon Eclipse TE200 fluorescence microscope using excitation light at either 488 nm to detect GFP (emission filter 522 nm).
Distribution of GFP p27KIP1 fusion protein expressed in living HCC-9204 cells 8 after 100 μmol/L ZnSO4 treatment, indicated by an arrow. × 200
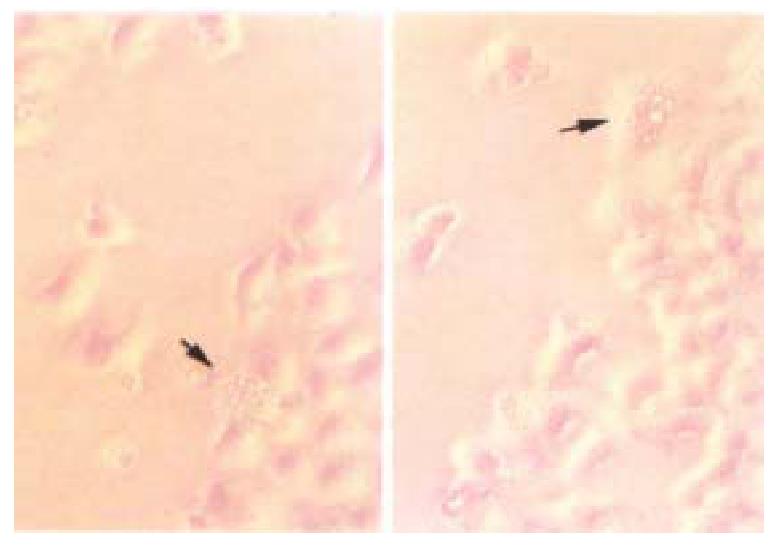
Figure 4 Transient transfected HCC-9204 cells exhibiting typical active cell death such as cell blebbing, condensed and rounded cells as seen under, Nikon Eclipse TE200 phase contrast microscope indicated by an arrow.
× 200
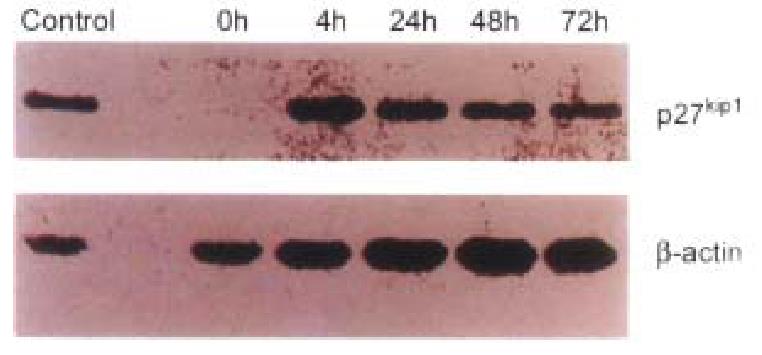
Figure 5 The results of Western blots of lysates from transfected HCC-9204 cells, probed with antibodies against human p27KIP1.
Excellent p27KIP1 expression was observed in HCC-9204 cells even 4 h after induction with zinc.
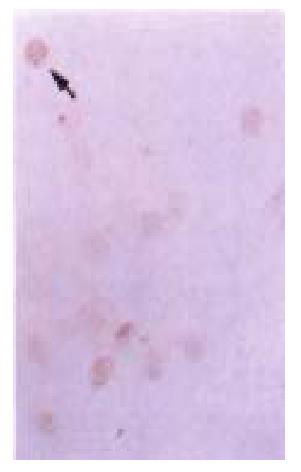
Figure 6 p27KIP1 detected by DAKO LABC kit in transfected HCC-9204 cells after 24 h of addition of ZnSO4.
p27KIP1 dark-brown granules are present in the nuclei of p27KIP1 transfected HCC-9204 cells, as in dicated by an arrow. × 200
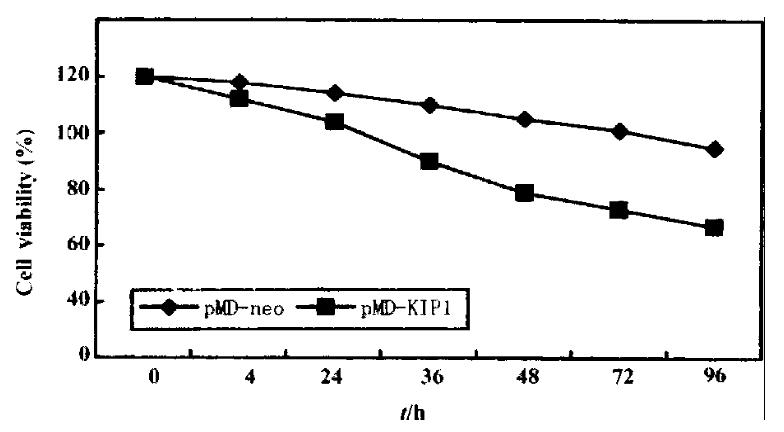
Figure 7 Time course of growth of cells transfected with pMD-KIP1 expressing p27KIP1.
HCC-9204 cells were induced by 100 μmol/L ZnSO4. HCC-9204 cells viability was determined by microscopic examination of cells stained by 1 g/L trypan blue, counting cells on a hemocytometer at the time point indicated. Each treatment was triplicate.
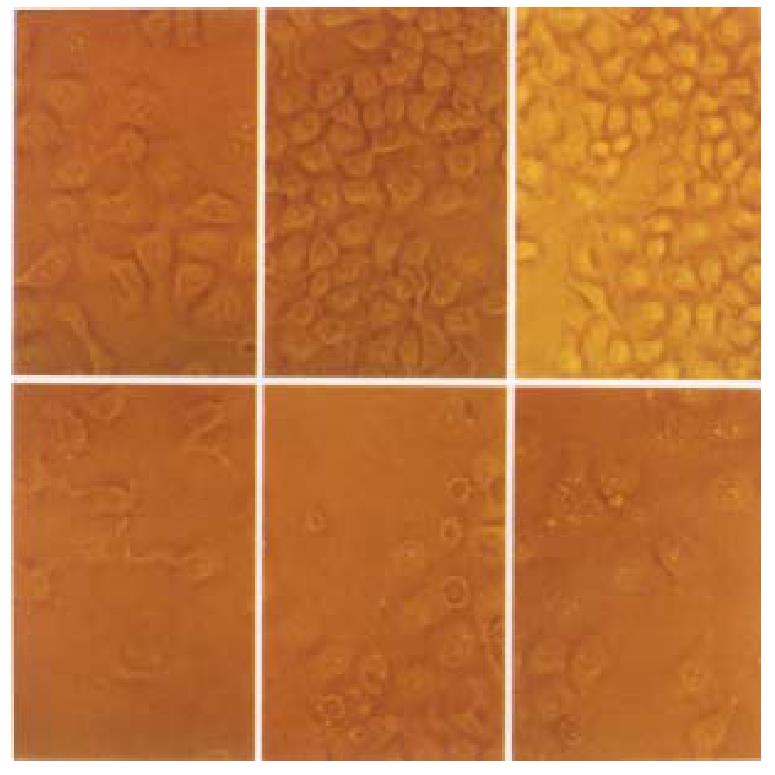
Figure 8 Time course effect of p27KIP1-on HCC-9204 cells growth.
Cells were seeded at 10\+5 per dish. HCC-9204 cells were induced by 100 μmol/L ZnSO4 at the time indicated. Cells morphology was observed under Nikon Eclipse TE 200 phase-contrast microscopic at 0, 24 and 48 h post addition of zinc. “Uppe r-row” represents pMD-neo transfected cells; “Lower-row” represents pMD- Bak transfected cells. × 200
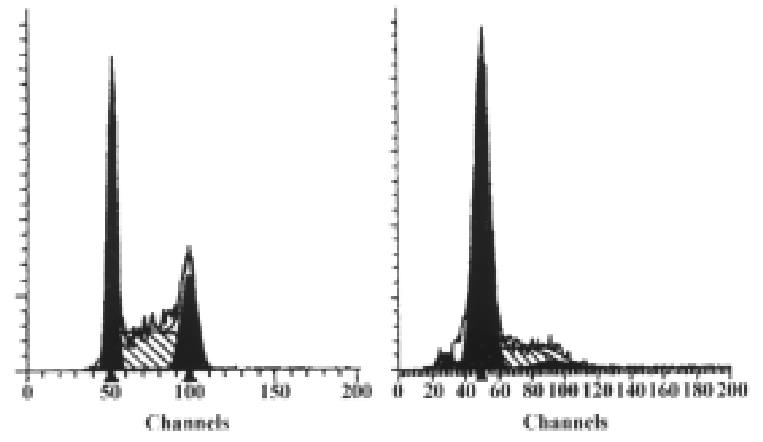
Figure 9 Result of flow cytometric analysis.
Cells were stably transfectd with p27KIP1 and induced by 100 μmol/L ZnSO4. The percentage of each phase for each group (before or 24 h after addition of zinc) is indicated in each panel.
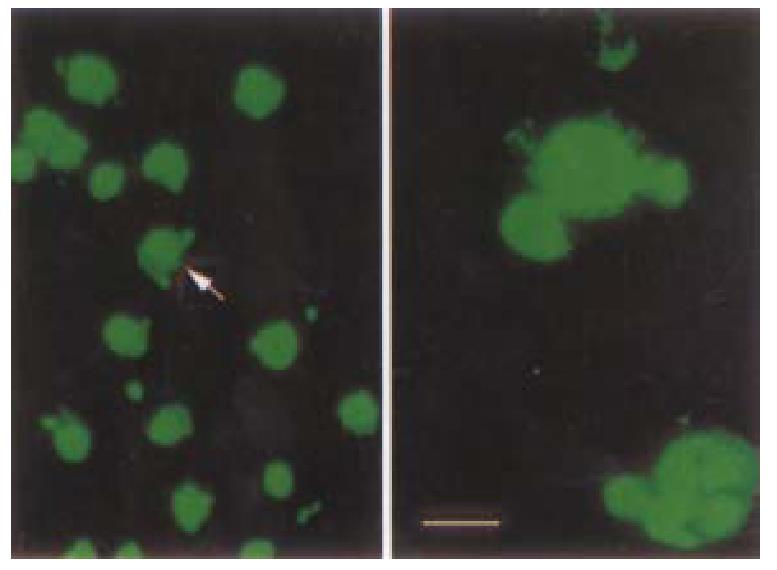
Figure 10 TUNEL assay demonstrating obvious apoptotic changes in HCC-9204/p27KIP1 24 h after addition of zinc under laser confocal microscope as in dicated by an arrow.
(Bar represents 10 μm)
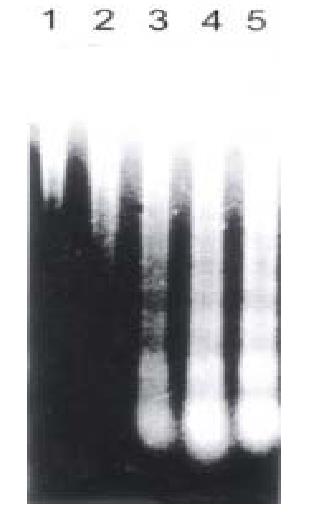
Figure 11 Analysis of DNA ladder formation at 0 (lane 1), 4 h (lane2), 24 h (lane 3), 48 h (lane 4), 72 h (lane 5) post addition of zinc in HCC-9204 cell line.
Eac h lane was loaded with 10 μg DNA.
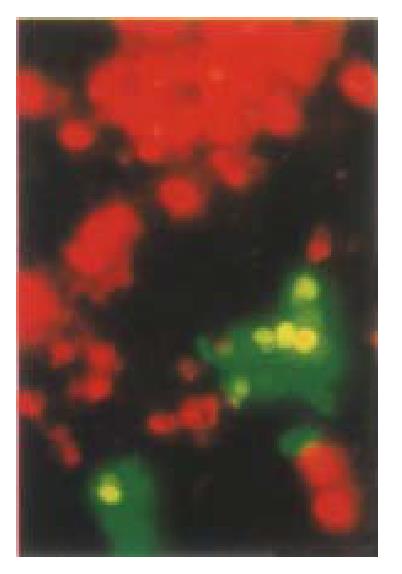
Figure 12 Comparative study of whether apoptotic cells can still express GFP.
A GFP positive clone was chosen and counterstained with PI. Apoptotic cells were stained with PI and no longer expressed GFP. HCC-9204 cells were observed under Nikon Eclipse TE200 fluorescent phase-contrast microscopic. × 200
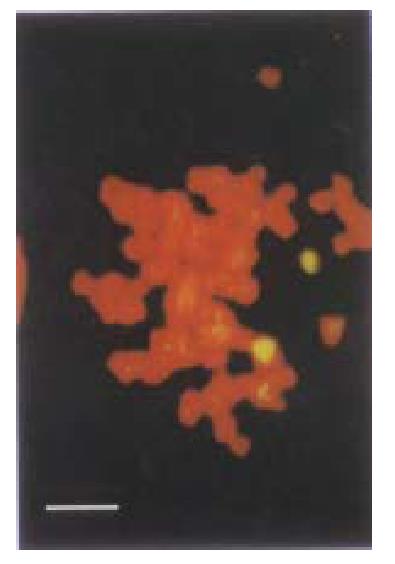
Figure 13 In situ fluorescence hybridization with FITC labelled p27KIP1 probe.
Two signals were observed in the chromosome under laser confocal micro scopy. (Bar represents 5 μm)
- Citation: Li J, Yang XK, Yu XX, Ge ML, Wang WL, Zhang J, Hou YD. Overexpression of p27KIP1 induced cell cycle arrest in G1 phase and subsequent apoptosis in HCC-9204 cell line. World J Gastroenterol 2000; 6(4): 513-521
- URL: https://www.wjgnet.com/1007-9327/full/v6/i4/513.htm
- DOI: https://dx.doi.org/10.3748/wjg.v6.i4.513


