Copyright
©The Author(s) 2000.
World J Gastroenterol. Aug 15, 2000; 6(4): 508-512
Published online Aug 15, 2000. doi: 10.3748/wjg.v6.i4.508
Published online Aug 15, 2000. doi: 10.3748/wjg.v6.i4.508
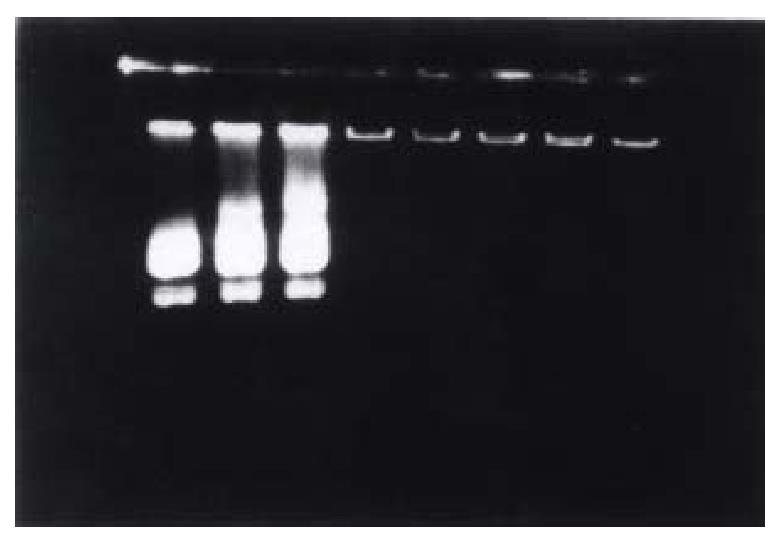
Figure 1 Determination of optimal proportion of G-PLL bound to plasmid by 1% agar ose electrophoresis.
Lane 1-8 are respectively 0.05 μg, 0.1 μg, 0.2 μg, 0.3 μg, 0.4 μg, 0.5 μg, 1.0 μg, and 1.5 μg G-PLL mixed with 1 μg pTM/MMP-1 p lasmid. pTM/MMP-1 1 μg plasmid could only be bound completely by more than 0. 4 μg G-PLL.
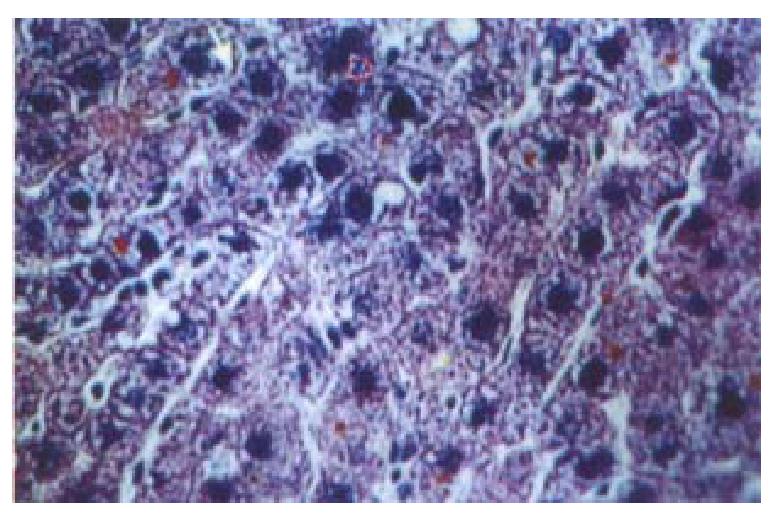
Figure 2 Immunostaining of flag-domain tag in the liver all hours after admin istration of the plasmid bound to G-PLL (galactose-terminal glyco-poly-L-lysine) via cauda vein.
× 200
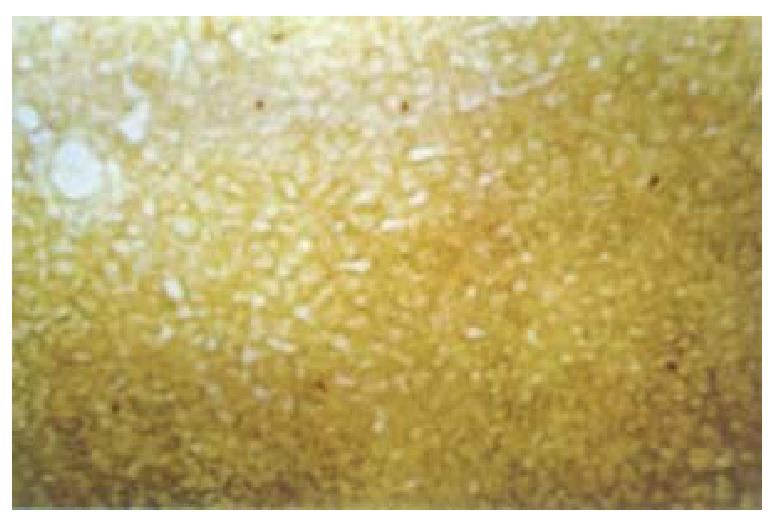
Figure 3 In situ hybridization with biotin labeled oligonucleotide probe in the liver 3 wk after the administration of the plasmid bound to G-PLL (galacto se-terminal glyco-poly-L-lysine) via abdominal cavity.
× 100
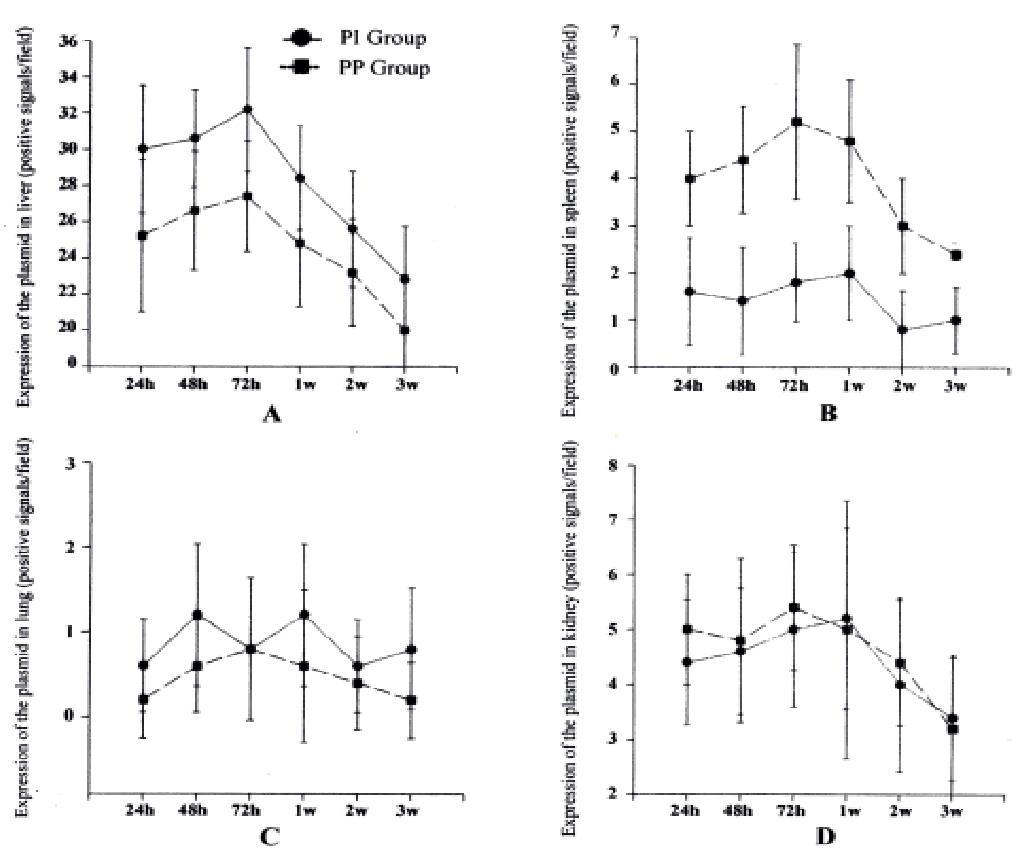
Figure 4 The distribution and expression of the plasmid bound to G-PLL (galactosetermina l glyco-poly-L-lysine) in different tissues and at different time period and administered intraperitoneally or intravenously.
A: liver, B: spleen, C: lung, D: kidney. PI: plasmid bound to G-PLL introduced intravenously, PP: plasmid bound to G-PLL introduced intraperitoneally.
- Citation: Yang CQ, Wang JY, Fang GT, Liu JJ, Guo JS. Comparison between intravenous and peritoneal route on liver targeted uptake and expression of plasmid delivered by Glyco-poly-L-lysine. World J Gastroenterol 2000; 6(4): 508-512
- URL: https://www.wjgnet.com/1007-9327/full/v6/i4/508.htm
- DOI: https://dx.doi.org/10.3748/wjg.v6.i4.508


