Copyright
©The Author(s) 2000.
World J Gastroenterol. Aug 15, 2000; 6(4): 475-482
Published online Aug 15, 2000. doi: 10.3748/wjg.v6.i4.475
Published online Aug 15, 2000. doi: 10.3748/wjg.v6.i4.475
Figure 1 Models of gastric mucin structure.
Lower bars represent cDNA sequences of MUC1 cell-surface mucin and MUC5AC secreted mucin, with different domains labeled. Resulting structures of the proteins with attached carbohydrate are schematically represented above.
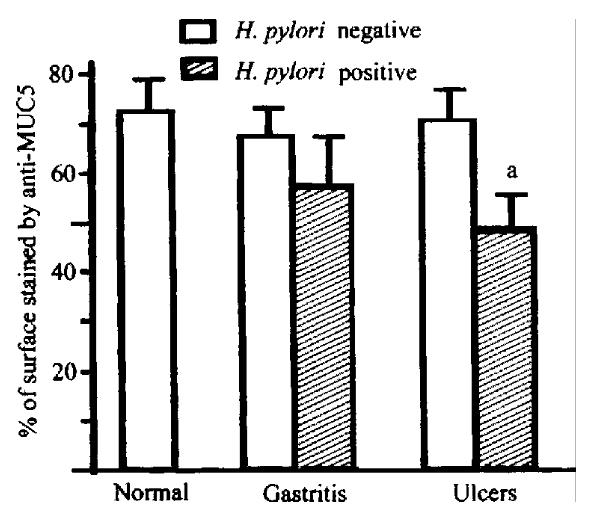
Figure 2 Expression of MUC5AC in surface epithelium of normal human stomach and gastritis and gastric ulcer specimens.
aP < 0. 05 vs corresponding H. pylori negative group.
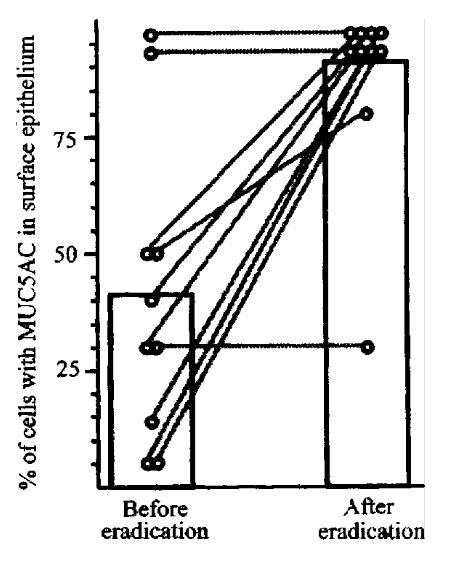
Figure 3 MUC5 expression in patients before and after eradication of H.
pylori infection. MUC5 gene expression was determined by in situ hybridization.Bars show mean percent of epithelial cells expressing MUC5. Lines show changes in MUC5AC expression in individual patients.
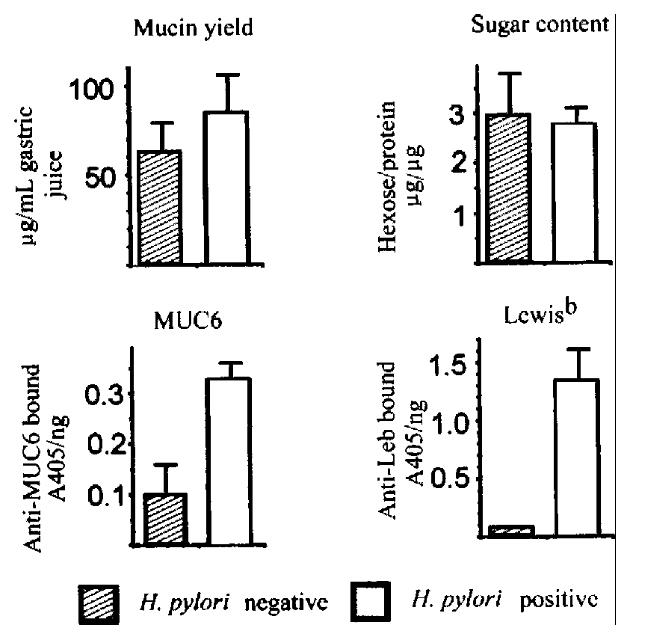
Figure 4 Purification and analysis of mucins from gastric juice.
Upper left, yield of mucins purified from gastric aspirates of 5 H. pylori -negative and 5 H.pylori -positive patients. Upper right, carbohydrate content of purifi ed mucins. Lower left, binding of antibody to MUC6 peptide in ELISA. Lower right , binding of antibody to Lewis-b antigen.
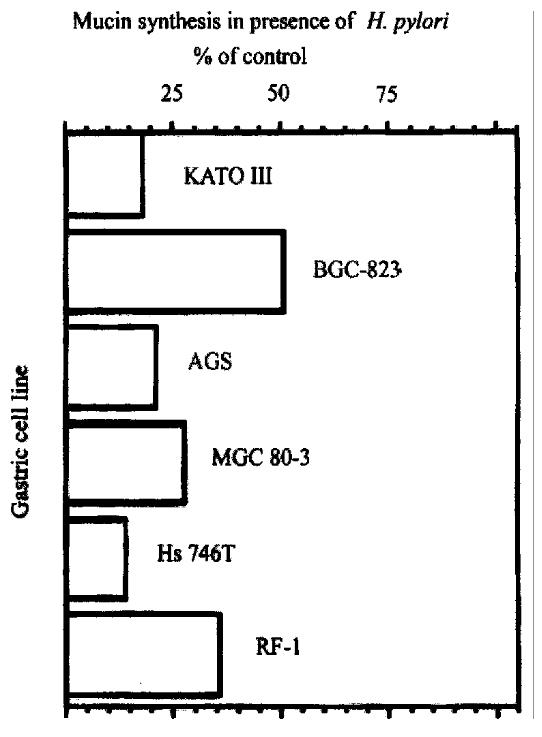
Figure 5 Effect of H.
pylori on mucin synthesis in six gastric cell lines. Cells were labeled 22 h with [3H] glucosamine in the presence or absence of 1 OD600 H.pylori, and labeled glycoproteins were analyzed by size-exclusion HPLC.
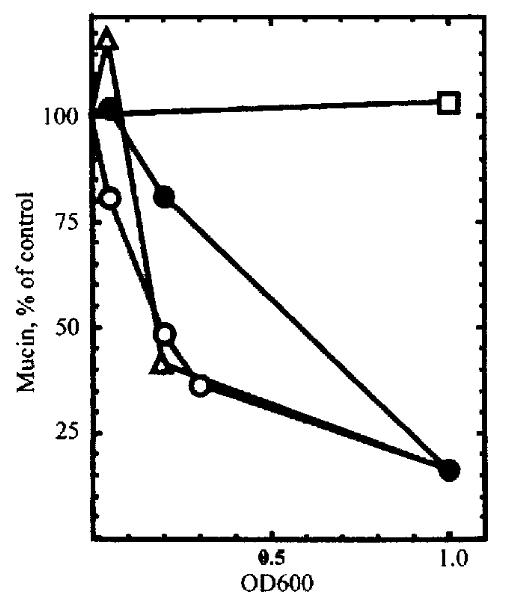
Figure 6 Inhibition of mucin synthesis by subfractions of H.
pylori. KATO I II cells were labeled with [3 H]glucosamine in the presence of different concentrations of intact H.pylori (open circles), H.pylori l ysate (filled circles), the 100000 × g pellet (open triangles), or the 100000 × g supernatant (open squares).
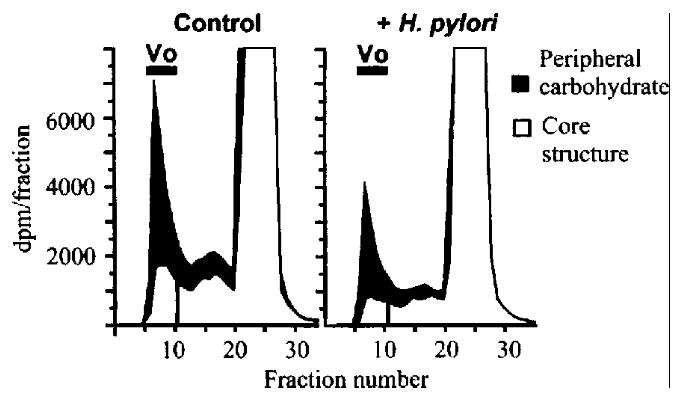
Figure 7 Effect of H.
pylori on synthesis of peipheral and core carbohydrat e structures of mucin. KATO III cells were incubated with or without 2 mmol/L b enzy l-GalNAc, and labeled for 4 h in the presence or absence of 1 OD600 H.pylori . Bars show void volume (Vo) containing labeled mucin. Solid areas show labeli ng of the peripheral carbohdyrate (inhibitable by benzyl-GalNAc). Open areas sh ow residual labeling of core structures in the presence of benzyl-GalNAc.
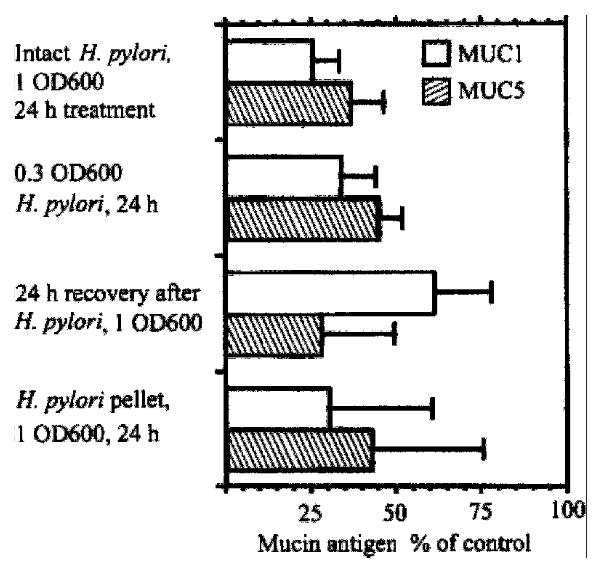
Figure 8 Effect of H.
pylori on expression of MUC1 and MUC5AC in KATO III gastric epithelial cells in vitro. KATO III cells were incubated with or with out H.pylori, and cell lysates were subjected to Western analysis. Content of MUC1 antigen, detected with monoclonal antibody HMFG2, and of MUC5AC antigen, detected with monoclonal antibody CLH2, is expressed as percentage of untreated cells.
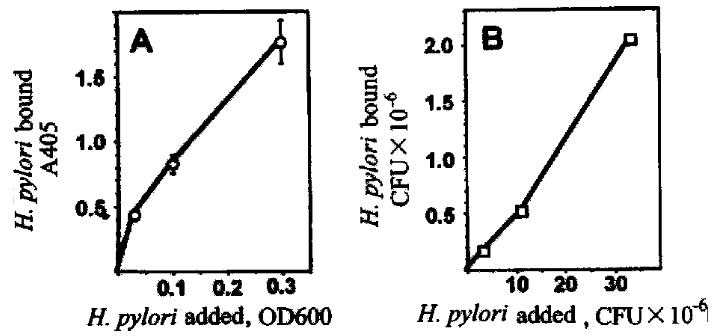
Figure 9 Assay of adhesion of H.
pylori to gastric epithelial cells. Biotin -labeled H.pylori were incubated with BGC-823 cells for 30 min at 37 °C, and attached bacteria were quantitated using the avidin-biotin-complex assay (A, left panel) or by colony counts (B, right panel).
Figure 10 Effect of inhibitors of mucin synthesis on H.
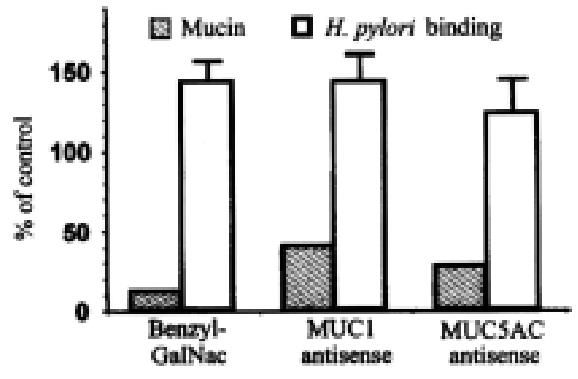
pylori adhesion. BG C-823 cells were treated with 2 mmol/L benzyl-GalNAc, with 5 μmol/L MUC1 antisense (5’-GGG-CTG-GGG-GGG-CGG-TGG-3’), or with 5 μmol/L MUC5AC antisense (5’-AGA-GGT-TGT-GCT-GGT-TGT-3’). Solid bars show, as percent of control, amo unts of total mucin (left), MUC1 mucin (middle), and MUC5AC mucin (right). Open bars show binding of biotinylated H.pylori, expressed as percent of control .
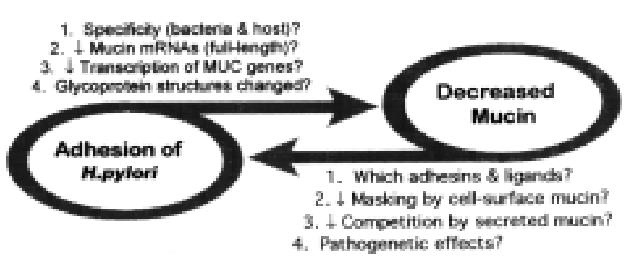
Figure 11 Working hypothesis: interaction of H.
pylori and gastric mucins.
- Citation: Byrd JC, Bresalier RS. Alterations in gastric mucin synthesis by Helicobacter pylori. World J Gastroenterol 2000; 6(4): 475-482
- URL: https://www.wjgnet.com/1007-9327/full/v6/i4/475.htm
- DOI: https://dx.doi.org/10.3748/wjg.v6.i4.475


