Copyright
©The Author(s) 1999.
World J Gastroenterol. Oct 15, 1999; 5(5): 440-442
Published online Oct 15, 1999. doi: 10.3748/wjg.v5.i5.440
Published online Oct 15, 1999. doi: 10.3748/wjg.v5.i5.440
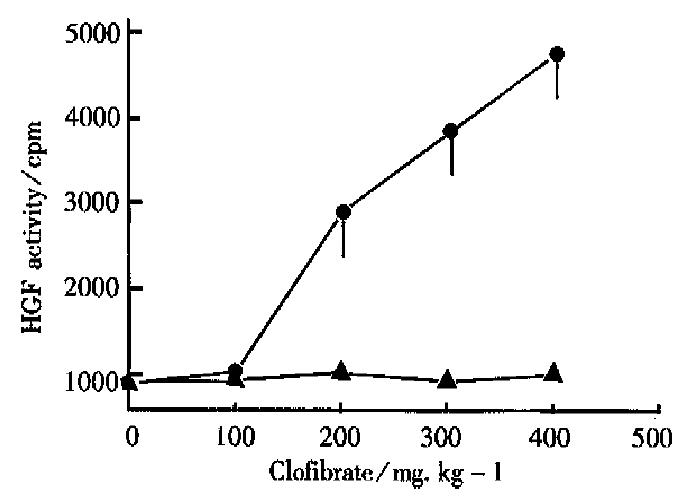
Figure 1 Dose-effect curve of the effect of clofibrate on the HGF level in rat serum 4 d after clofibrate administration.
▲-▲: Normal control group. ●-●: Clofibrate administration group.
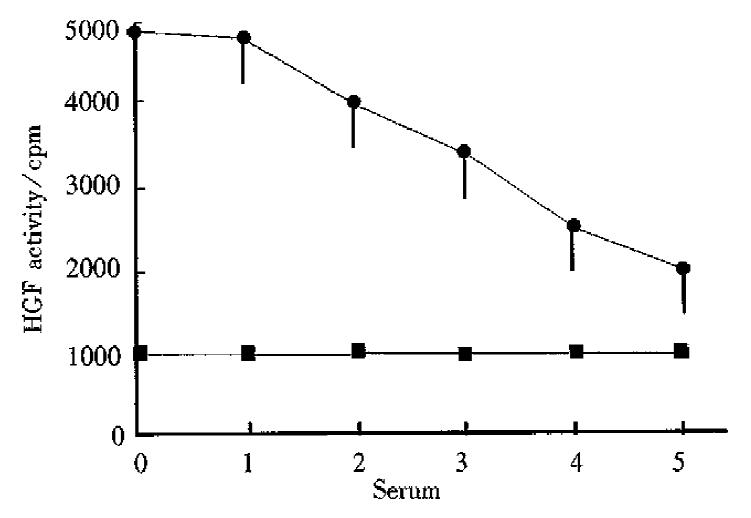
Figure 2 Variation of HGF level in rat serum 4 d after clofibrate administration.
■-■: Normal control group, ●-●: Clofibrate administration group.
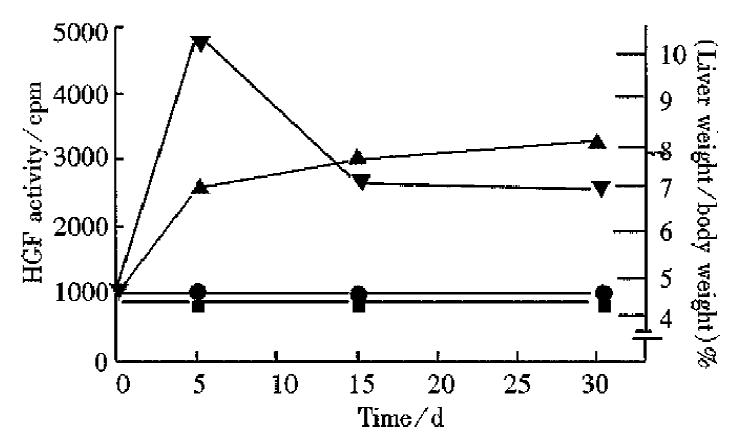
Figure 3 Variation of liver weight and serum HGF level in rats after clofibrate administration.
■-■: HGF level in normal control group, ▼-▼: HGF level in clofibrate administration group, ●-●: Liver weight of normal control group, ▲-▲: Liver weight of clofibrate administration group.
- Citation: Xu W, Wu SG. The possible relationship between hepatomegaly and release of HGF into plasma induced by clofibrate in rats. World J Gastroenterol 1999; 5(5): 440-442
- URL: https://www.wjgnet.com/1007-9327/full/v5/i5/440.htm
- DOI: https://dx.doi.org/10.3748/wjg.v5.i5.440


