Copyright
©The Author(s) 1999.
World J Gastroenterol. Aug 15, 1999; 5(4): 305-307
Published online Aug 15, 1999. doi: 10.3748/wjg.v5.i4.305
Published online Aug 15, 1999. doi: 10.3748/wjg.v5.i4.305
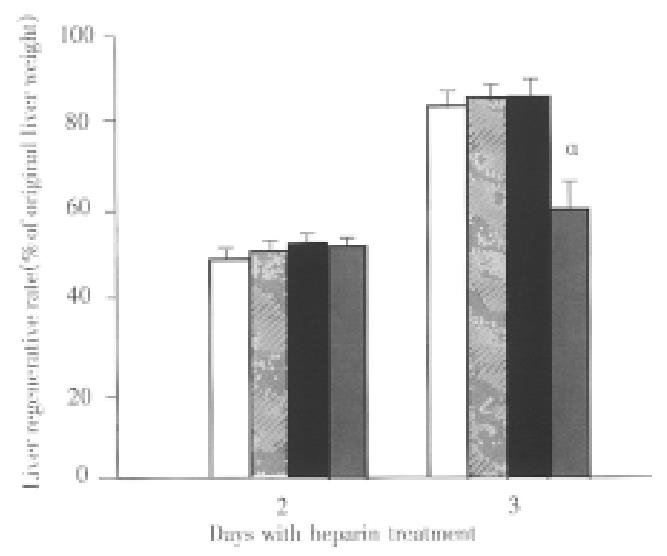
Figure 1 Effect of different doses of heparin treated for 2 or 3 d on liver regeneration in partially hepatectomized rats.
Open columns represent groups with normal saline treatment. Hatched, solid, or cross-hatched columns stand for groups treated with heparin at doses of 100, 500, or 1000 U/kg, respectively. Each column represents the mean ± S.E.M. of 5 animals. aP < 0.05 vs corresponding group with normal saline treatment.
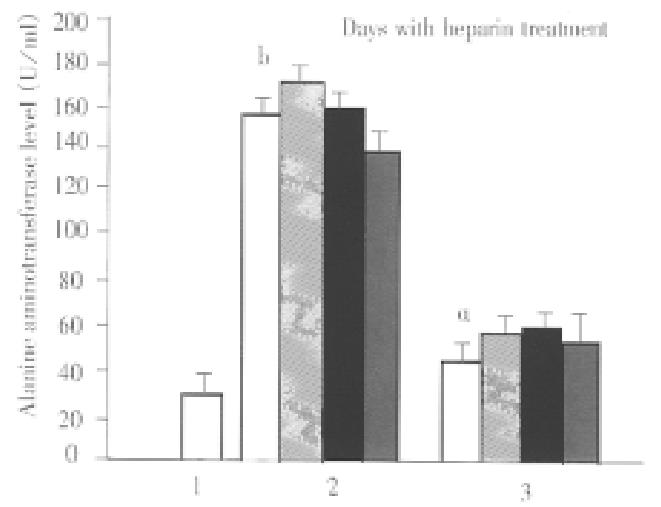
Figure 2 Effect of different doses of heparin treated for 2 or 3 d on serum alanine aminotransferase level in partially hepatectomized rats.
Open columns represent groups with normal saline treatment. Hatched, solid, or cross-hatched columns stand for groups treated with hepari n at doses of 100, 500, or 1000 U/kg, respectively. Each column represent s the mean ± S.E.M. of 5 animals. aP < 0.05, bP < 0.001 vs 0 day with normal saline treatment.
- Citation: Y L, HY W, Cho CH. Effects of heparin on hepatic regeneration and function after partial hepatectomy in rats. World J Gastroenterol 1999; 5(4): 305-307
- URL: https://www.wjgnet.com/1007-9327/full/v5/i4/305.htm
- DOI: https://dx.doi.org/10.3748/wjg.v5.i4.305


