
















Copyright: ©Author(s) 2027.
World J Gastroenterol. Jan 7, 2027; 33(1): 122855
Published online Jan 7, 2027. doi: 10.3748/wjg.122855
Published online Jan 7, 2027. doi: 10.3748/wjg.122855
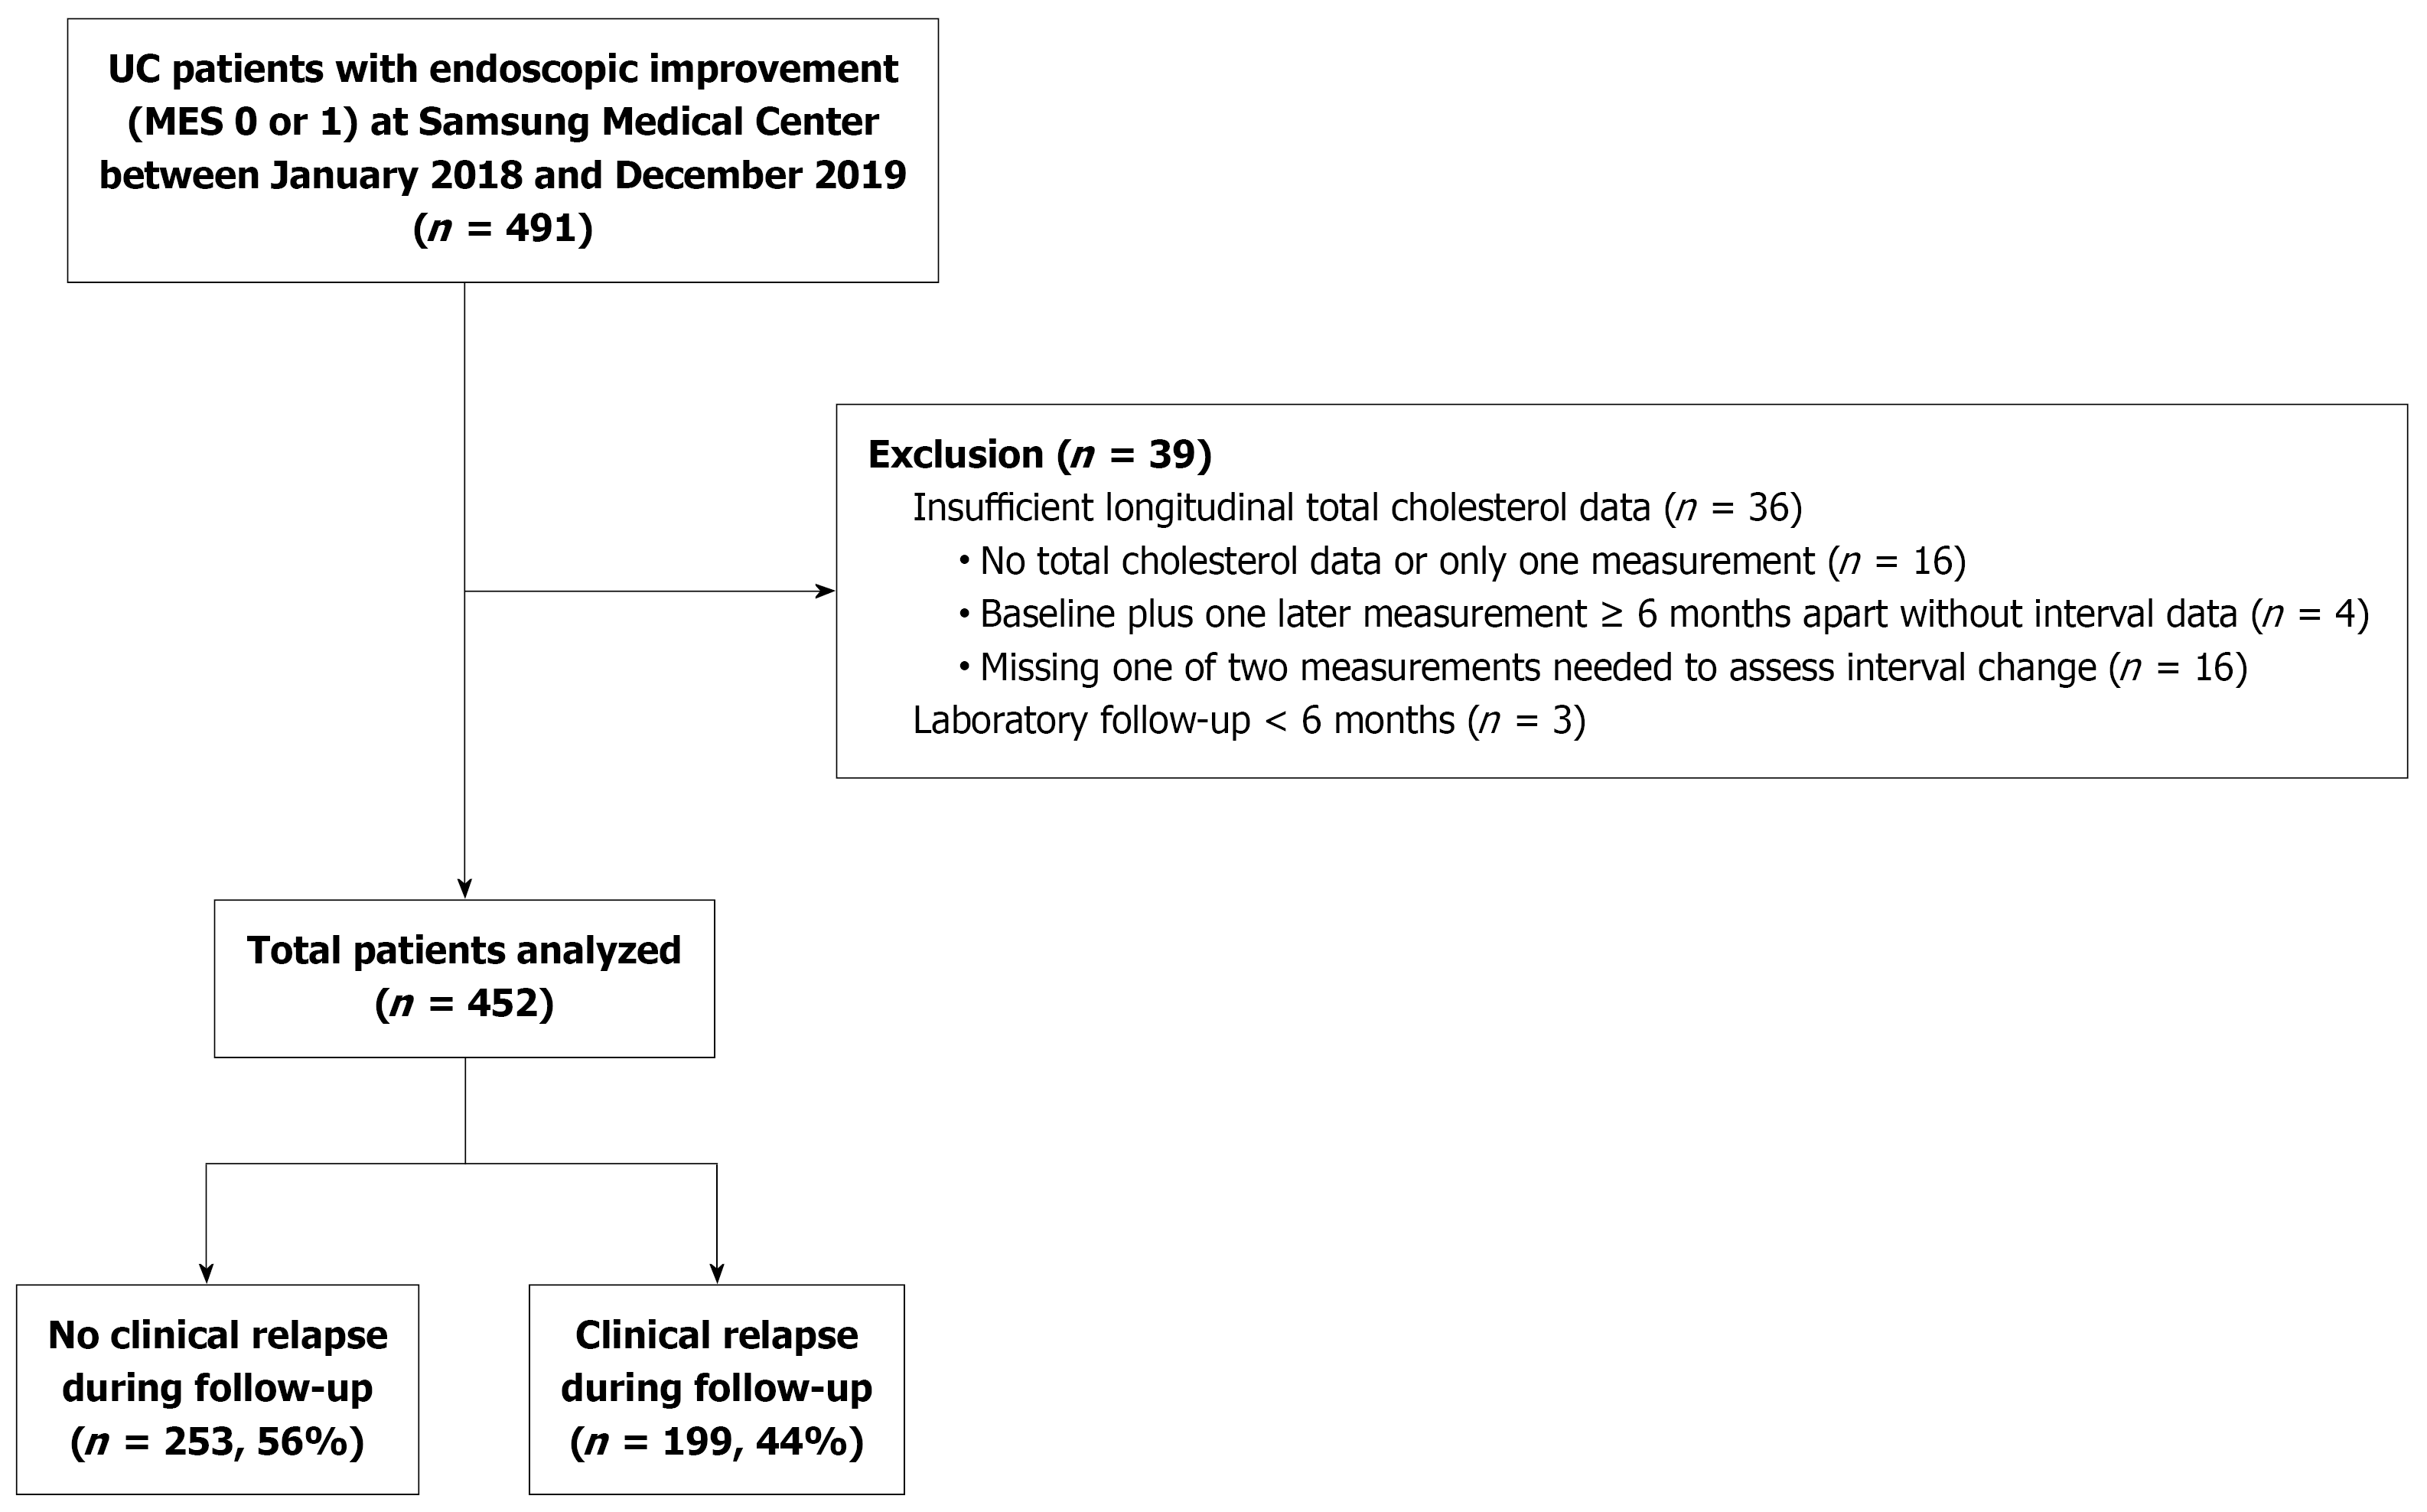
Figure 1 Patients flowchart.
UC: Ulcerative colitis; MES: Mayo endoscopic subscore.
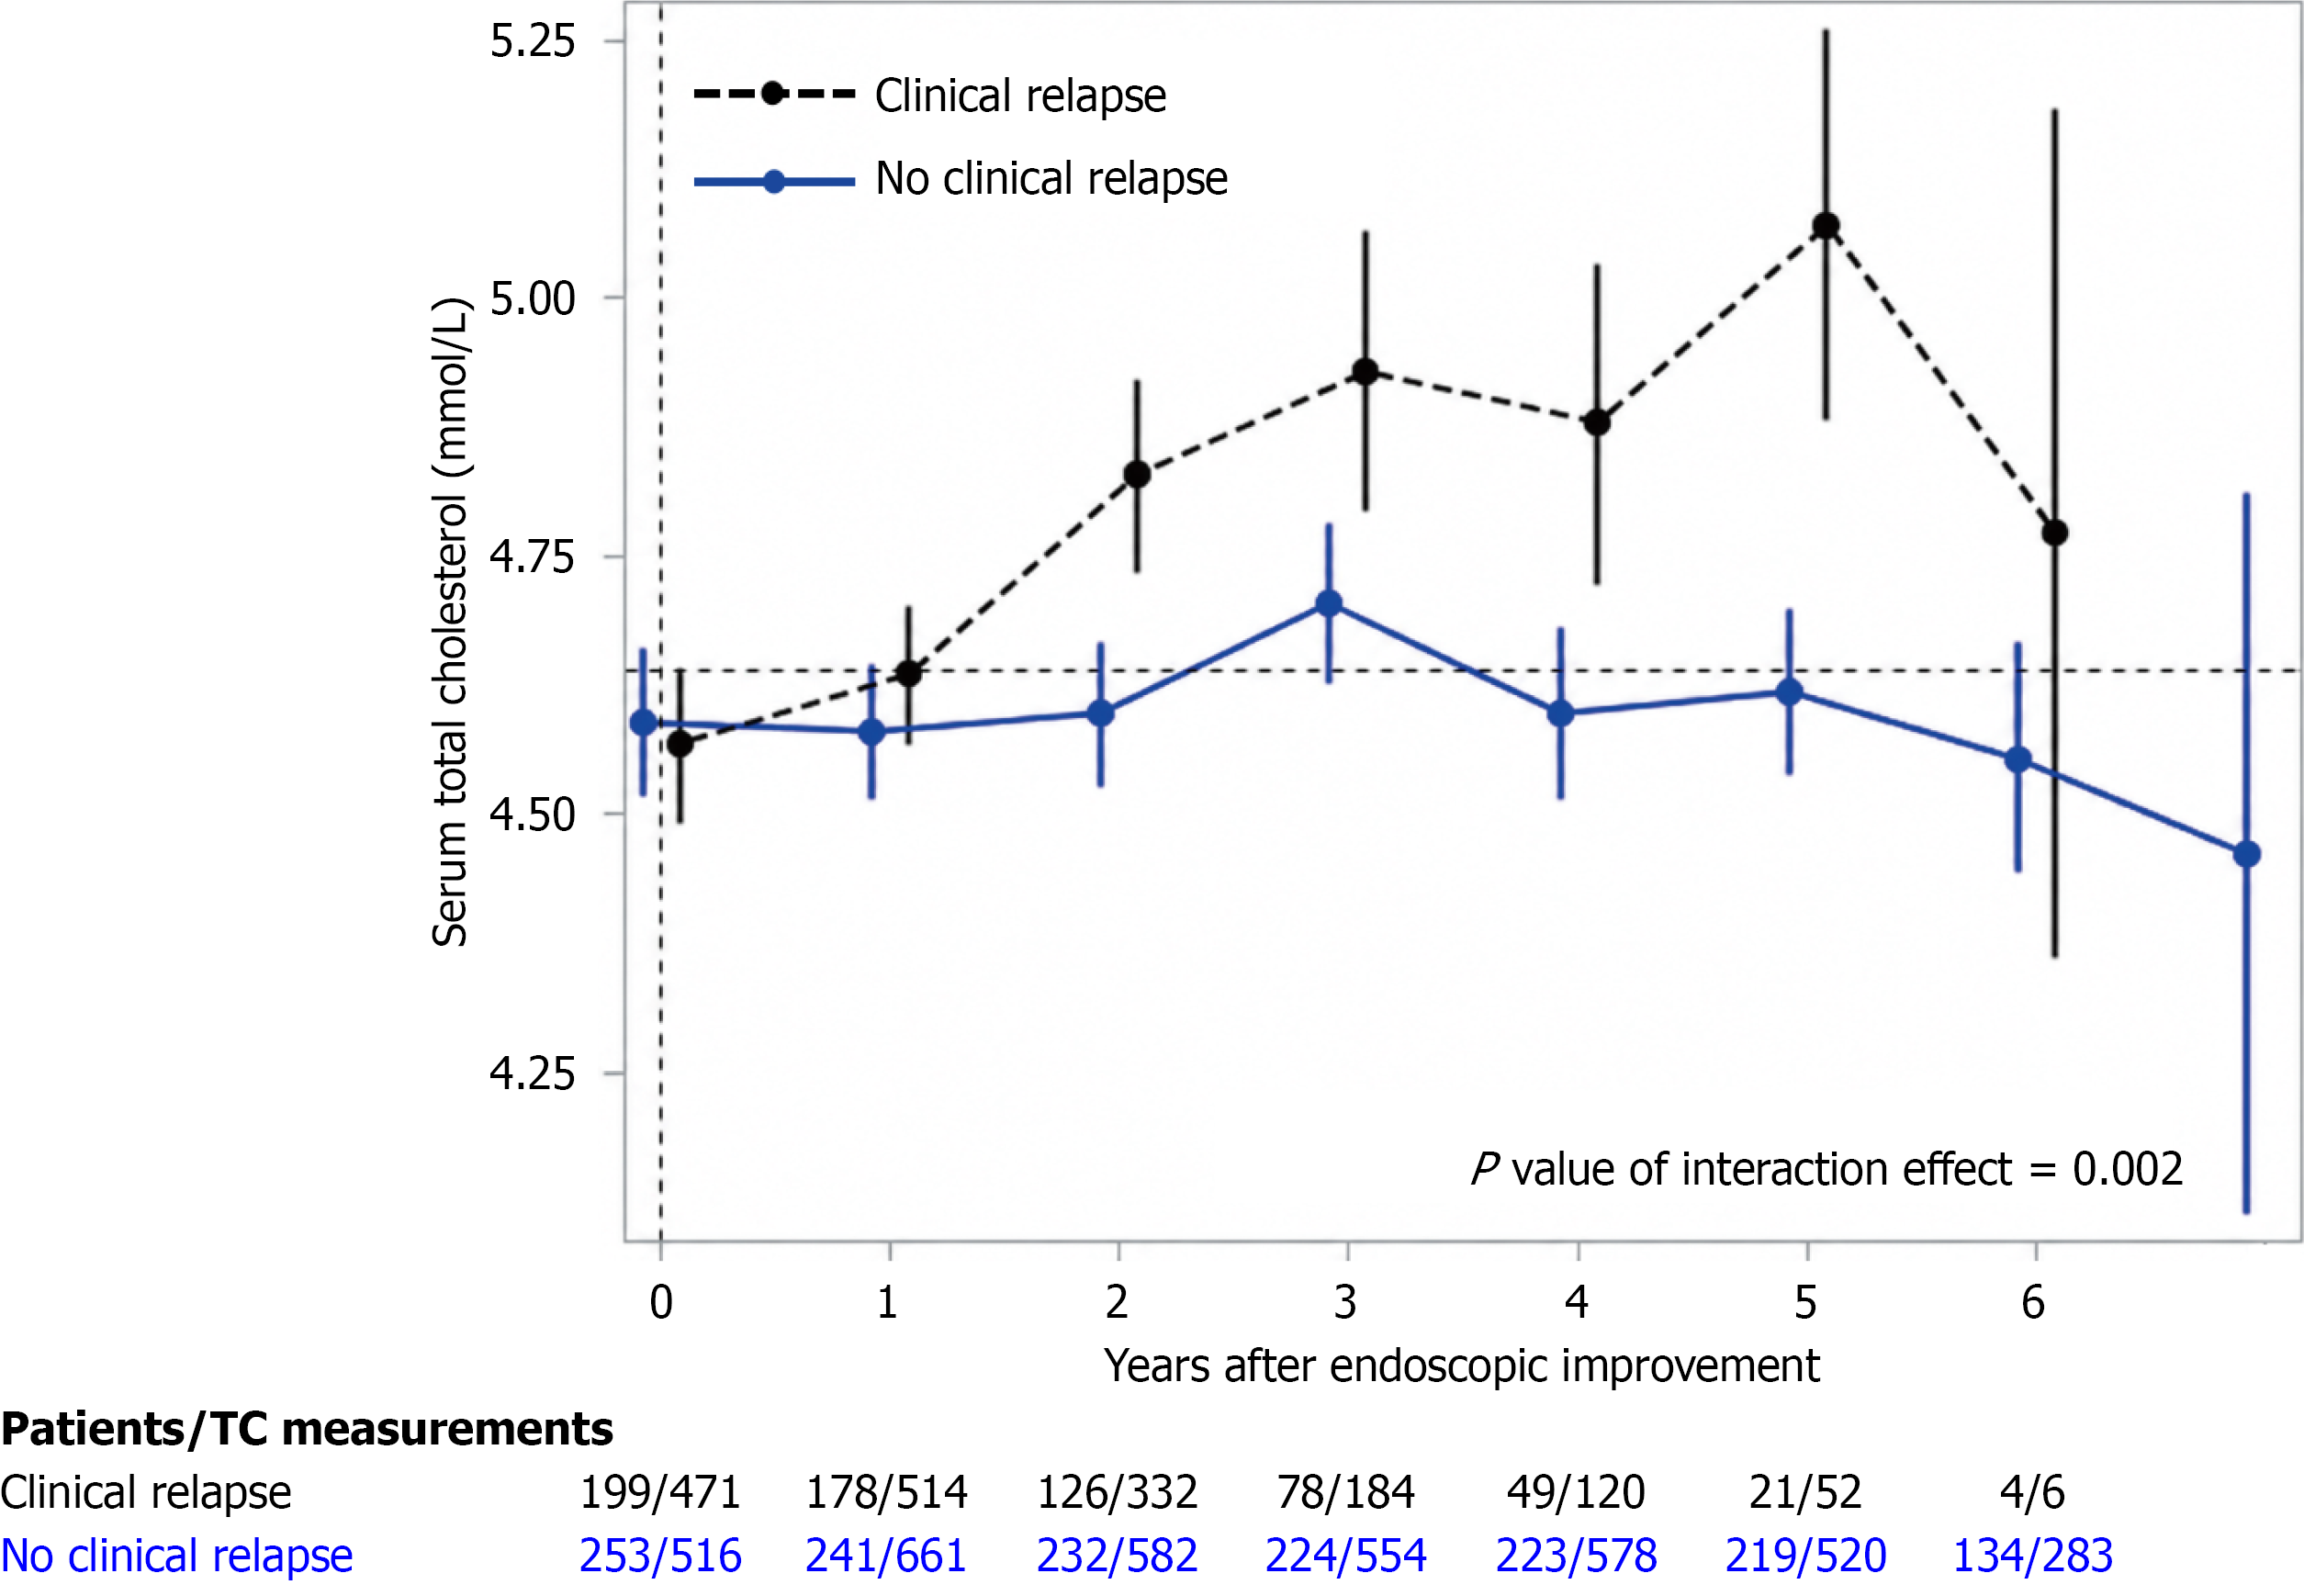
Figure 2 Mean serum total cholesterol trajectories according to subsequent clinical relapse status.
A mean-profile plot of serum total cholesterol trajectories is shown for patients with subsequent clinical relapse and those without clinical relapse during follow-up. Error bars indicate 95%CIs. Values below the plot are presented as the number of patients/number of total cholesterol measurements contributing to each follow-up year. The time-by-group interaction was assessed using a generalized estimating equation model. TC: Total cholesterol.
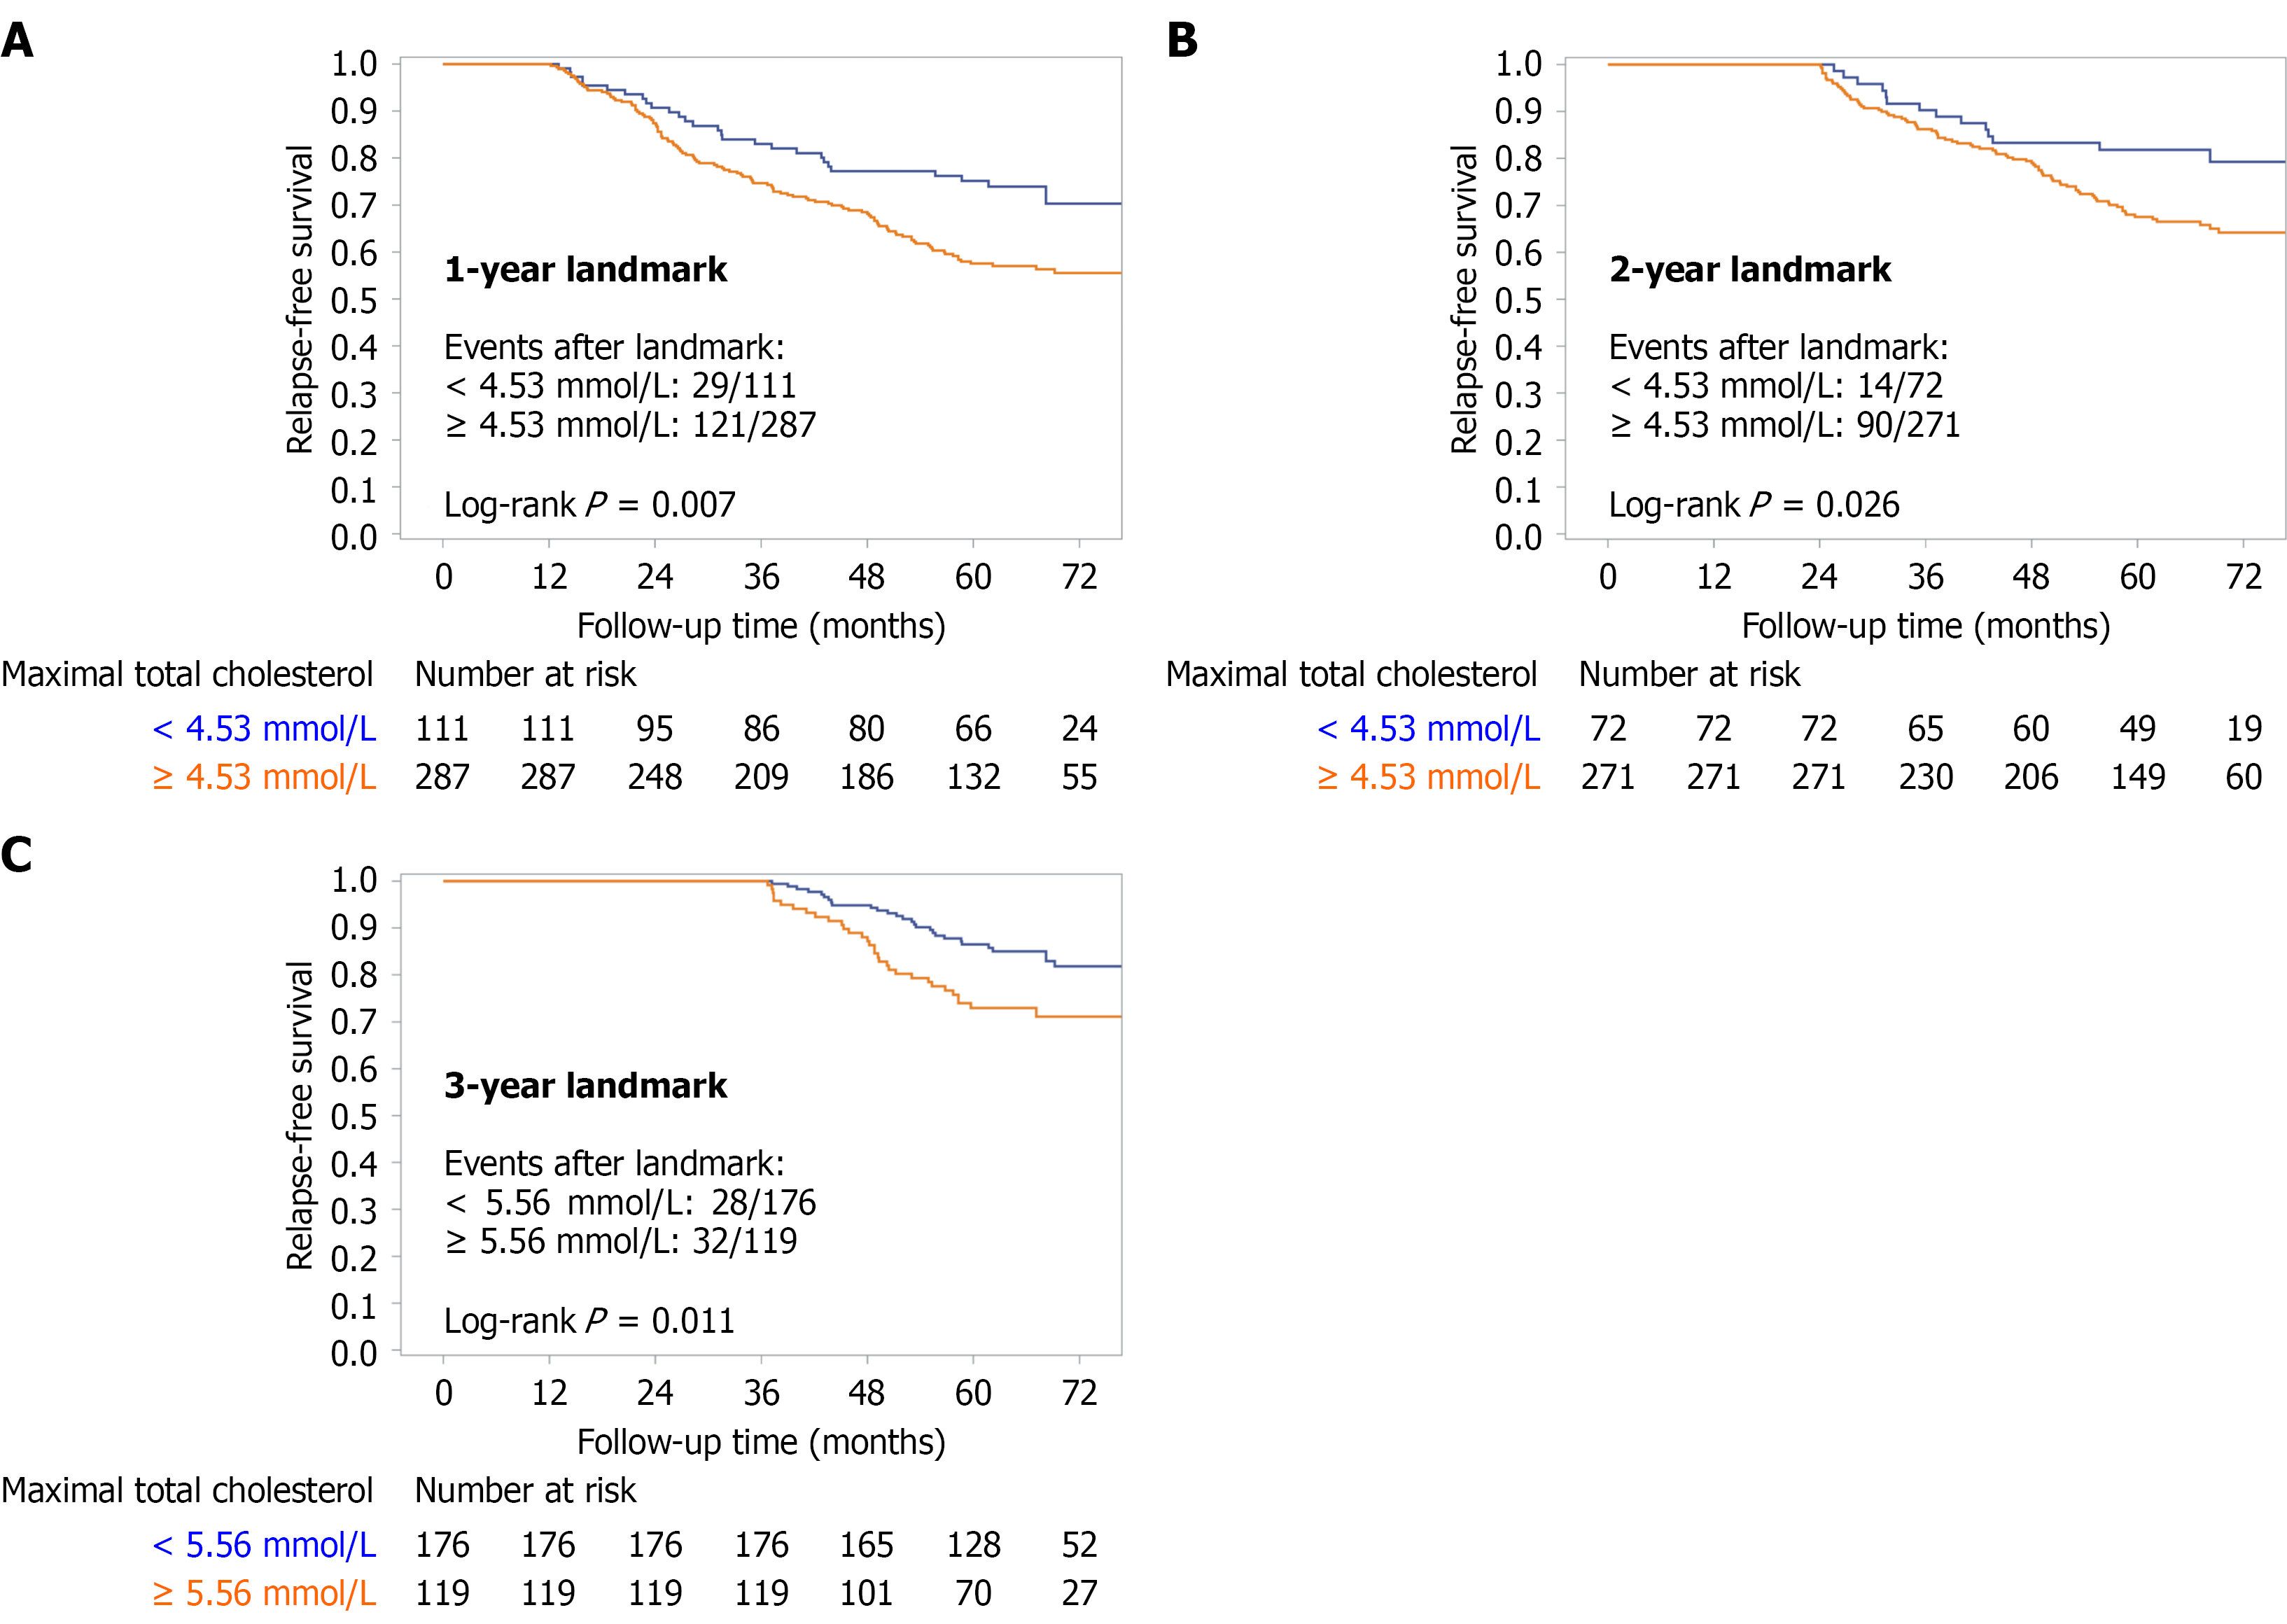
Figure 3 Landmark Kaplan–Meier curves of relapse-free survival according to maximal serum total cholesterol levels.
A: 1-year landmark; B: 2-year landmark; C: 3-year landmark. They show analyses at the 1-year, 2-year, and 3-year landmarks after endoscopic improvement, restricted to patients who remained relapse-free up to each landmark time point. Patients were stratified according to maximal serum total cholesterol measured before each landmark. Cutoffs are shown in each panel: (1) 4.53 mmol/L for the 1-year and 2-year landmarks; and (2) 5.56 mmol/L for the 3-year landmark. Numbers at risk are shown below each panel. Event counts after each landmark are shown below the panel titles and indicate the number of clinical relapses observed after each landmark divided by the number of patients included in the corresponding group. Log-rank P values are shown in each panel.
- Citation: Kim JY, Kim MJ, Kim M, Hong SN, Chang DK, Kim YH, Kim ER, Kim JE. Longitudinal serum total cholesterol patterns and subsequent clinical relapse in ulcerative colitis. World J Gastroenterol 2027; 33(1): 122855
- URL: https://www.wjgnet.com/1007-9327/full/v33/i1/122855.htm
- DOI: https://dx.doi.org/10.3748/wjg.122855