
















Copyright: ©Author(s) 2027.
World J Gastroenterol. Jan 7, 2027; 33(1): 122855
Published online Jan 7, 2027. doi: 10.3748/wjg.122855
Published online Jan 7, 2027. doi: 10.3748/wjg.122855
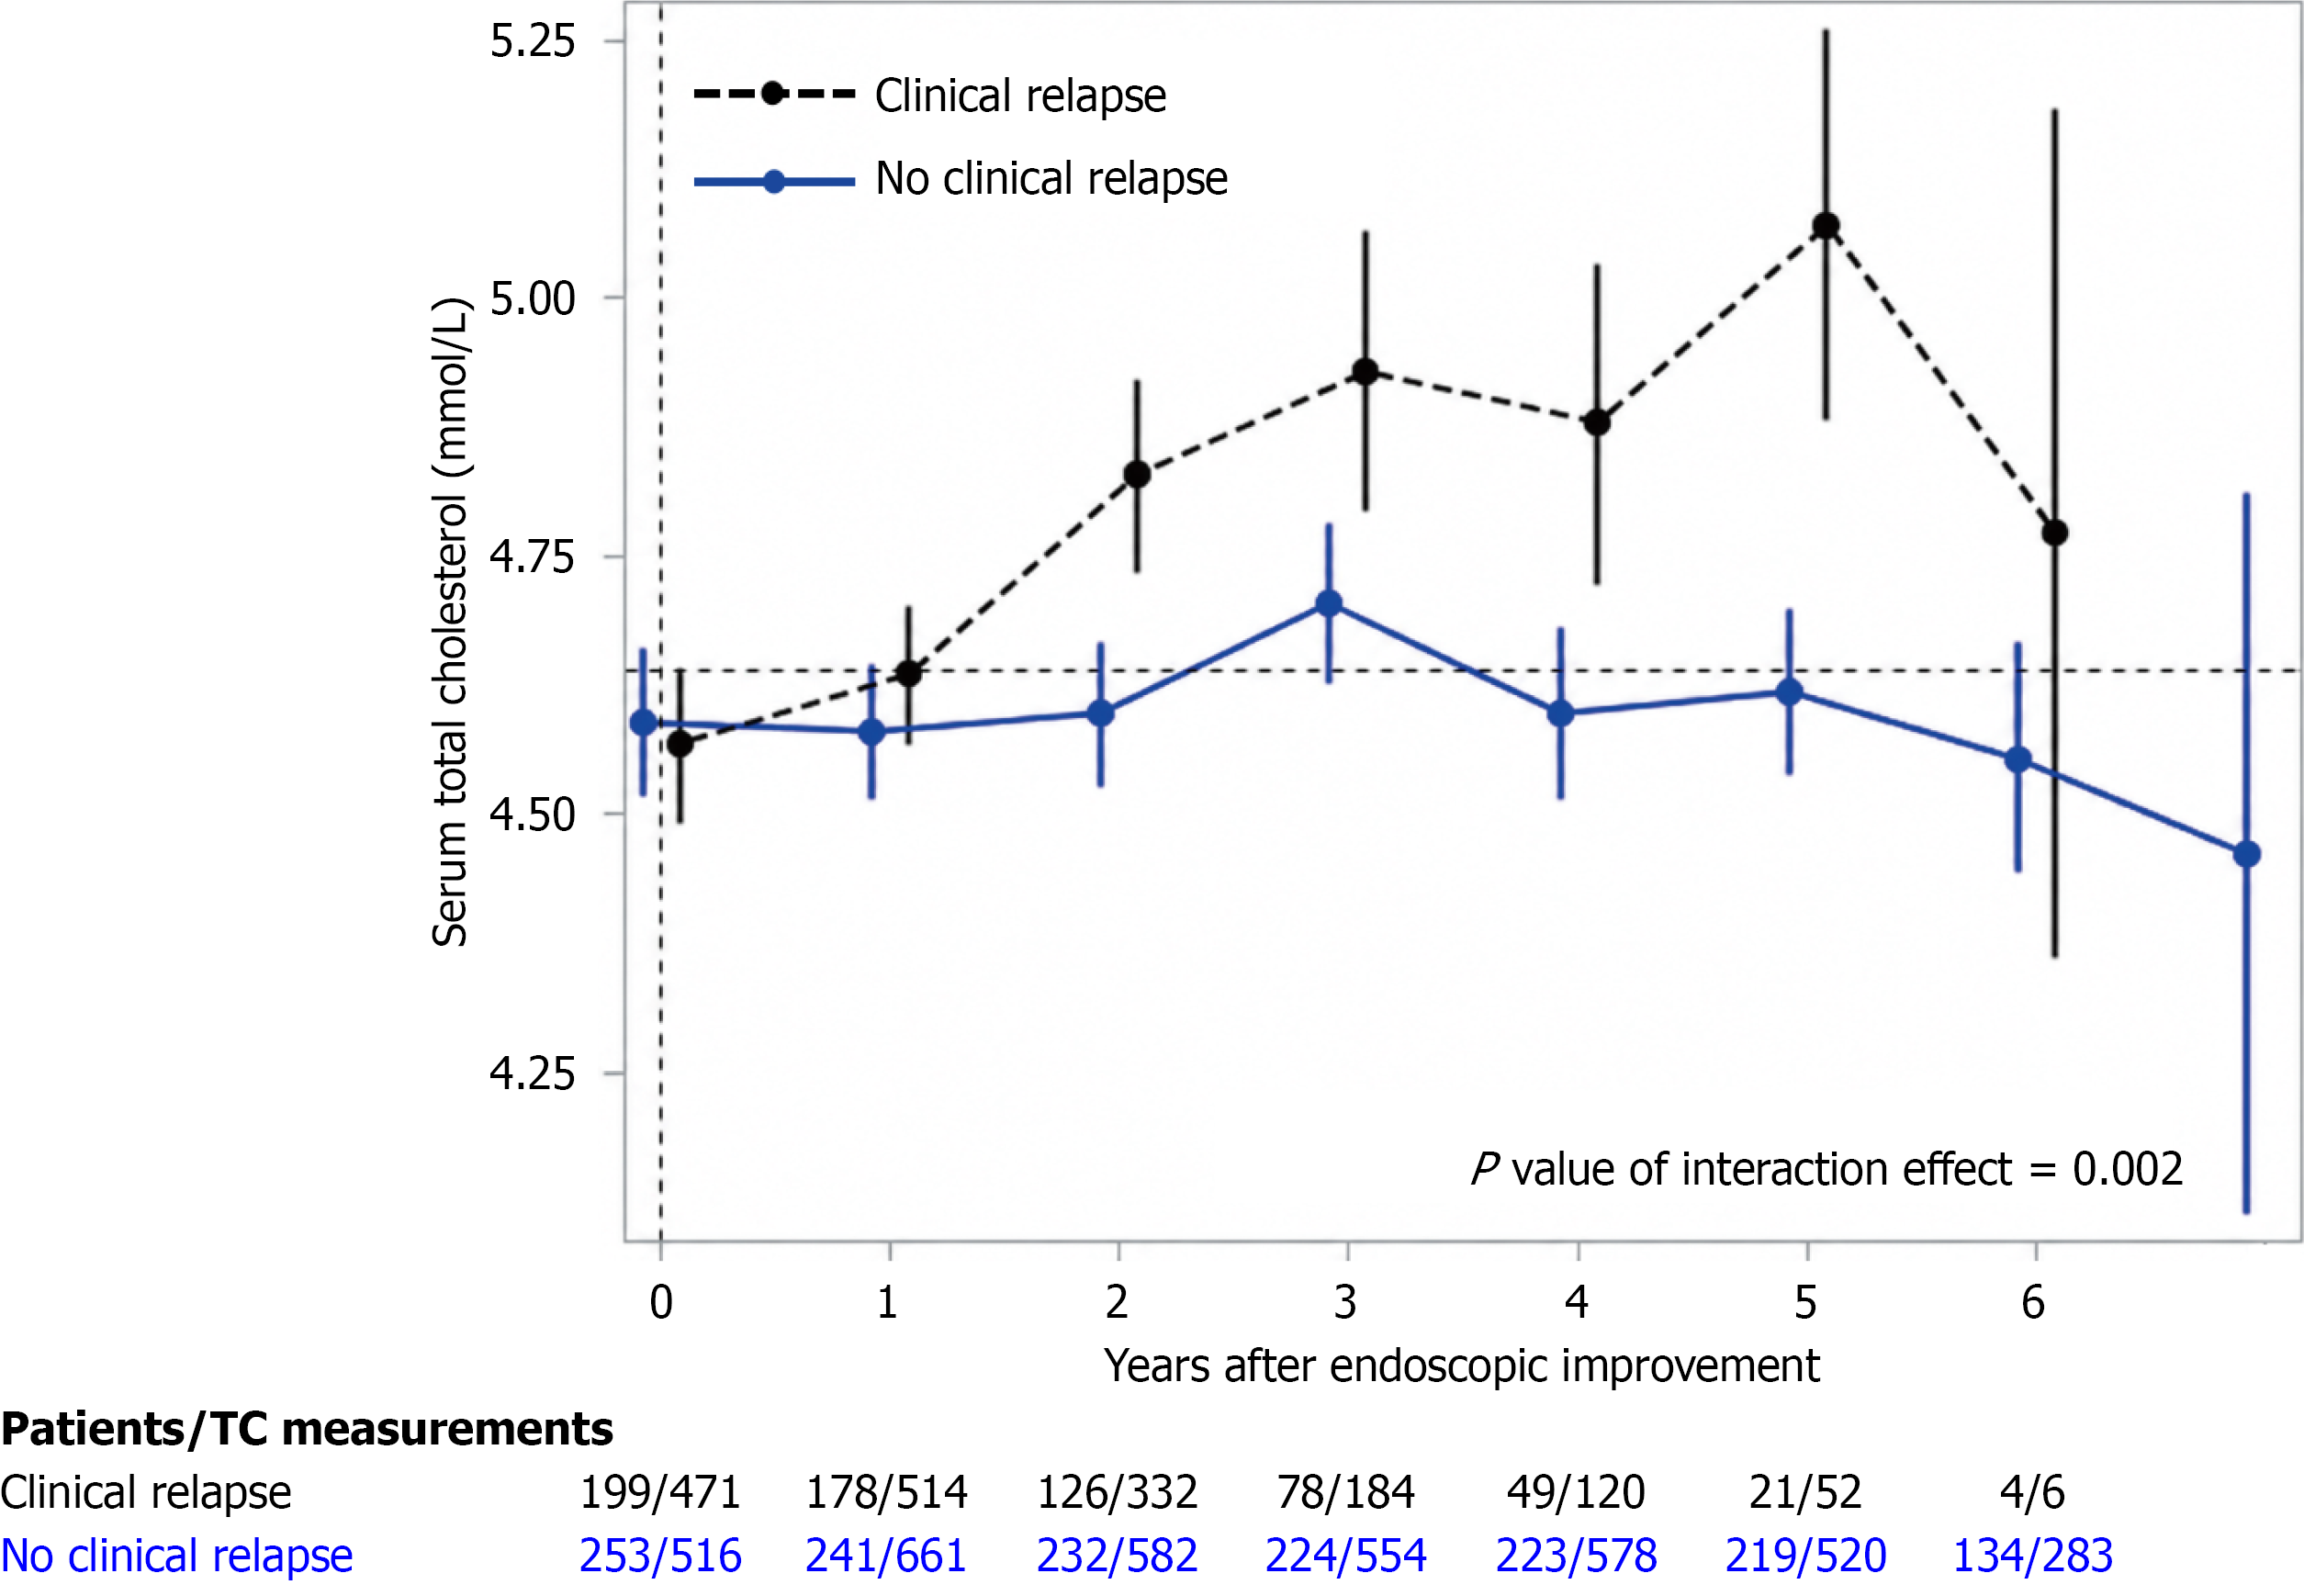
Figure 2 Mean serum total cholesterol trajectories according to subsequent clinical relapse status.
A mean-profile plot of serum total cholesterol trajectories is shown for patients with subsequent clinical relapse and those without clinical relapse during follow-up. Error bars indicate 95%CIs. Values below the plot are presented as the number of patients/number of total cholesterol measurements contributing to each follow-up year. The time-by-group interaction was assessed using a generalized estimating equation model. TC: Total cholesterol.
- Citation: Kim JY, Kim MJ, Kim M, Hong SN, Chang DK, Kim YH, Kim ER, Kim JE. Longitudinal serum total cholesterol patterns and subsequent clinical relapse in ulcerative colitis. World J Gastroenterol 2027; 33(1): 122855
- URL: https://www.wjgnet.com/1007-9327/full/v33/i1/122855.htm
- DOI: https://dx.doi.org/10.3748/wjg.122855