
















Copyright: ©Author(s) 2026.
World J Gastroenterol. Dec 7, 2026; 32(45): 121243
Published online Dec 7, 2026. doi: 10.3748/wjg.121243
Published online Dec 7, 2026. doi: 10.3748/wjg.121243
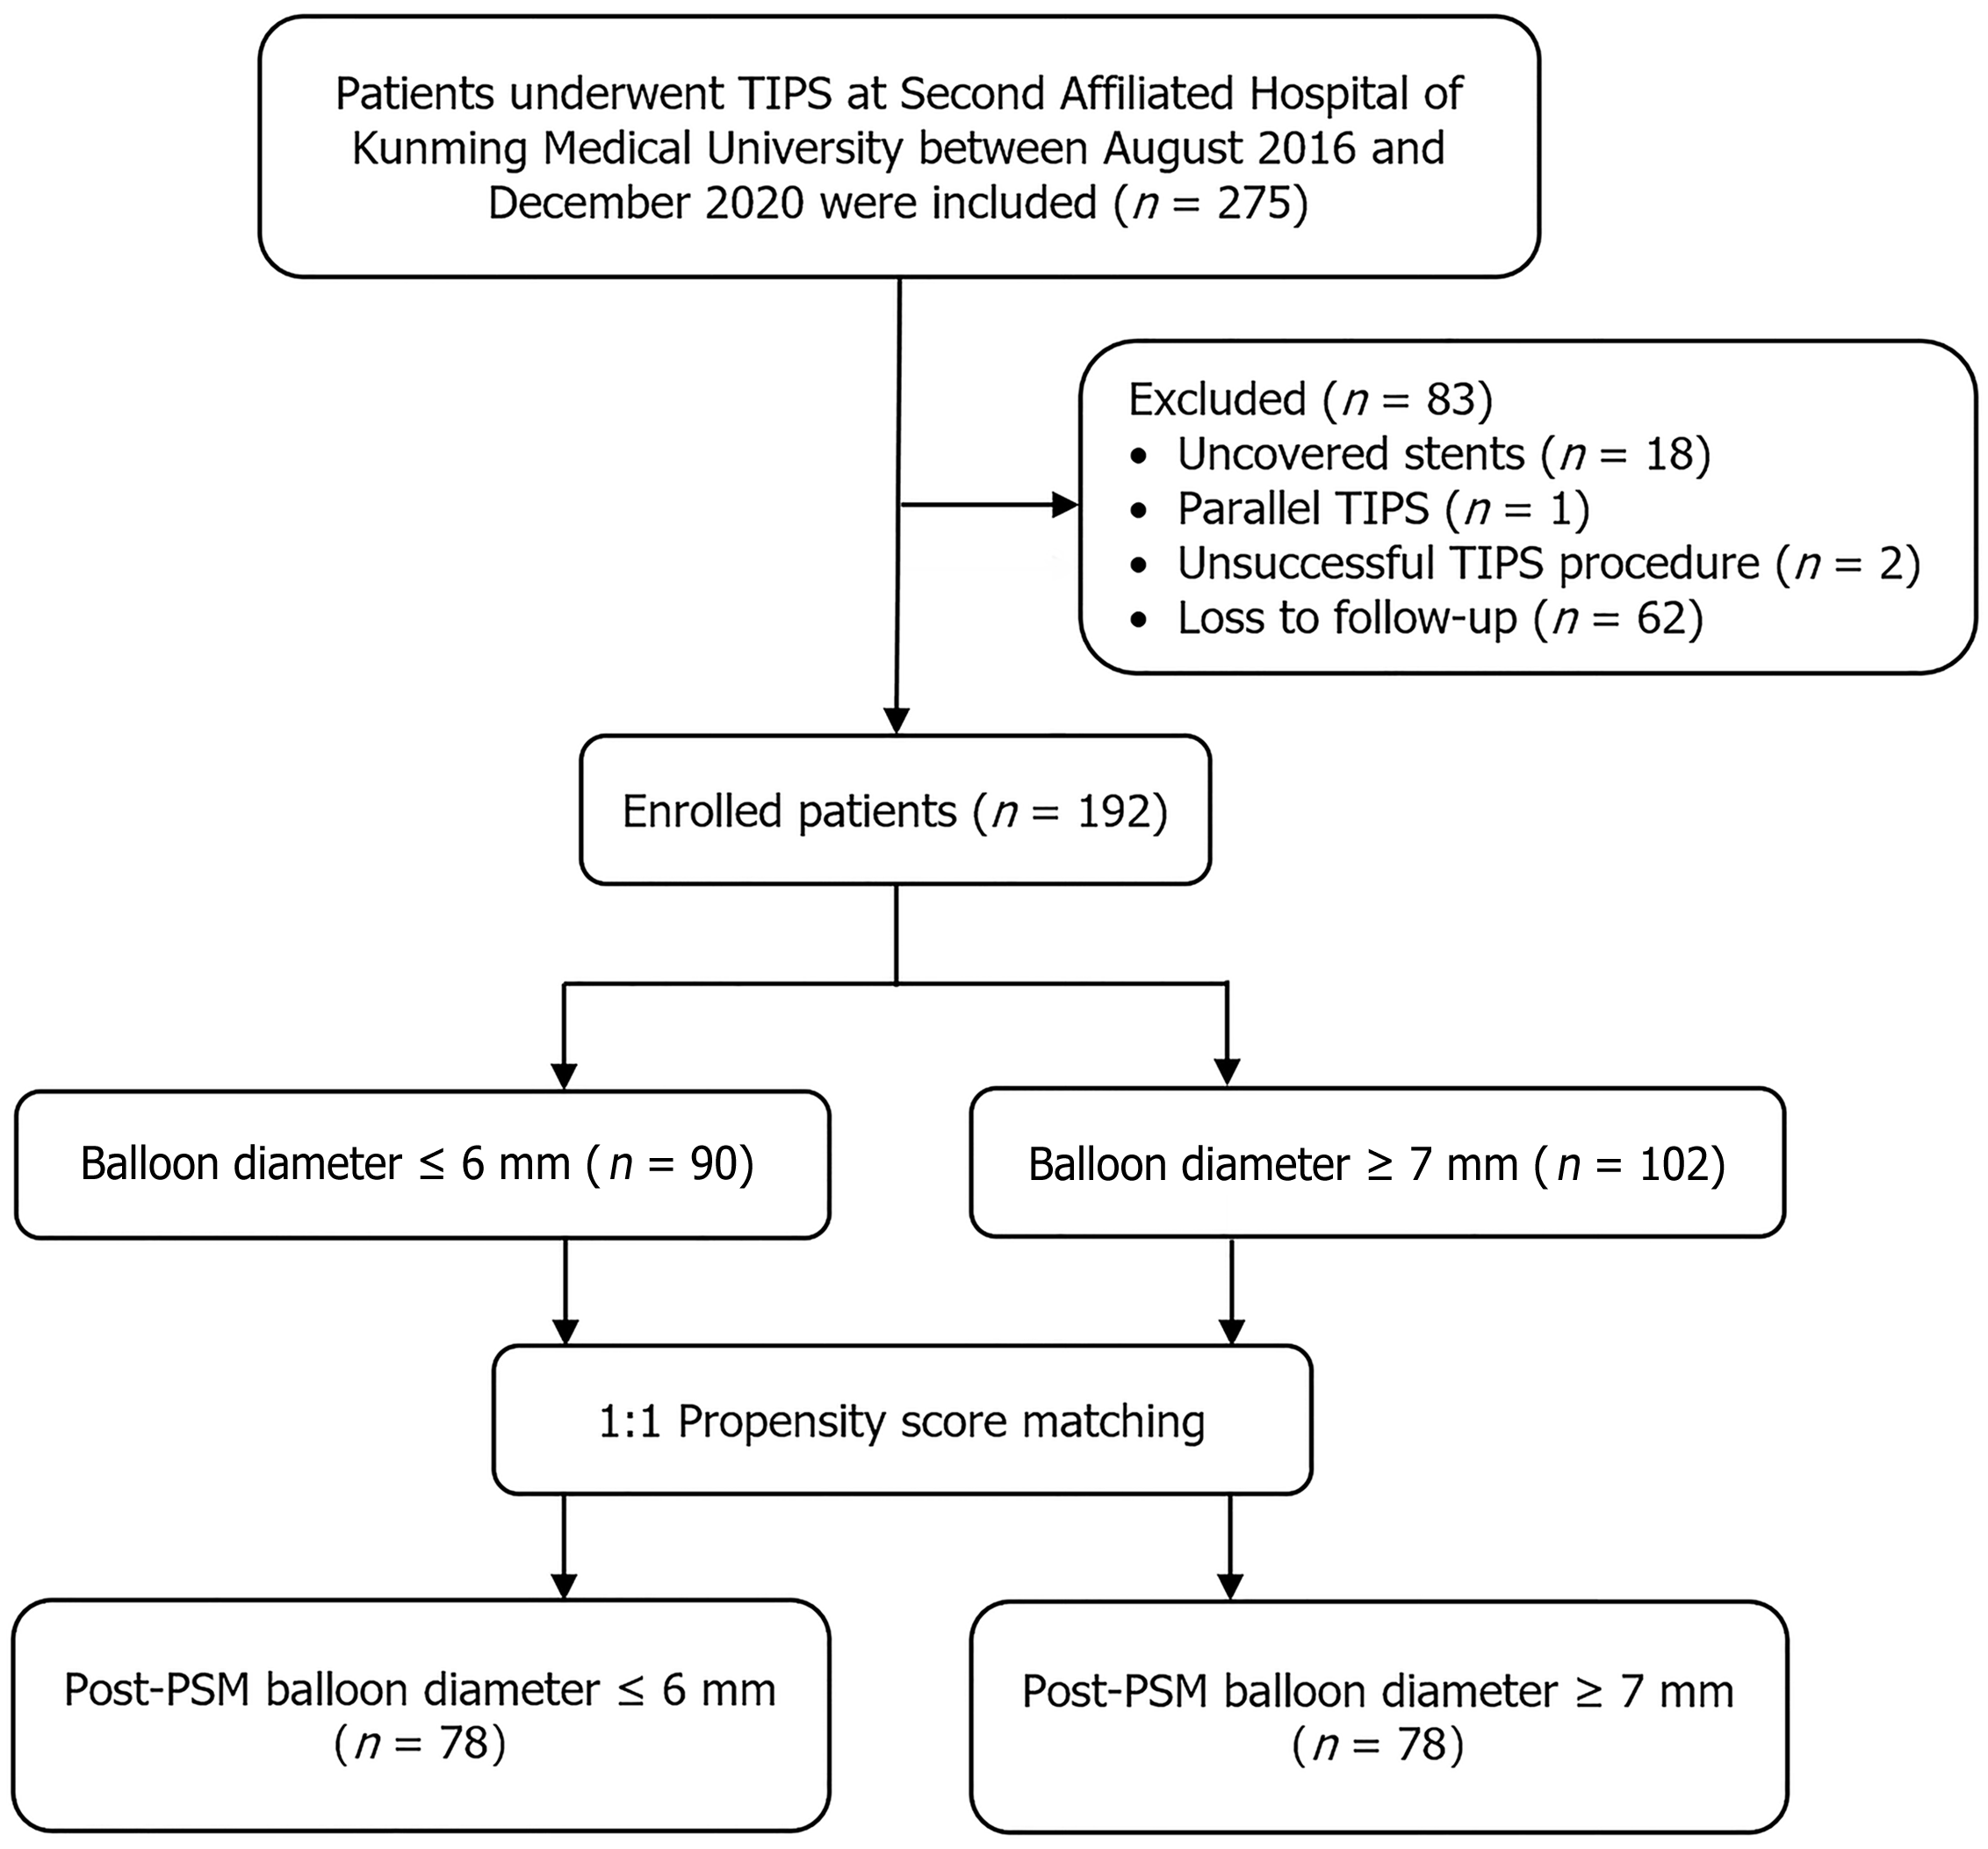
Figure 1 Flow chart of patient selection.
A total of 275 patients with liver cirrhosis and portal hypertension underwent transjugular intrahepatic portosystemic shunt procedures. After excluding patients who received non-Viatorr covered stents (n = 18), underwent parallel transjugular intrahepatic portosystemic shunt procedures (n = 1), had unsuccessful surgeries (n = 2), or had incomplete or missing follow-up data (n = 62), 192 patients were ultimately included in the study. TIPS: Transjugular intrahepatic portosystemic shunt; PSM: Propensity score matching.
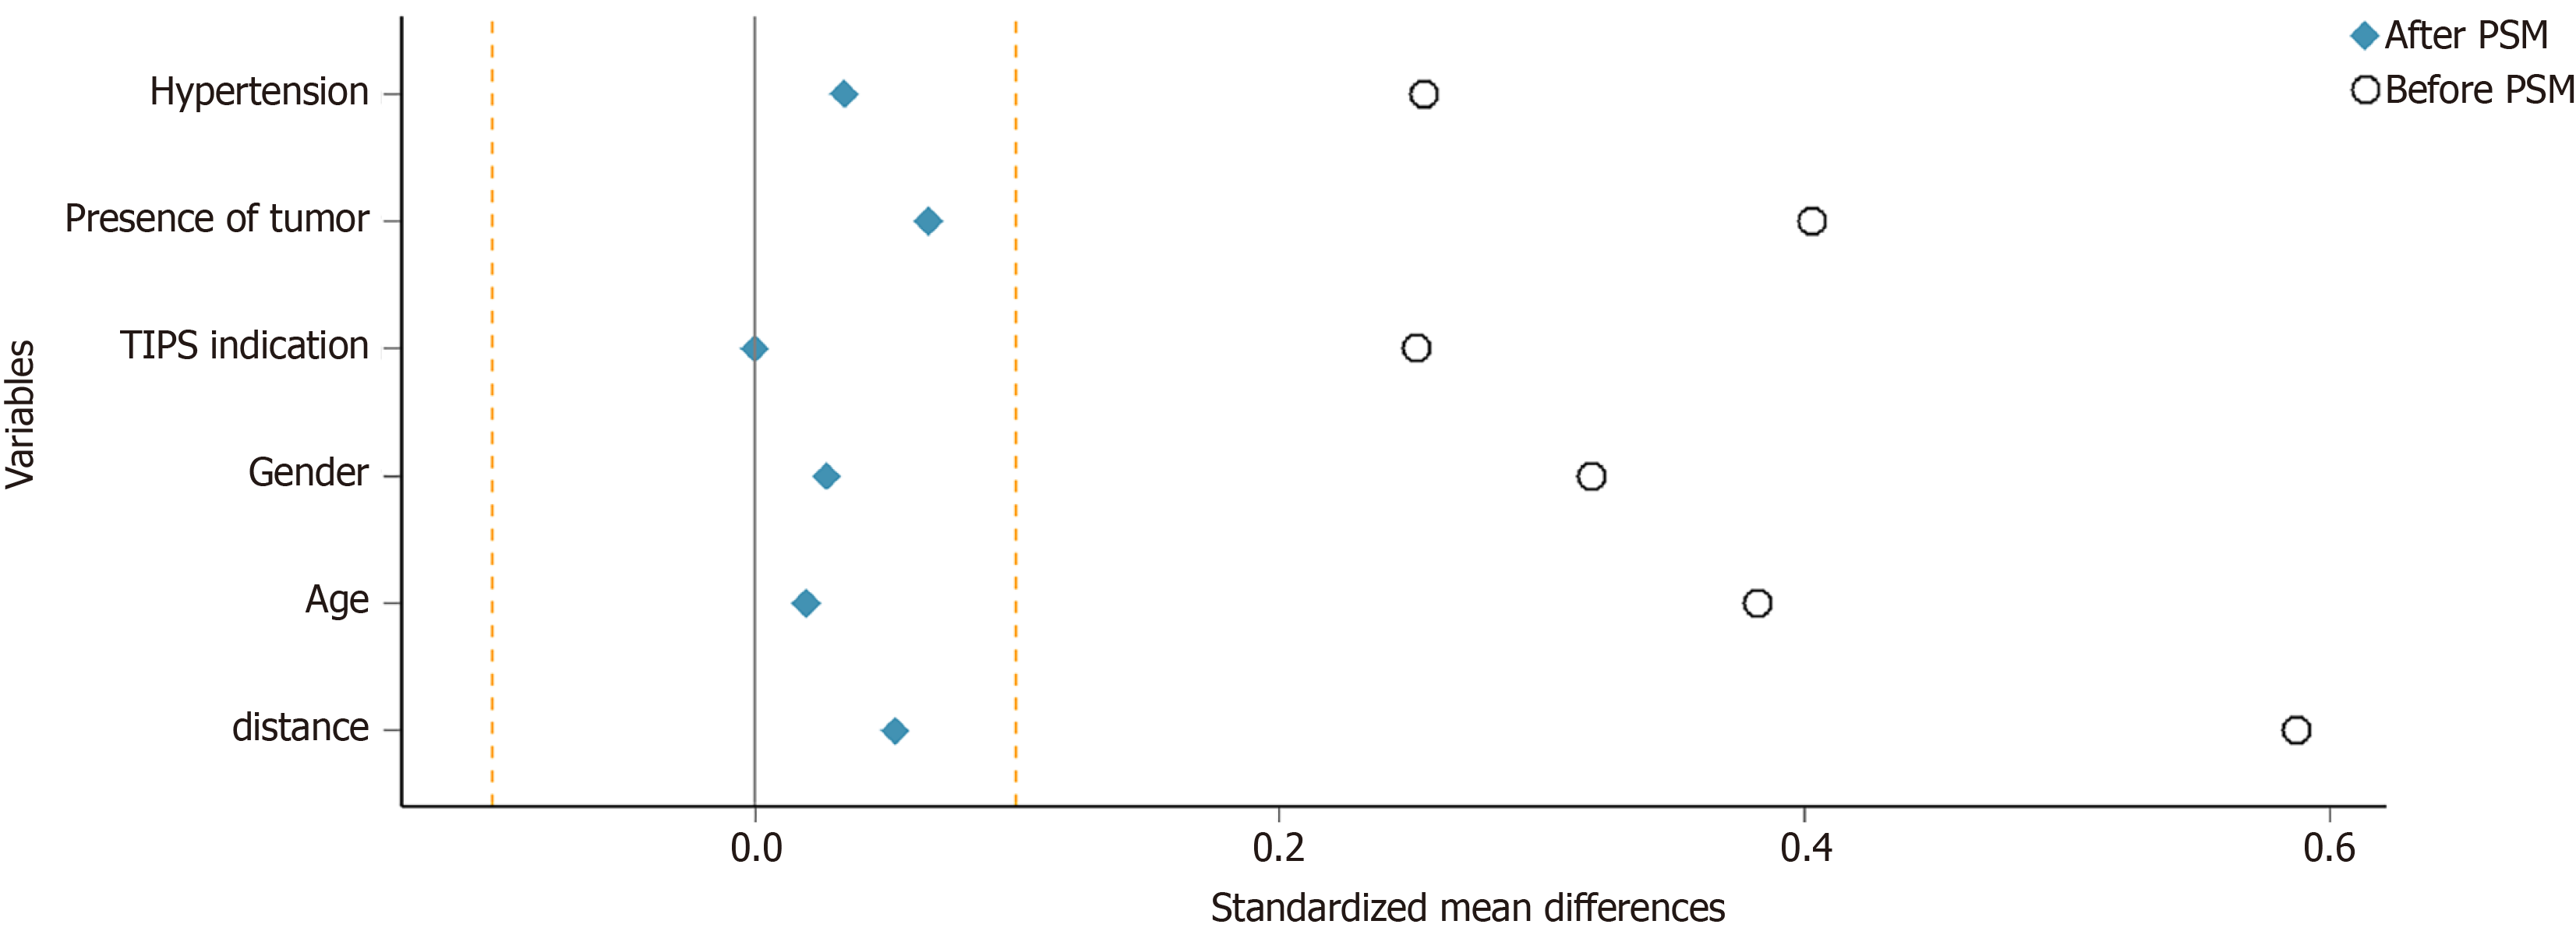
Figure 2 Comparison of standardized mean differences in the main baseline characteristics of transjugular intrahepatic portosystemic shunt patients before and after propensity score matching.
Before propensity score matching, there were statistically significant differences between the two groups regarding liver cancer, indication for transjugular intrahepatic portosystemic shunt, hypertension, sex, and age; the standardized mean differences for all variables were > 0.2. After propensity score matching, the standardized mean differences for all variables were < 0.1, indicating effective matching. PSM: Propensity score matching.
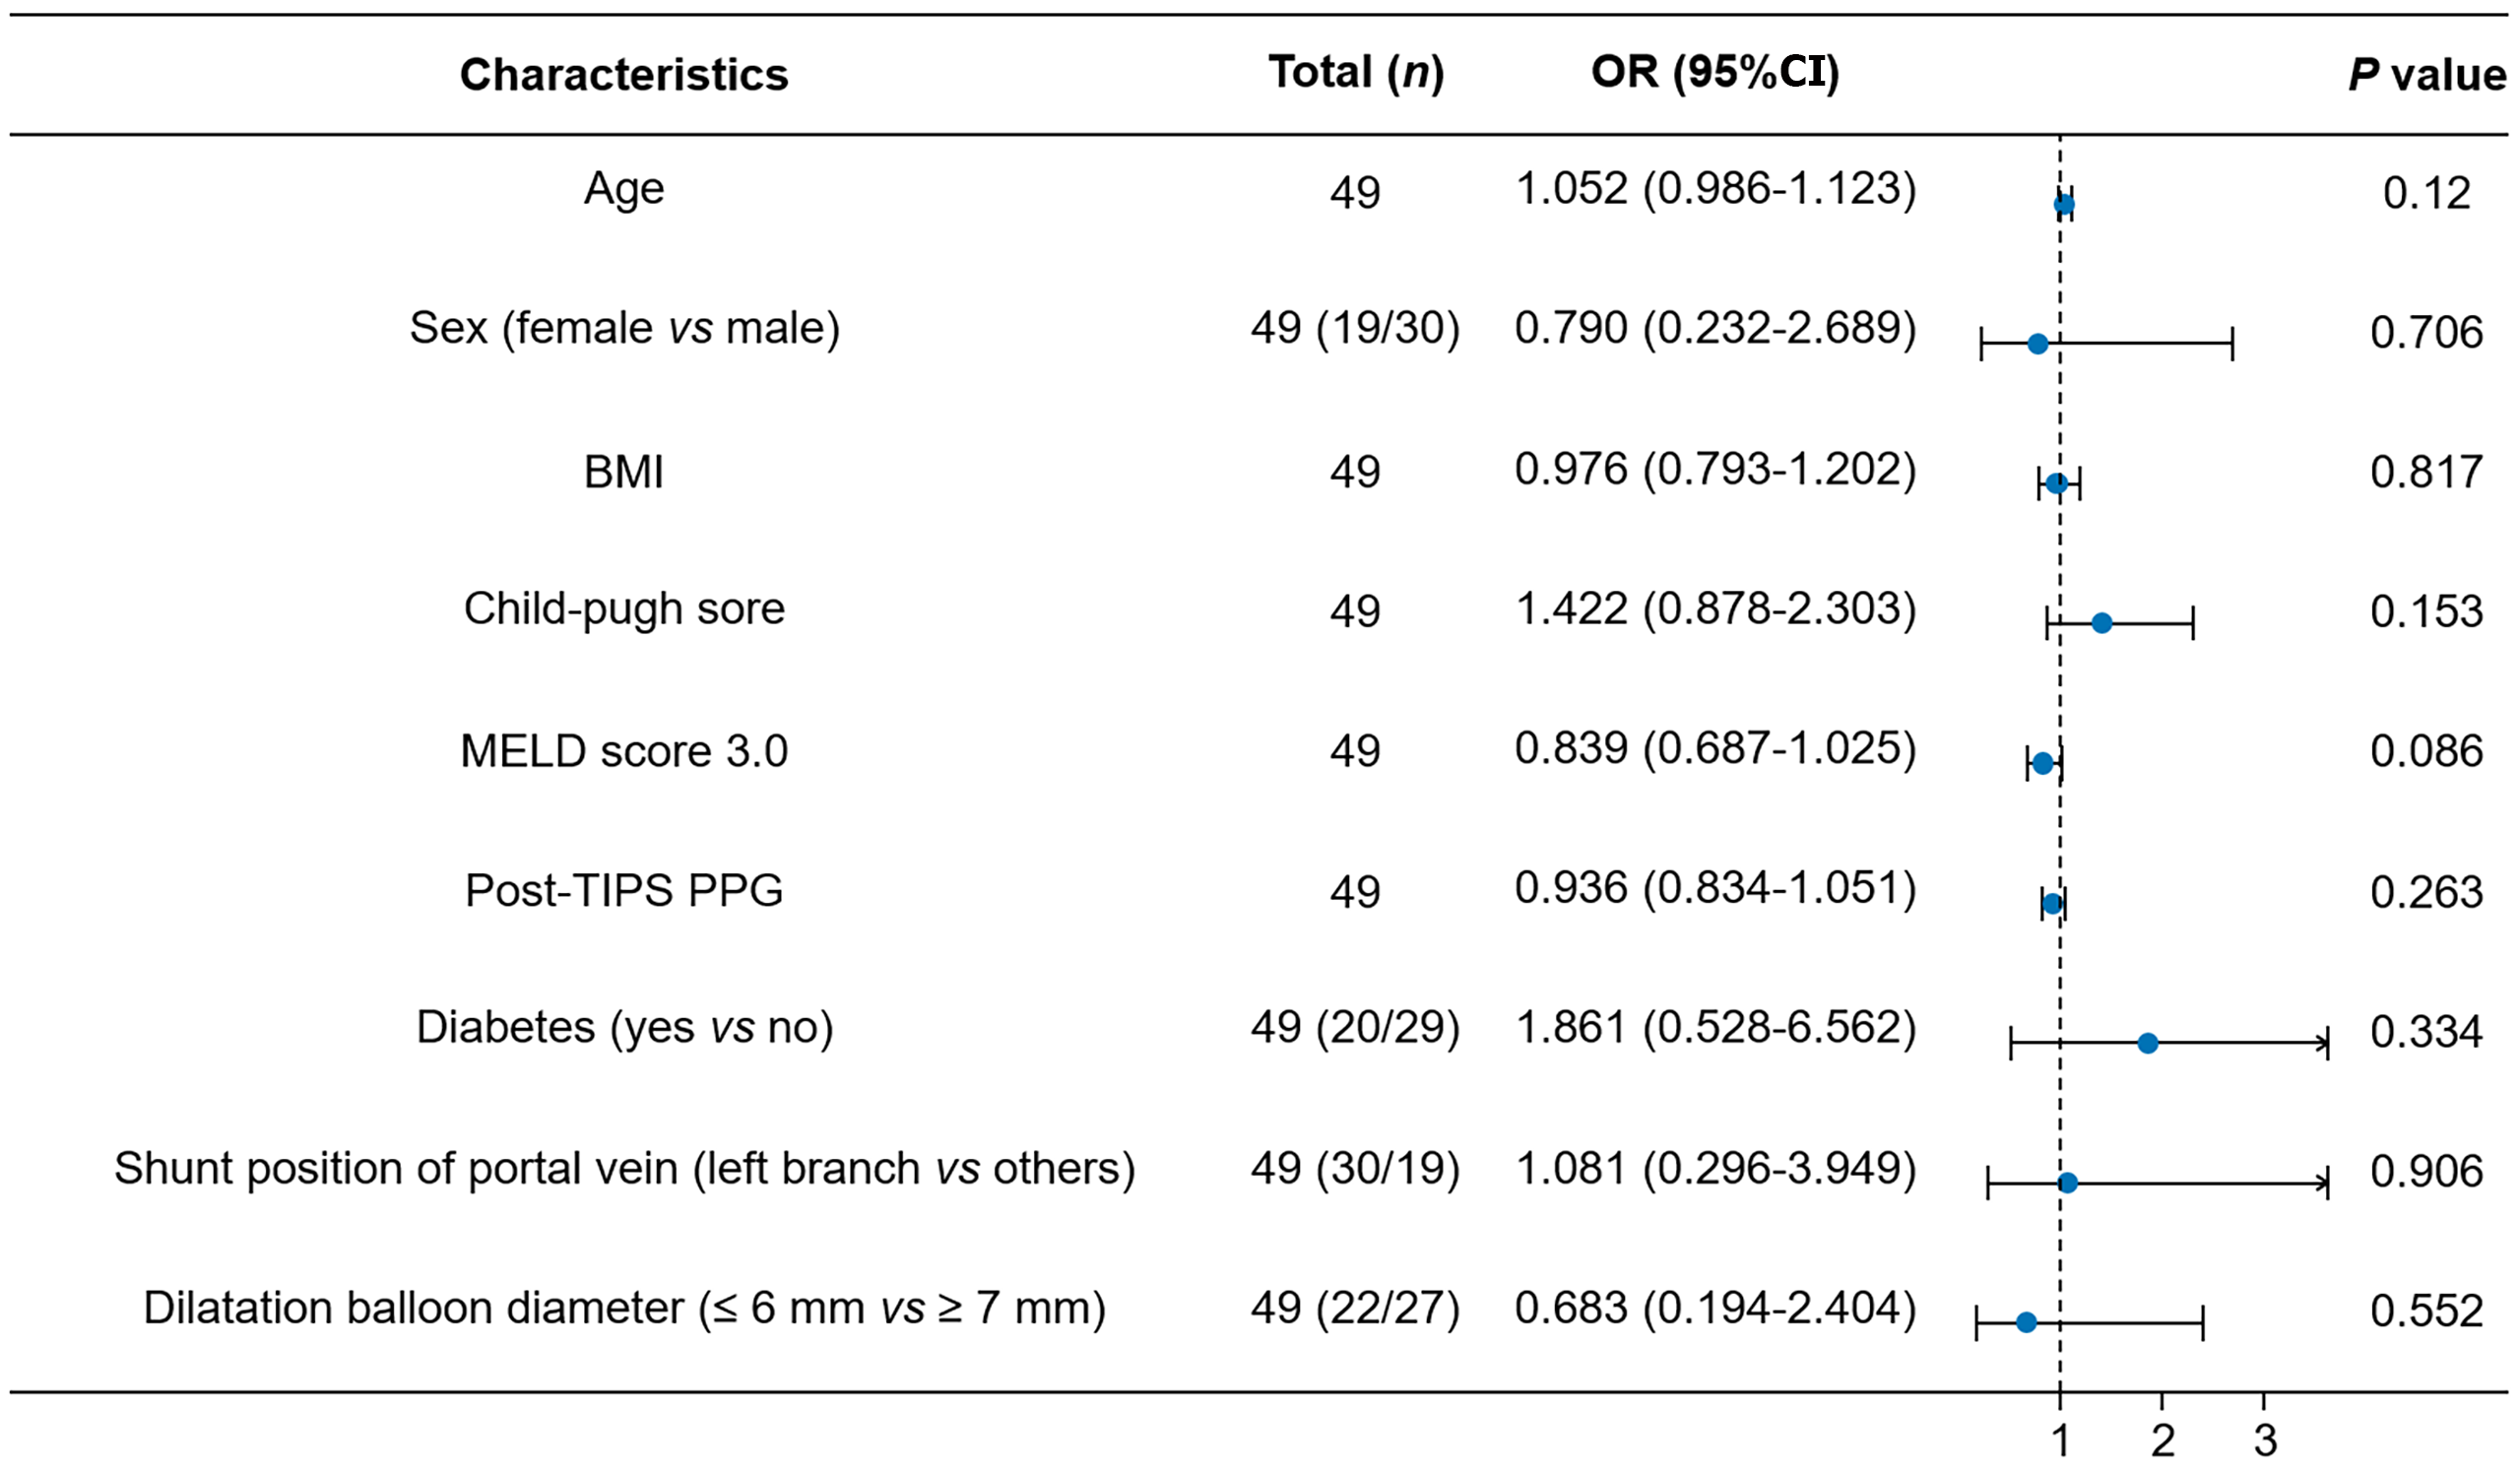
Figure 3 Forest plot of risk factors for hepatic encephalopathy severity in post-transjugular intrahepatic portosystemic shunt patients using ordinal logistic regression.
No significant association between the underdilation strategy and overt hepatic encephalopathy severity (odds ratio = 0.683, 95% confidence interval: 0.194-2.404, P = 0.552). OR: Odds ratio; CI: Confidence interval; BMI: Body mass index; MELD: Model for end-stage liver disease; TIPS: Transjugular intrahepatic portosystemic shunt; PPG: Portal venous pressure gradient.
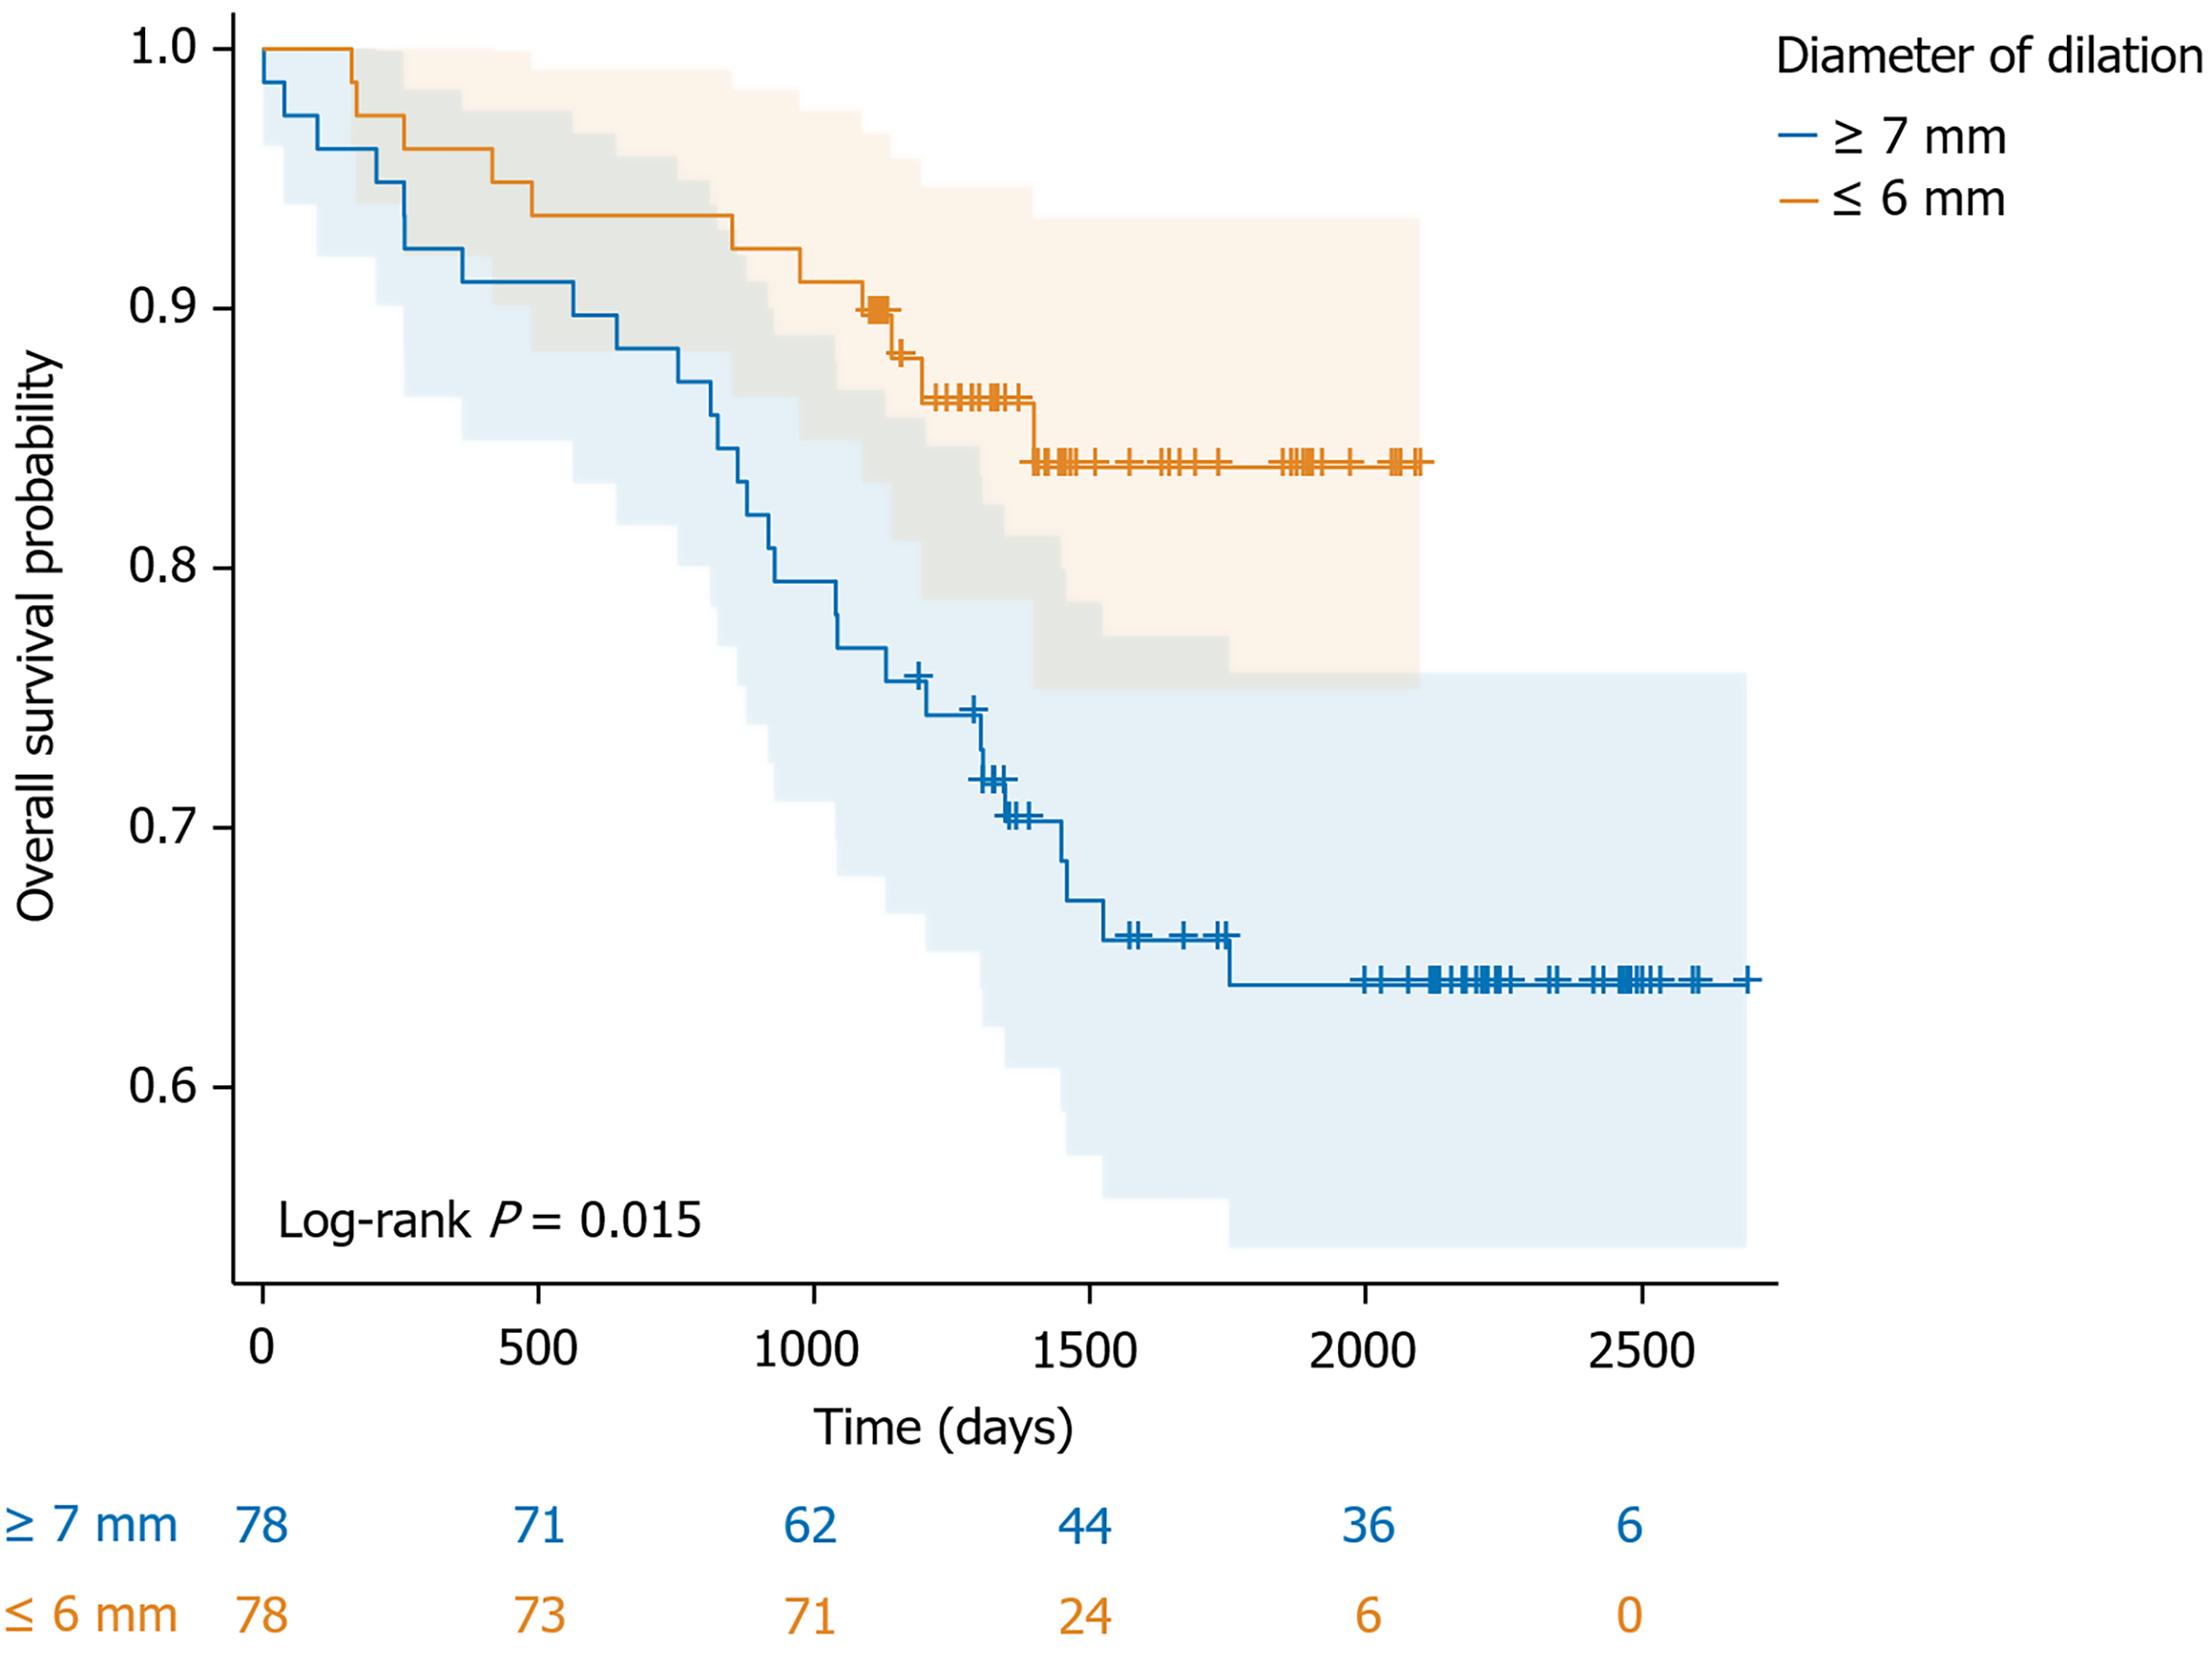
Figure 4 Kaplan-Meier curves for overall survival after propensity score matching.
Patients in the ≤ 6 mm group experienced a significant mid-to-long-term survival benefit compared with those in the ≥ 7 mm group (log-rank P = 0.015).
- Citation: Zhang WQ, Li KJ, Yang F, Jiang GJ, Zhang L, Jiang H, Guo H, Li SW. Association of smaller-diameter underdilation of transjugular intrahepatic portosystemic shunt stents with improved long-term survival: A propensity score-matched study. World J Gastroenterol 2026; 32(45): 121243
- URL: https://www.wjgnet.com/1007-9327/full/v32/i45/121243.htm
- DOI: https://dx.doi.org/10.3748/wjg.121243