
















Copyright: ©Author(s) 2026.
World J Gastroenterol. Oct 28, 2026; 32(40): 124864
Published online Oct 28, 2026. doi: 10.3748/wjg.124864
Published online Oct 28, 2026. doi: 10.3748/wjg.124864
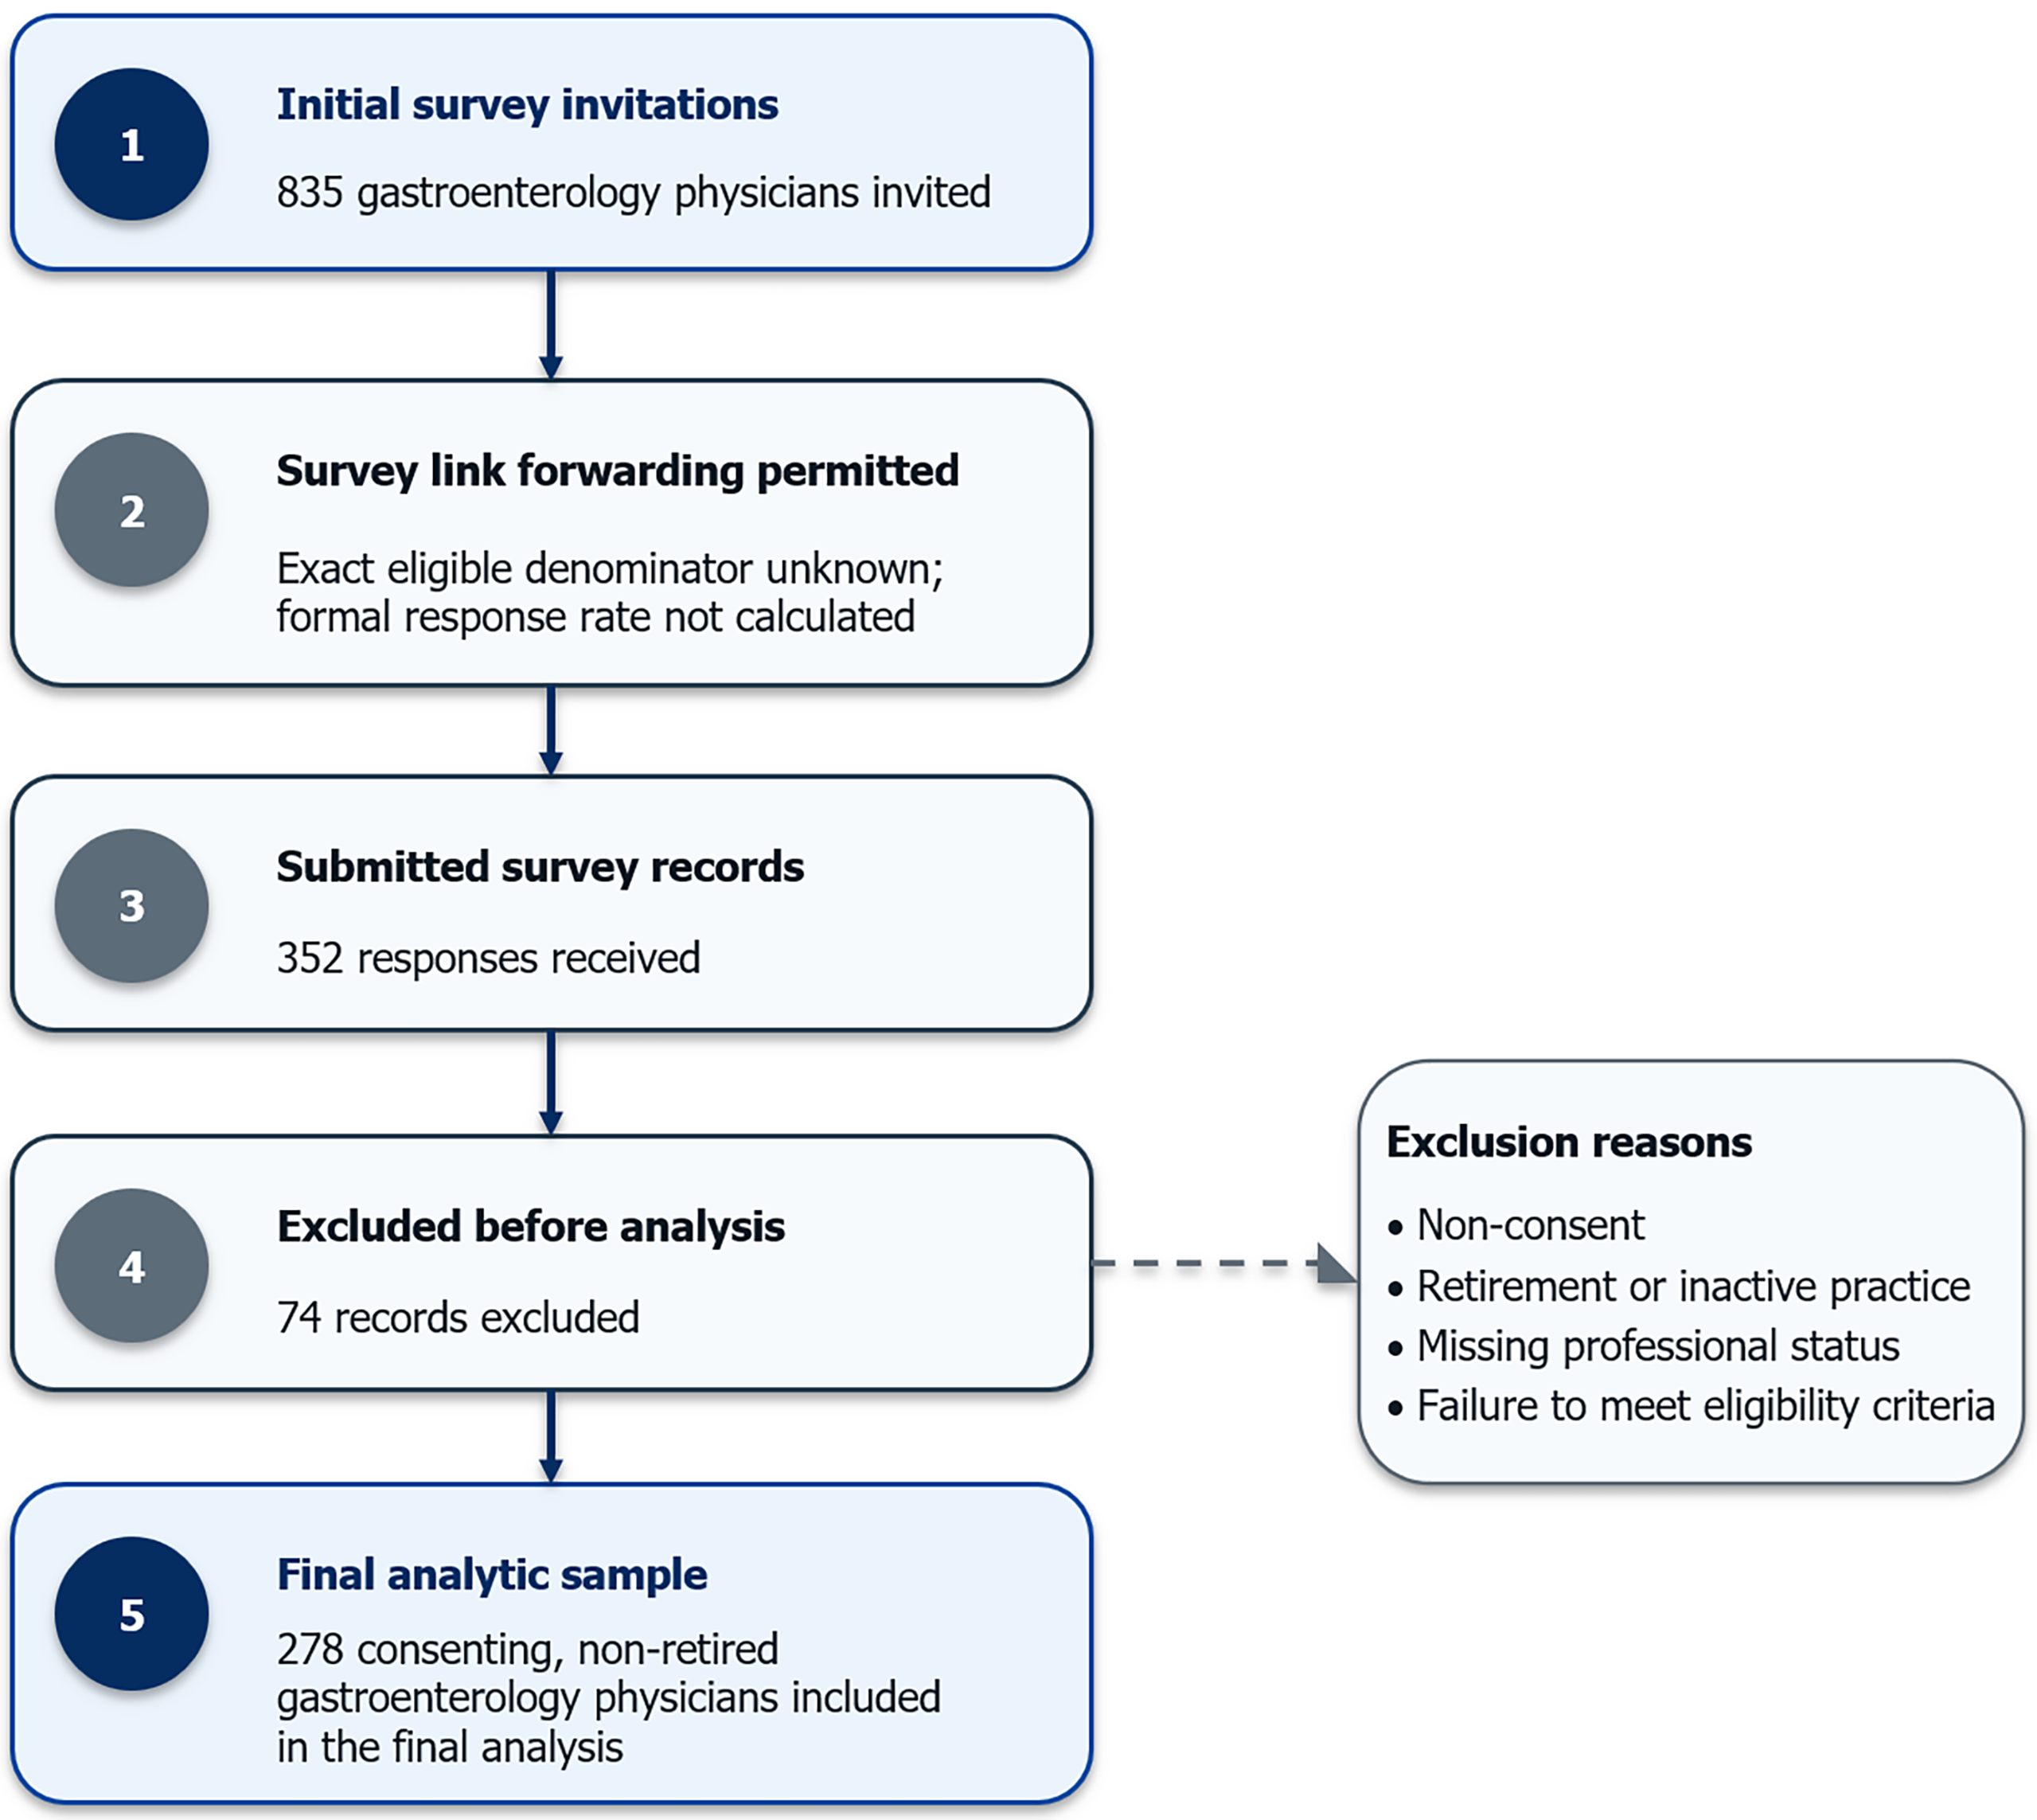
Figure 1 Participant recruitment and analytic sample.
Flow diagram showing participant recruitment and inclusion in the final analytic sample. Initial invitations were sent to 835 gastroenterology physicians. Because forwarding of the survey link was permitted, the exact eligible denominator could not be determined and a formal response rate could not be calculated. Of 352 submitted survey records, 278 consenting, non-retired physicians who were actively practising gastroenterology and met all eligibility criteria were included in the final analysis.
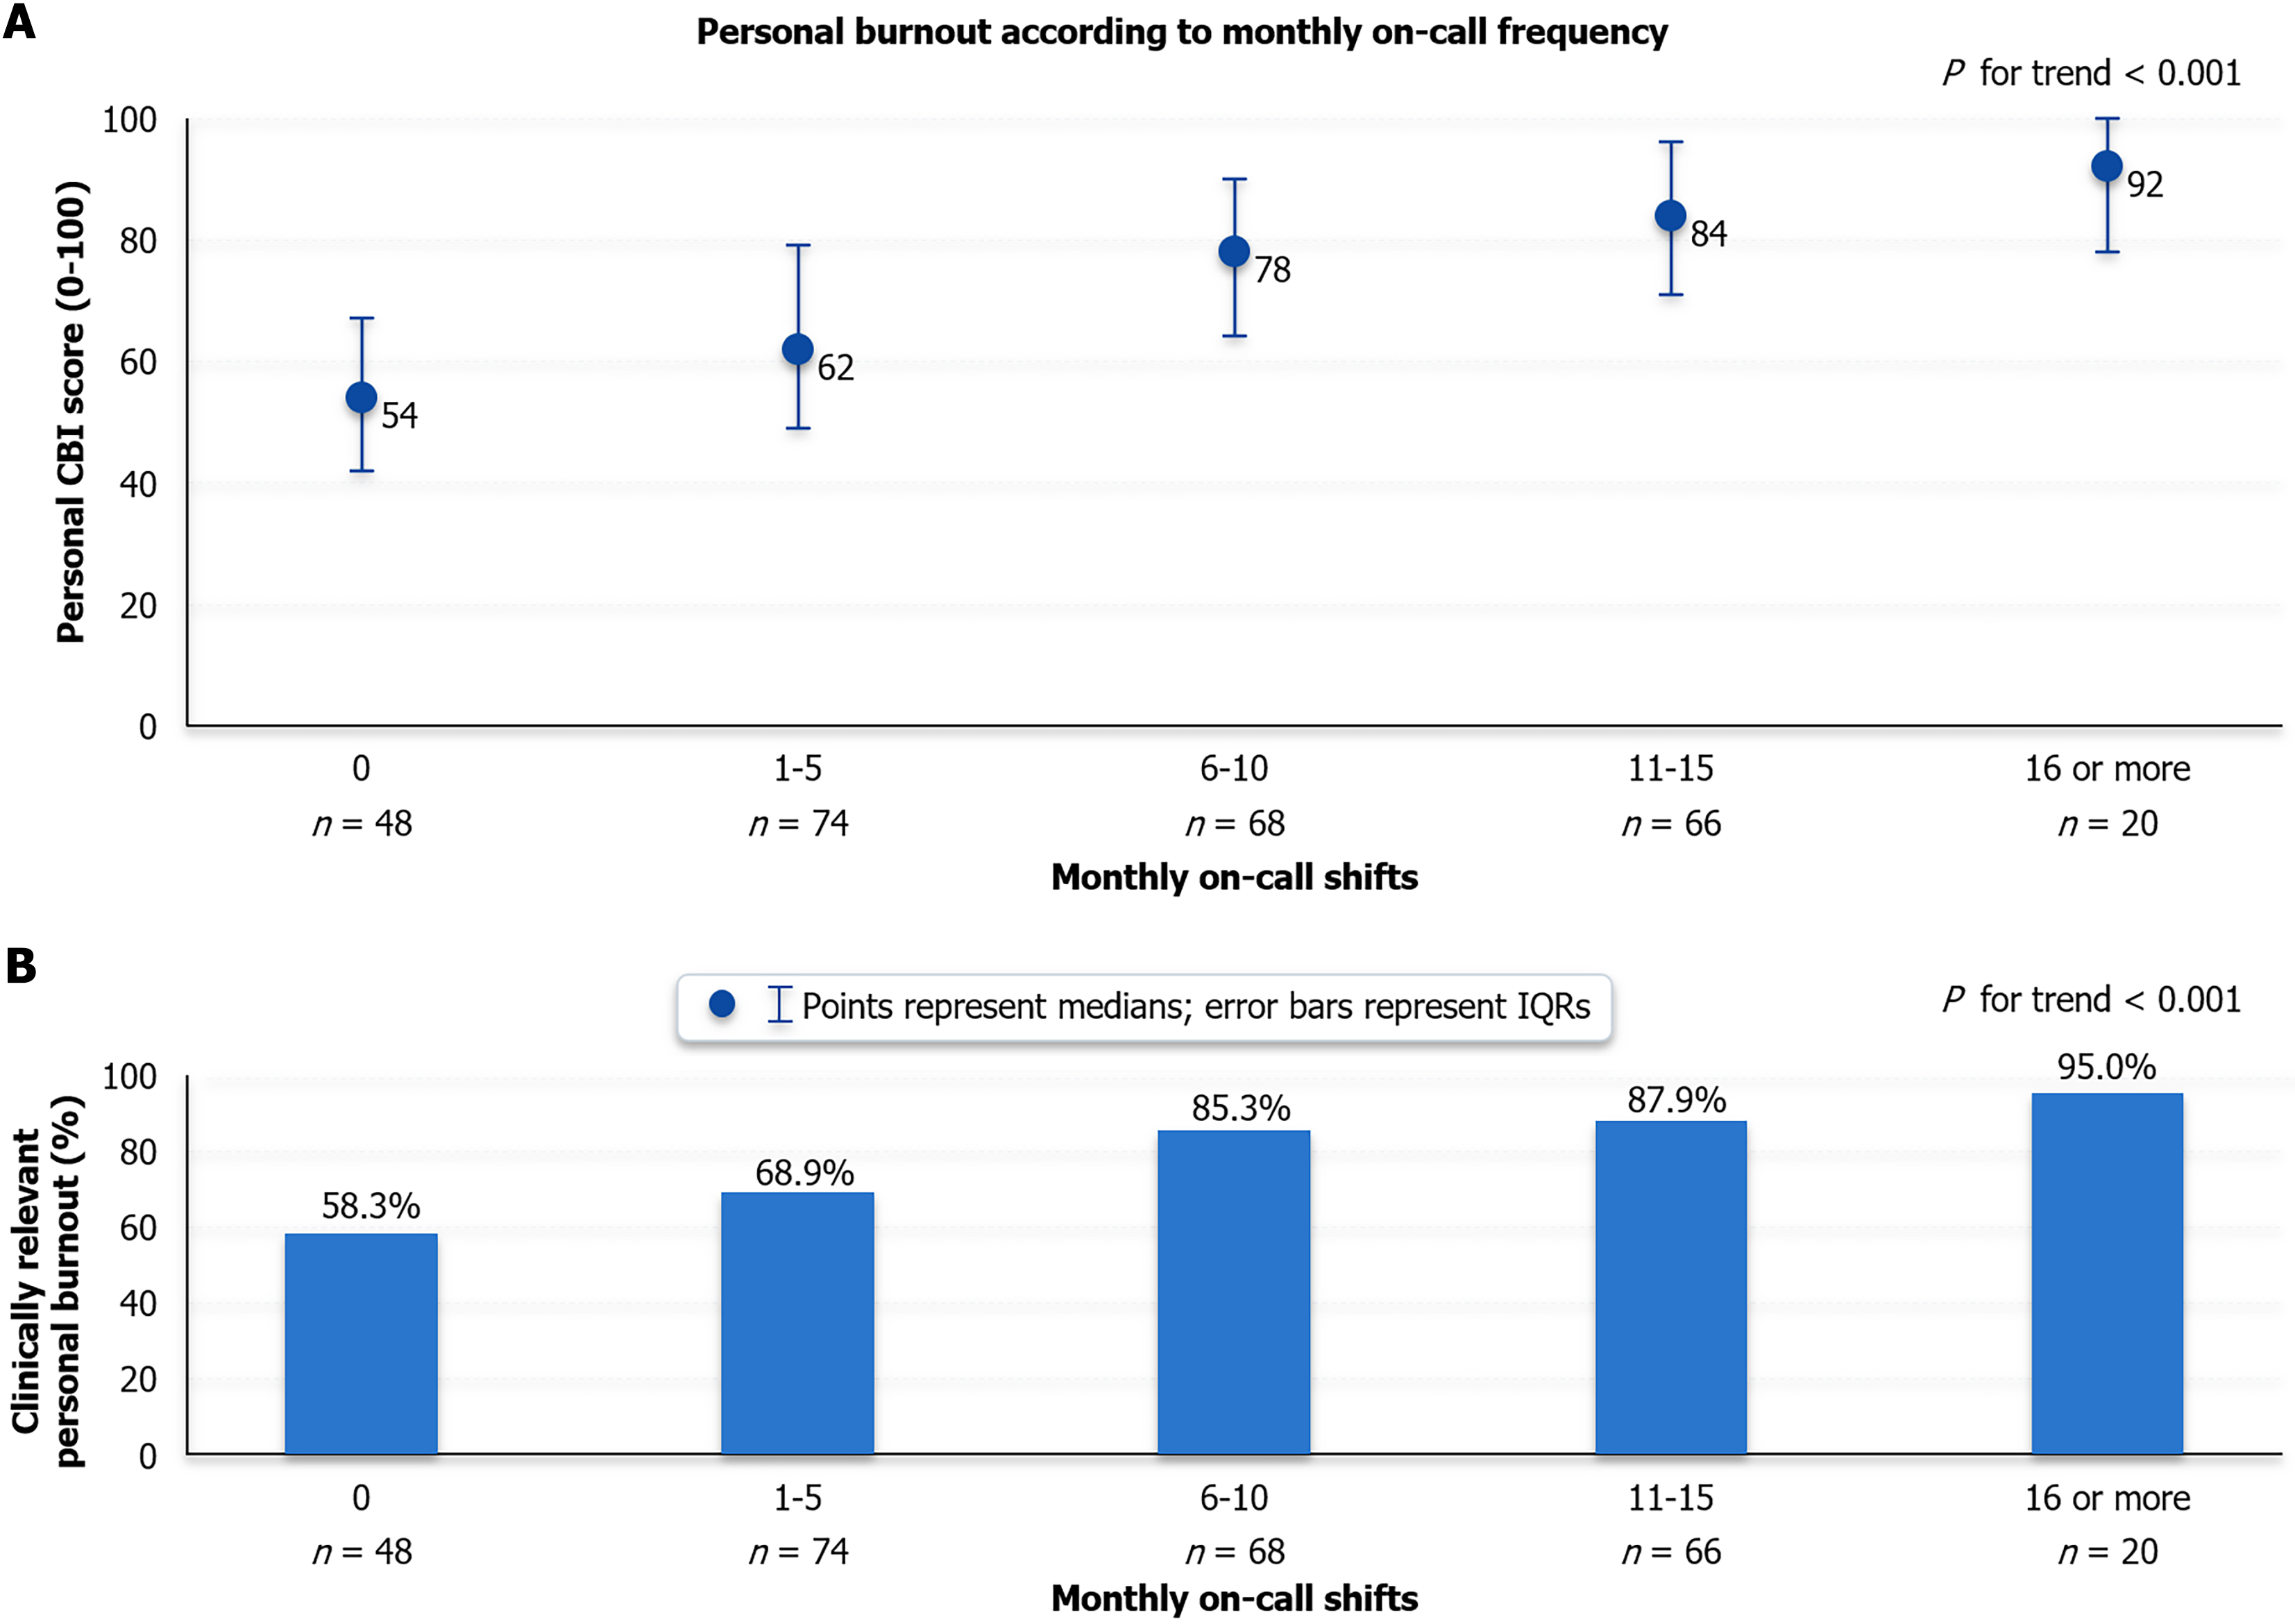
Figure 2 Personal burnout according to monthly on-call frequency.
Personal burnout increased progressively across categories of monthly on-call frequency. A: Median personal burnout scores; B: The proportion of respondents with clinically relevant personal burnout across ordered on-call categories. Clinically relevant personal burnout was defined as a personal Copenhagen Burnout Inventory score of 50 or higher. Trends across monthly on-call categories were statistically significant for both personal burnout score and the proportion of respondents with a personal burnout score of 50 or higher (P for trend < 0.001 for both). CBI: Copenhagen Burnout Inventory; IQRs: Interquartile ranges.
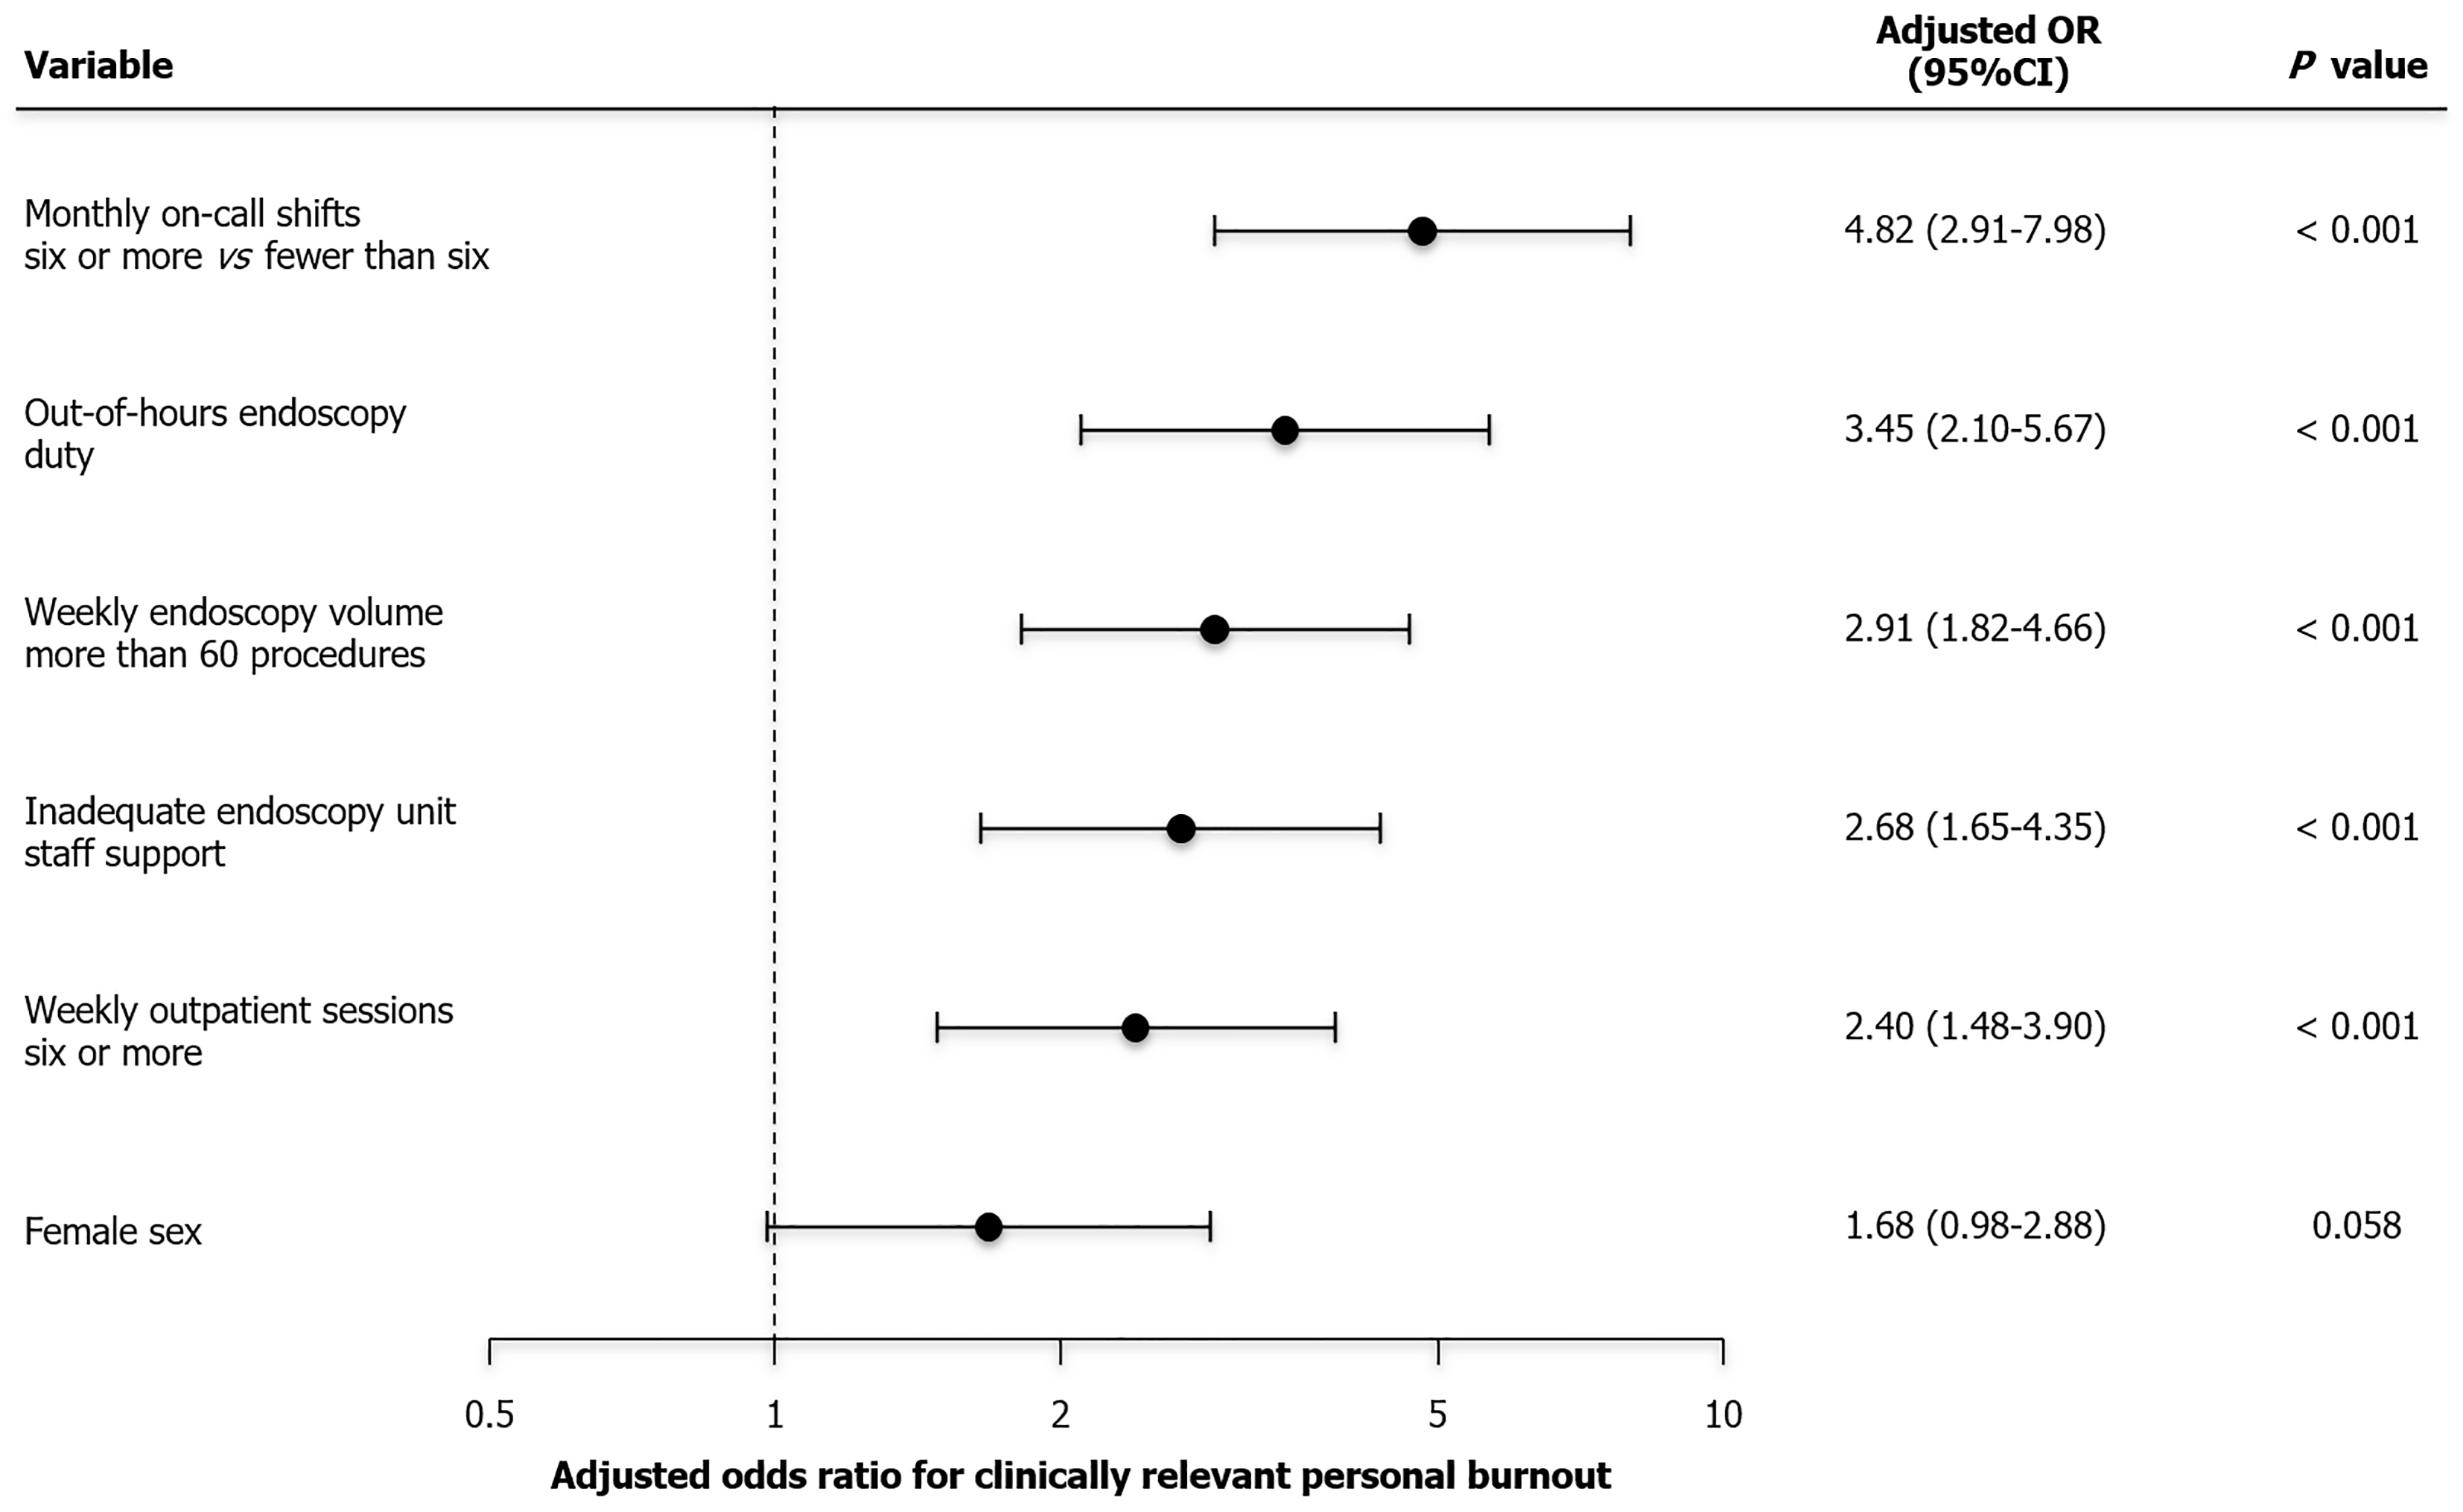
Figure 3 Factors associated with clinically relevant personal burnout.
Forest plot displaying adjusted odds ratios and 95% confidence intervals for factors independently associated with clinically relevant personal burnout in multivariable logistic regression. Clinically relevant personal burnout was defined as a personal Copenhagen Burnout Inventory score of 50 or higher. The model included monthly on-call burden (six or more vs fewer than six shifts per month), out-of-hours endoscopy duty, weekly endoscopy volume (more than 60 vs 60 or fewer procedures per week), inadequate endoscopy unit staff support, weekly outpatient session burden (six or more vs fewer than six sessions per week), and female sex, and was adjusted for age, marital status, dependents, and years of professional experience. The dashed vertical line denotes an odds ratio of 1. CI: Confidence interval; OR: Odds ratio.
- Citation: Özden Y, Cankurtaran RE, Keklikkıran Ç, Erdoğan Ç. Burnout and endoscopy-specific workload among gastroenterologists and gastroenterology fellows in Türkiye: A national cross-sectional survey. World J Gastroenterol 2026; 32(40): 124864
- URL: https://www.wjgnet.com/1007-9327/full/v32/i40/124864.htm
- DOI: https://dx.doi.org/10.3748/wjg.124864