
















Copyright: ©Author(s) 2026.
World J Gastroenterol. Sep 28, 2026; 32(36): 119724
Published online Sep 28, 2026. doi: 10.3748/wjg.119724
Published online Sep 28, 2026. doi: 10.3748/wjg.119724
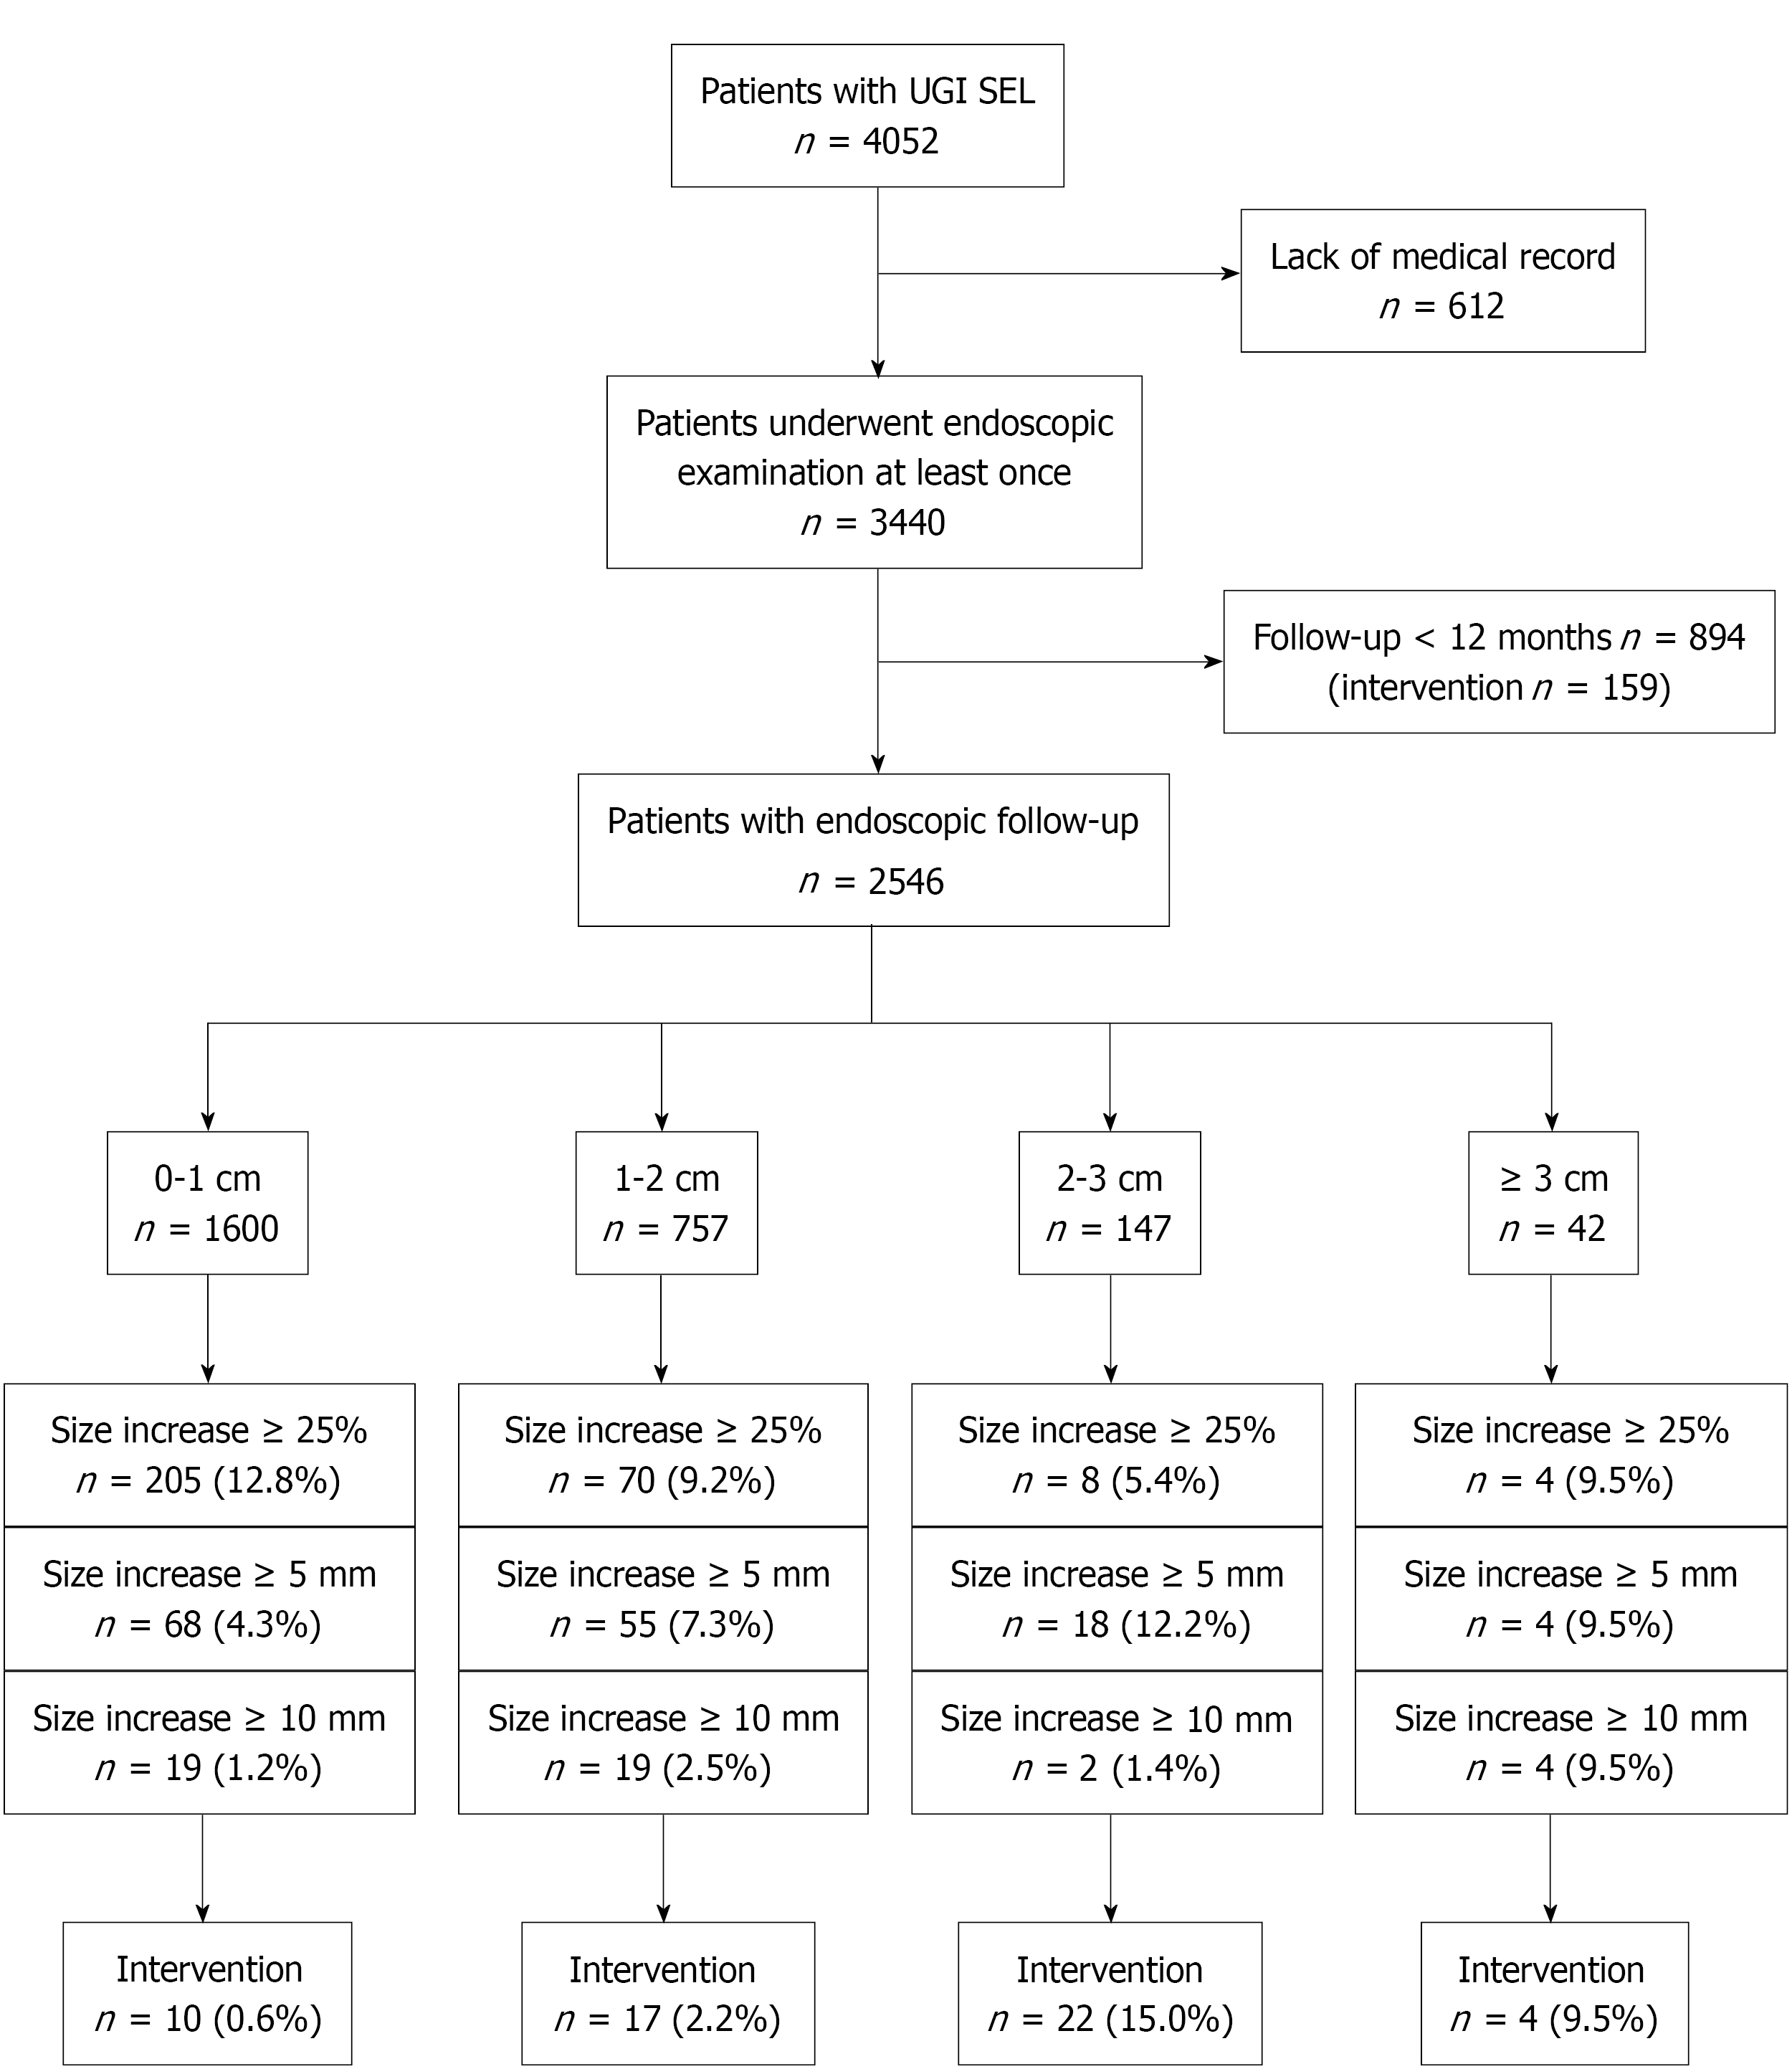
Figure 1 Study flowchart.
UGI SEL: Upper gastrointestinal subepithelial lesion.
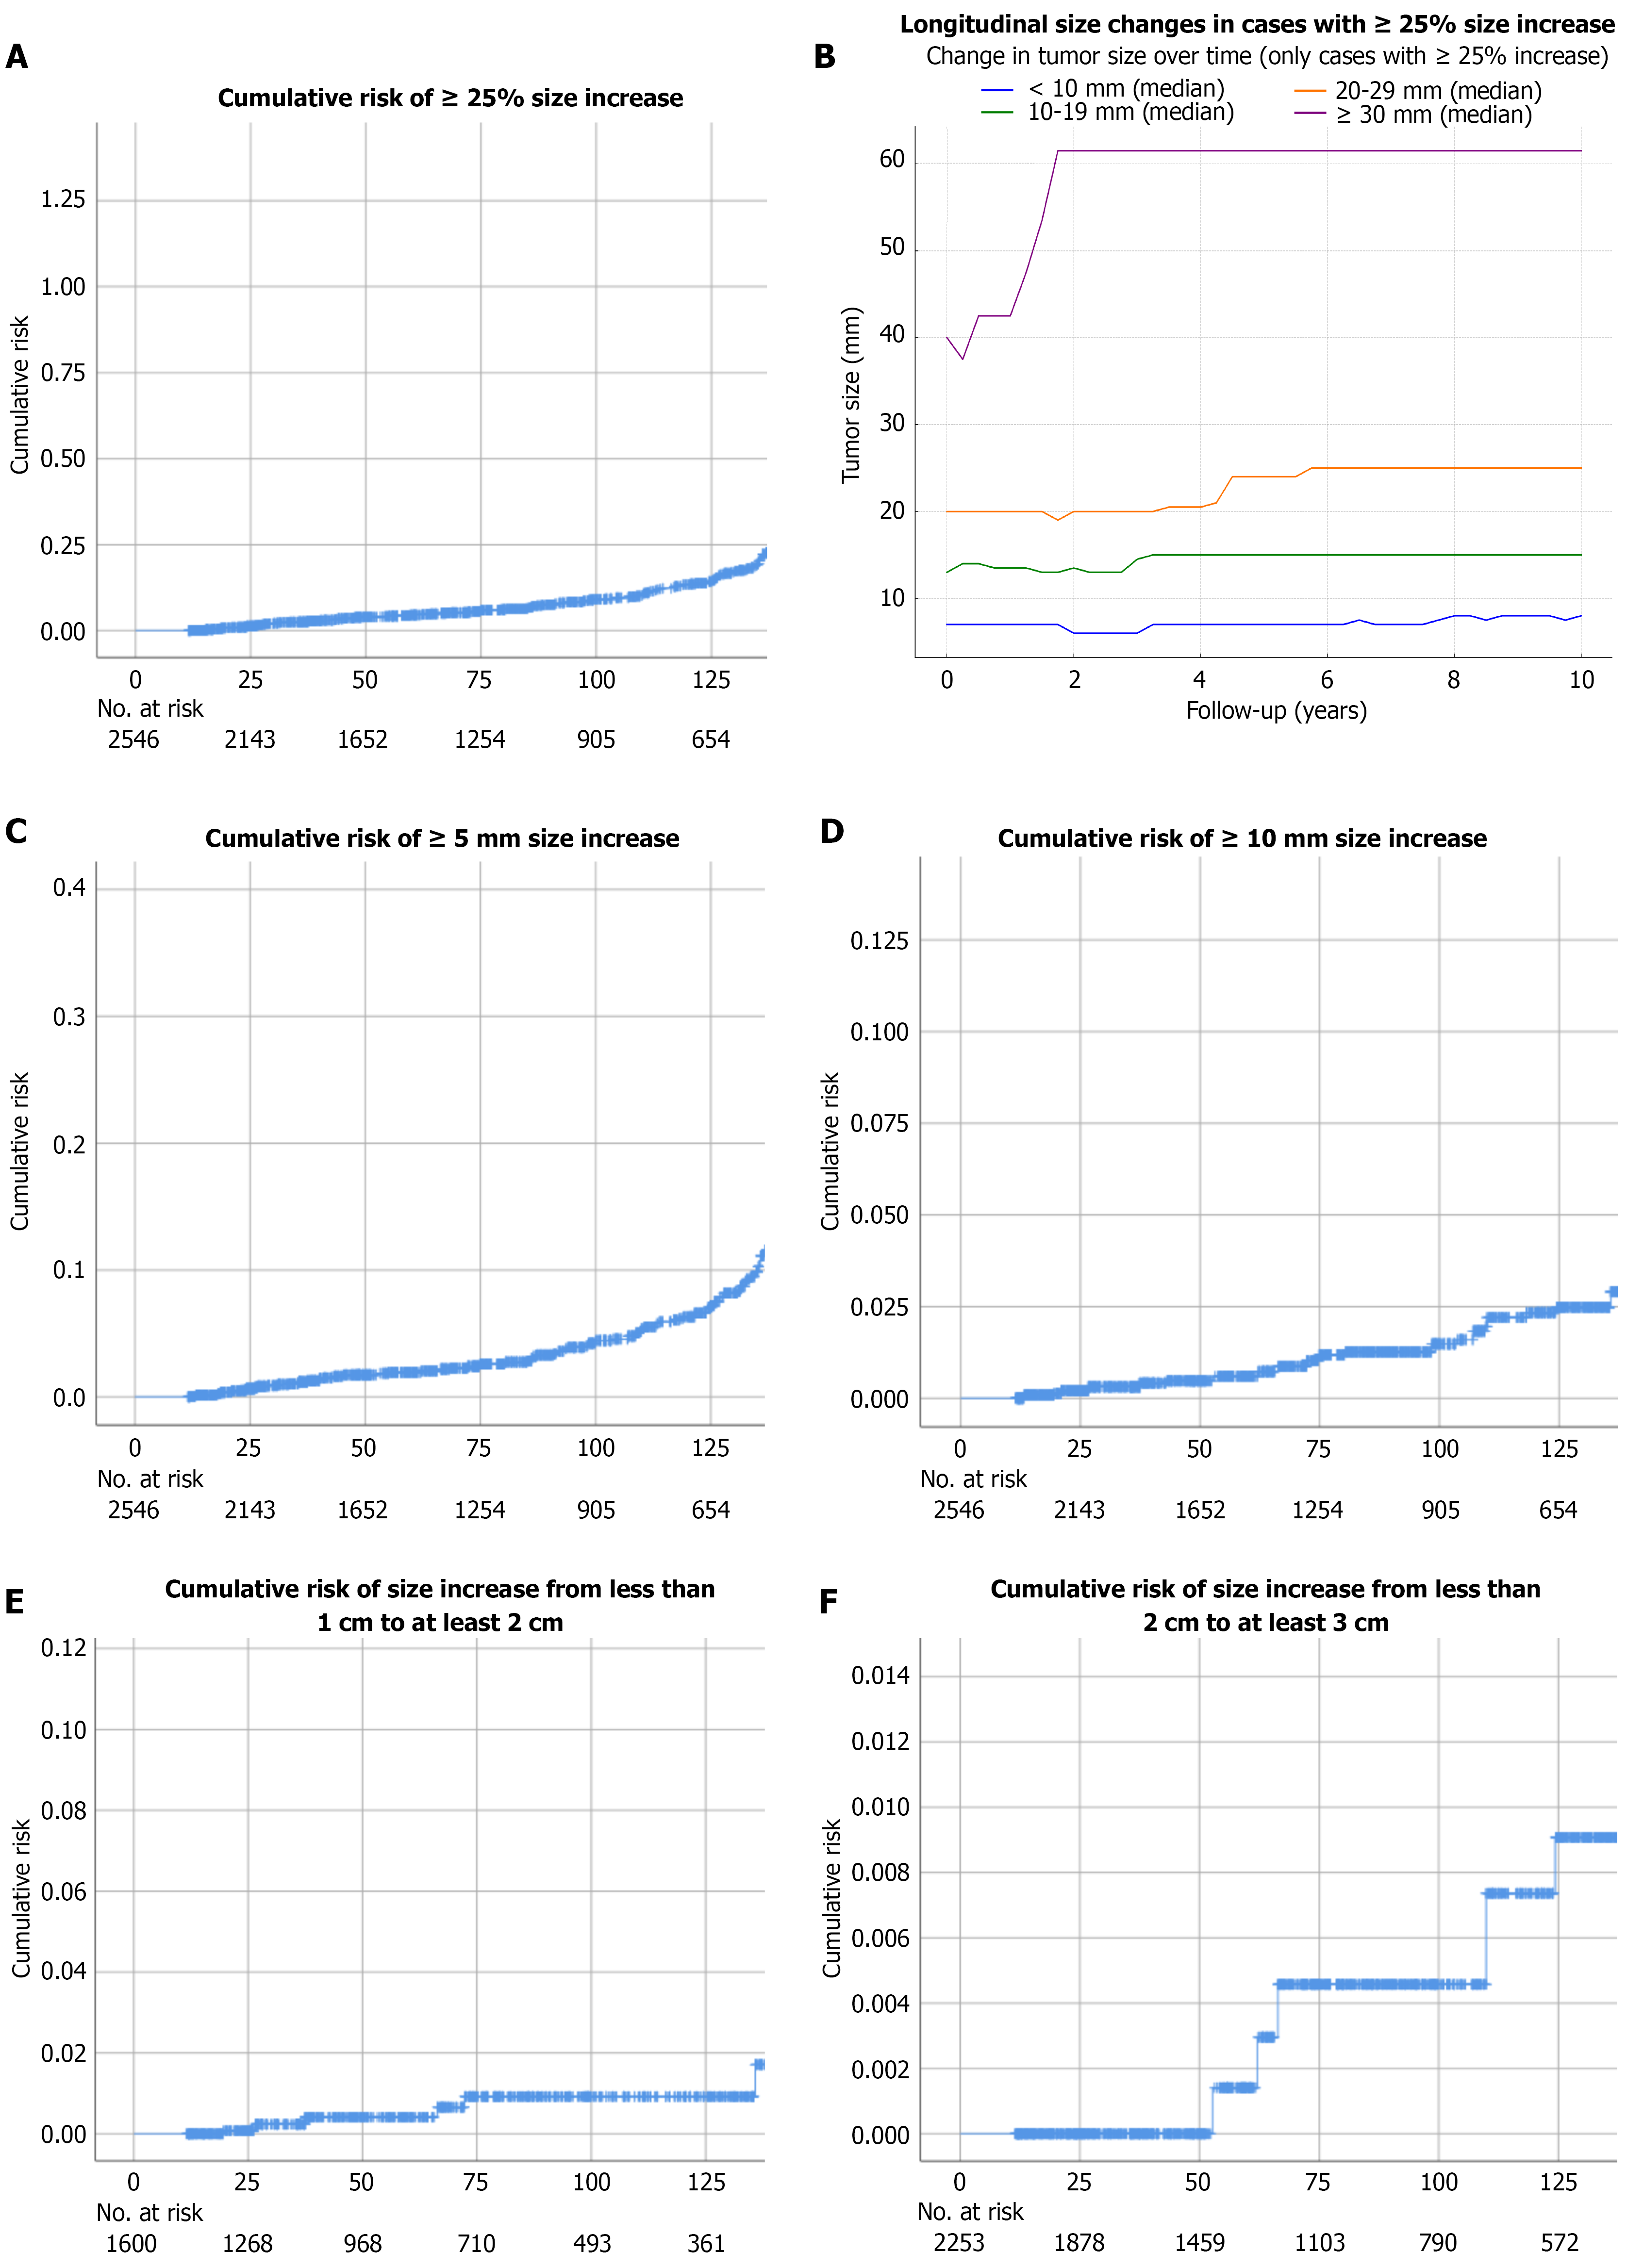
Figure 2 Cumulative risk of lesion size increase.
A: Cumulative risk of ≥ 25% size increase; B: Longitudinal lesion changes in cases with a ≥ 25% size increase; C-F: Cumulative risks of ≥ 5 mm (C), ≥ 10 mm (D), from < 1 cm to ≥ 2 cm (E), and from < 2 cm to ≥ 3 cm (F) size increases. The 5-year cumulative risk of a size increase of ≥ 25%, ≥ 5 mm, and ≥ 10 mm are 4.0%, 2.0%, and 0.6%, respectively. Significantly faster growth is observed in lesions ≥ 3 cm at baseline. The cumulative risk for a size increase from < 1 cm to ≥ 2 cm and from < 2 cm to ≥ 3 cm, are 0.4% and 0.1%, respectively.
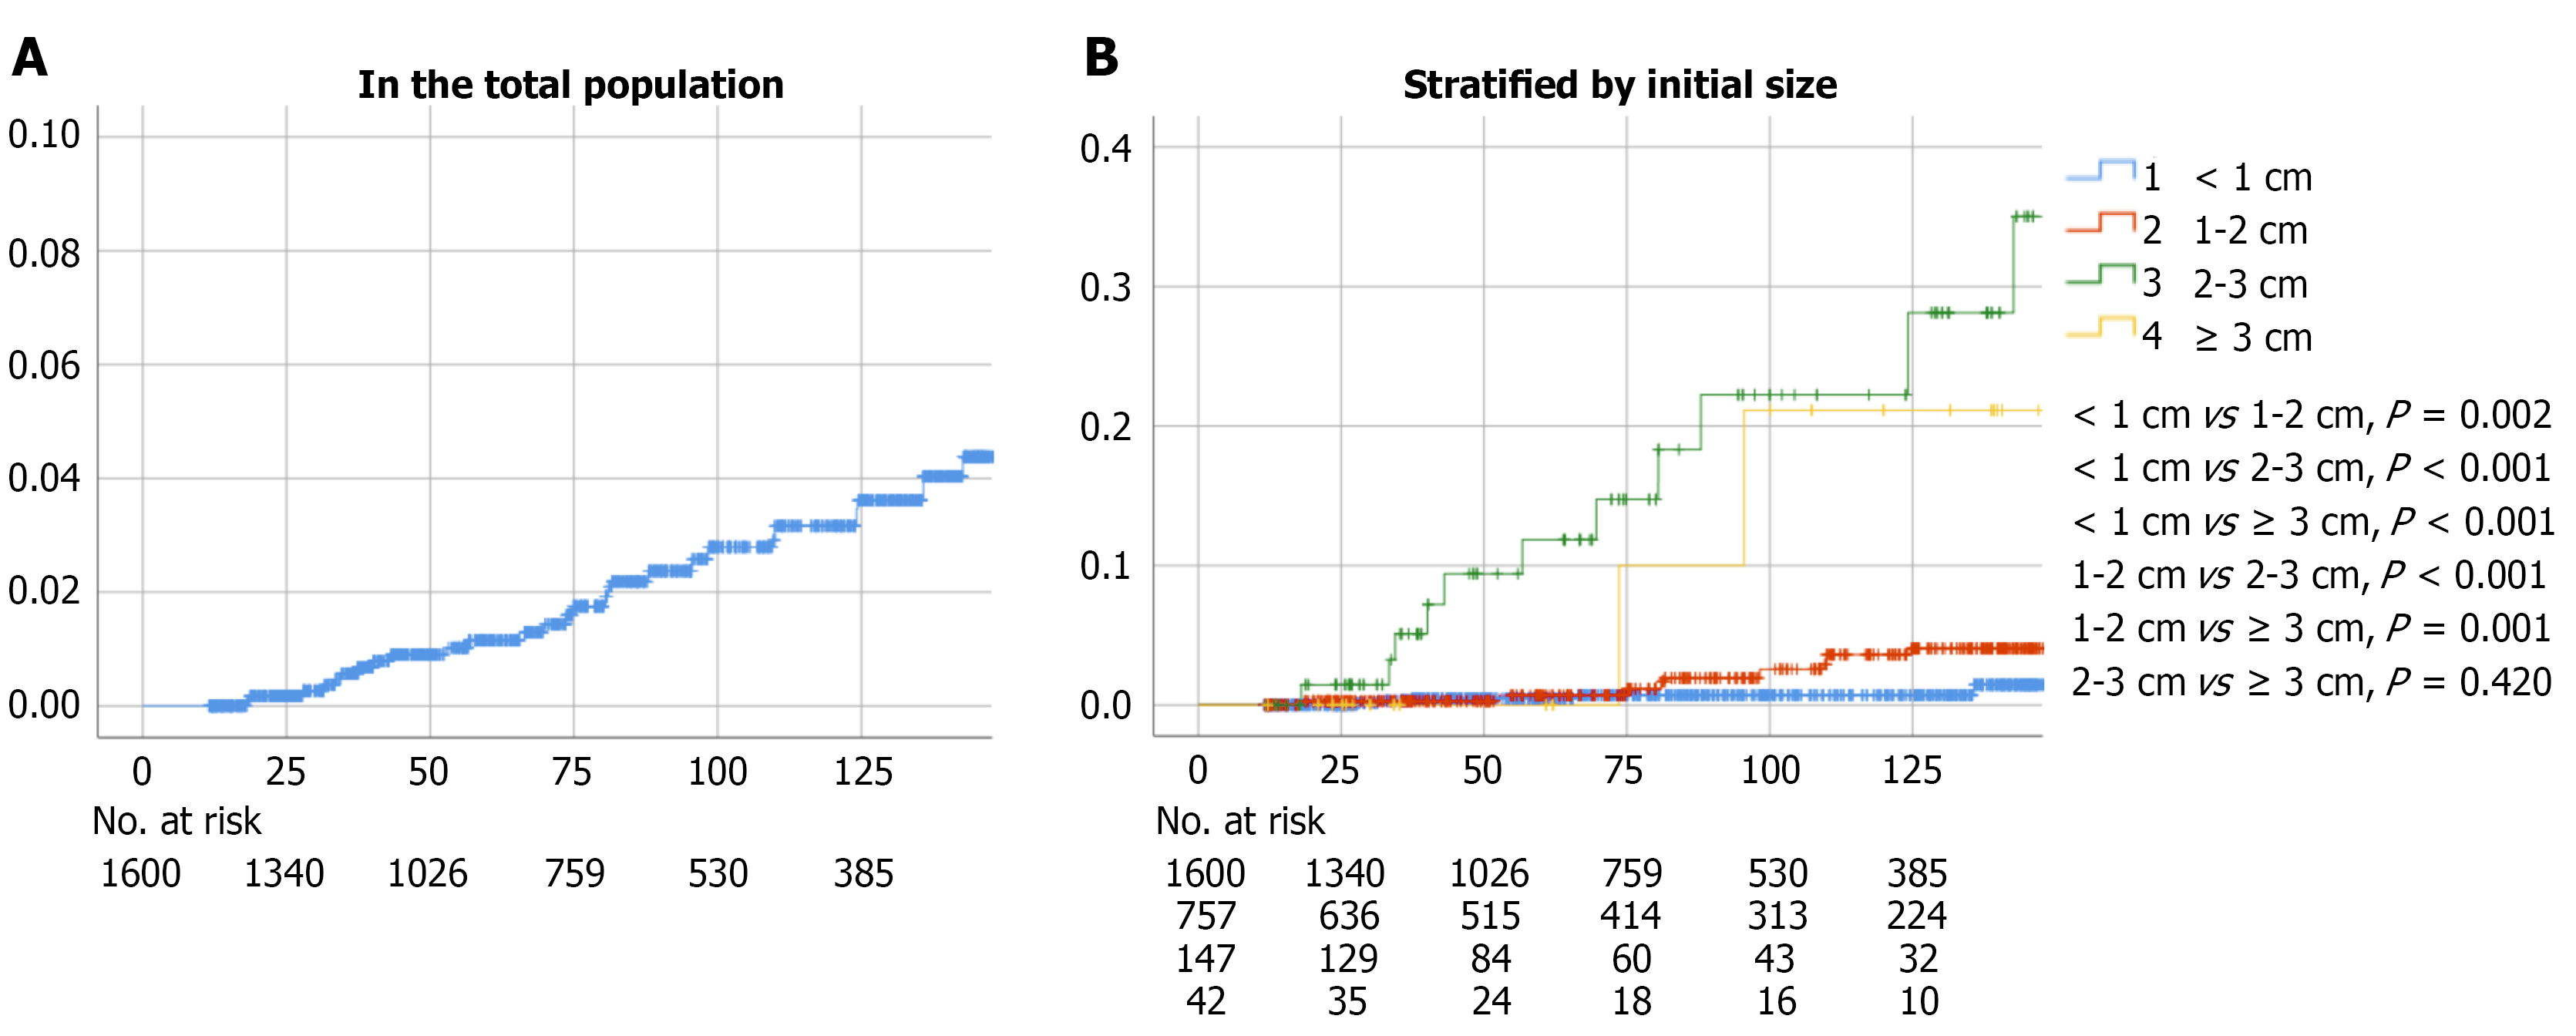
Figure 3 Cumulative risk for intervention.
A and B: Cumulative risks of intervention in the study population (A) and stratified by initial lesion size (B). The 5-year cumulative risk of intervention is 1.0%, with a significantly higher risk observed in lesions with an initial size of ≥ 2 cm. Group-wise comparisons of cumulative risk are also shown: < 1 cm vs 1-2 cm (P = 0.002), < 1 cm vs 2-3 cm (P < 0.001), < 1 cm vs ≥ 3 cm (P < 0.001), 1-2 cm vs 2-3 cm (P < 0.001), 1-2 cm vs ≥ 3 cm (P = 0.001), and 2-3 cm vs ≥ 3 cm (P = 0.420).
- Citation: Choi Y, Park JY, Kim SE, Park JM, Kim JS, Chung H, Kim SH, Park CH, Kim SH, Park SY, Lee BE, Lee SW, Lee A, Lee JH, Jung DH, Jo HH, Yoo IH, Min BH, Jung HY. Natural history of asymptomatic subepithelial lesions of the upper gastrointestinal tract: A multicenter study in Korea. World J Gastroenterol 2026; 32(36): 119724
- URL: https://www.wjgnet.com/1007-9327/full/v32/i36/119724.htm
- DOI: https://dx.doi.org/10.3748/wjg.119724