
















Copyright: ©Author(s) 2026.
World J Gastroenterol. Sep 28, 2026; 32(36): 119629
Published online Sep 28, 2026. doi: 10.3748/wjg.119629
Published online Sep 28, 2026. doi: 10.3748/wjg.119629
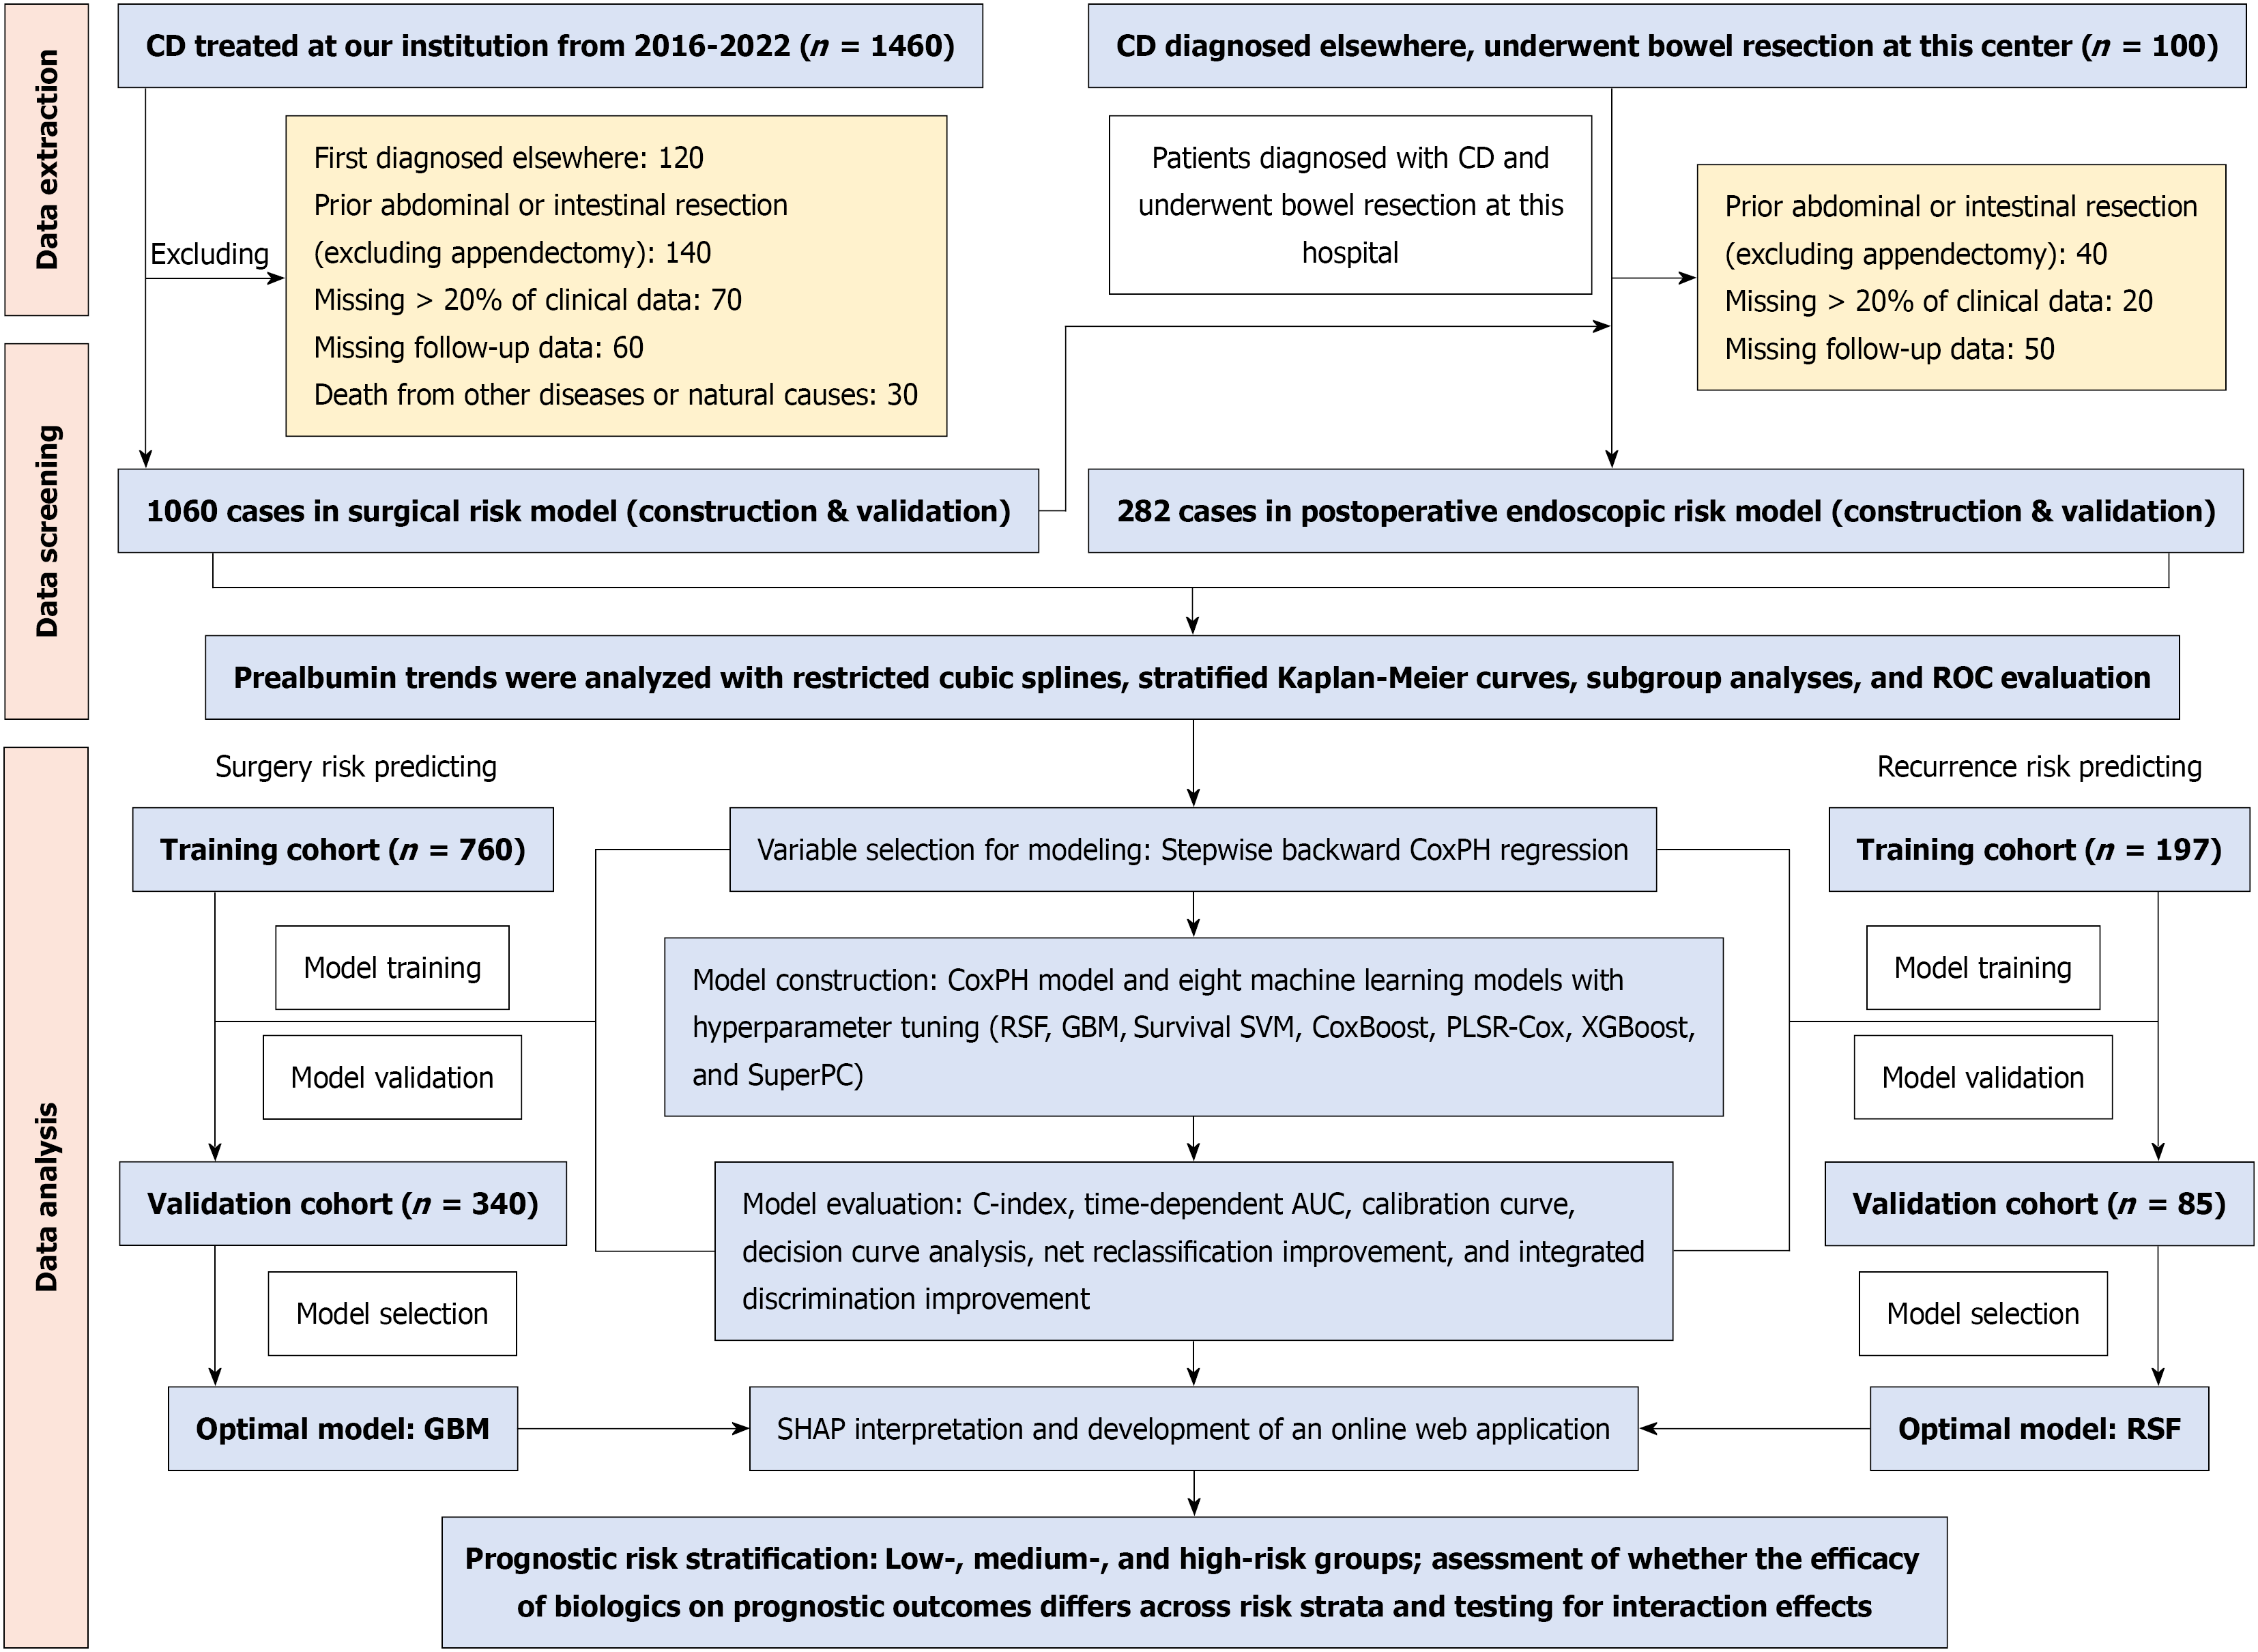
Figure 1 Flowchart for patient selection and data analysis.
CD: Crohn’s disease; ROC: Receiver operating characteristic; GBM: Gradient boosting machine; RSF: Random survival forest; SVM: Support vector machine; AUC: Area under the receiver operating characteristic curve; SHAP: SHapley Additive exPlanations; PLSR-Cox: Partial least squares regression for Cox models.
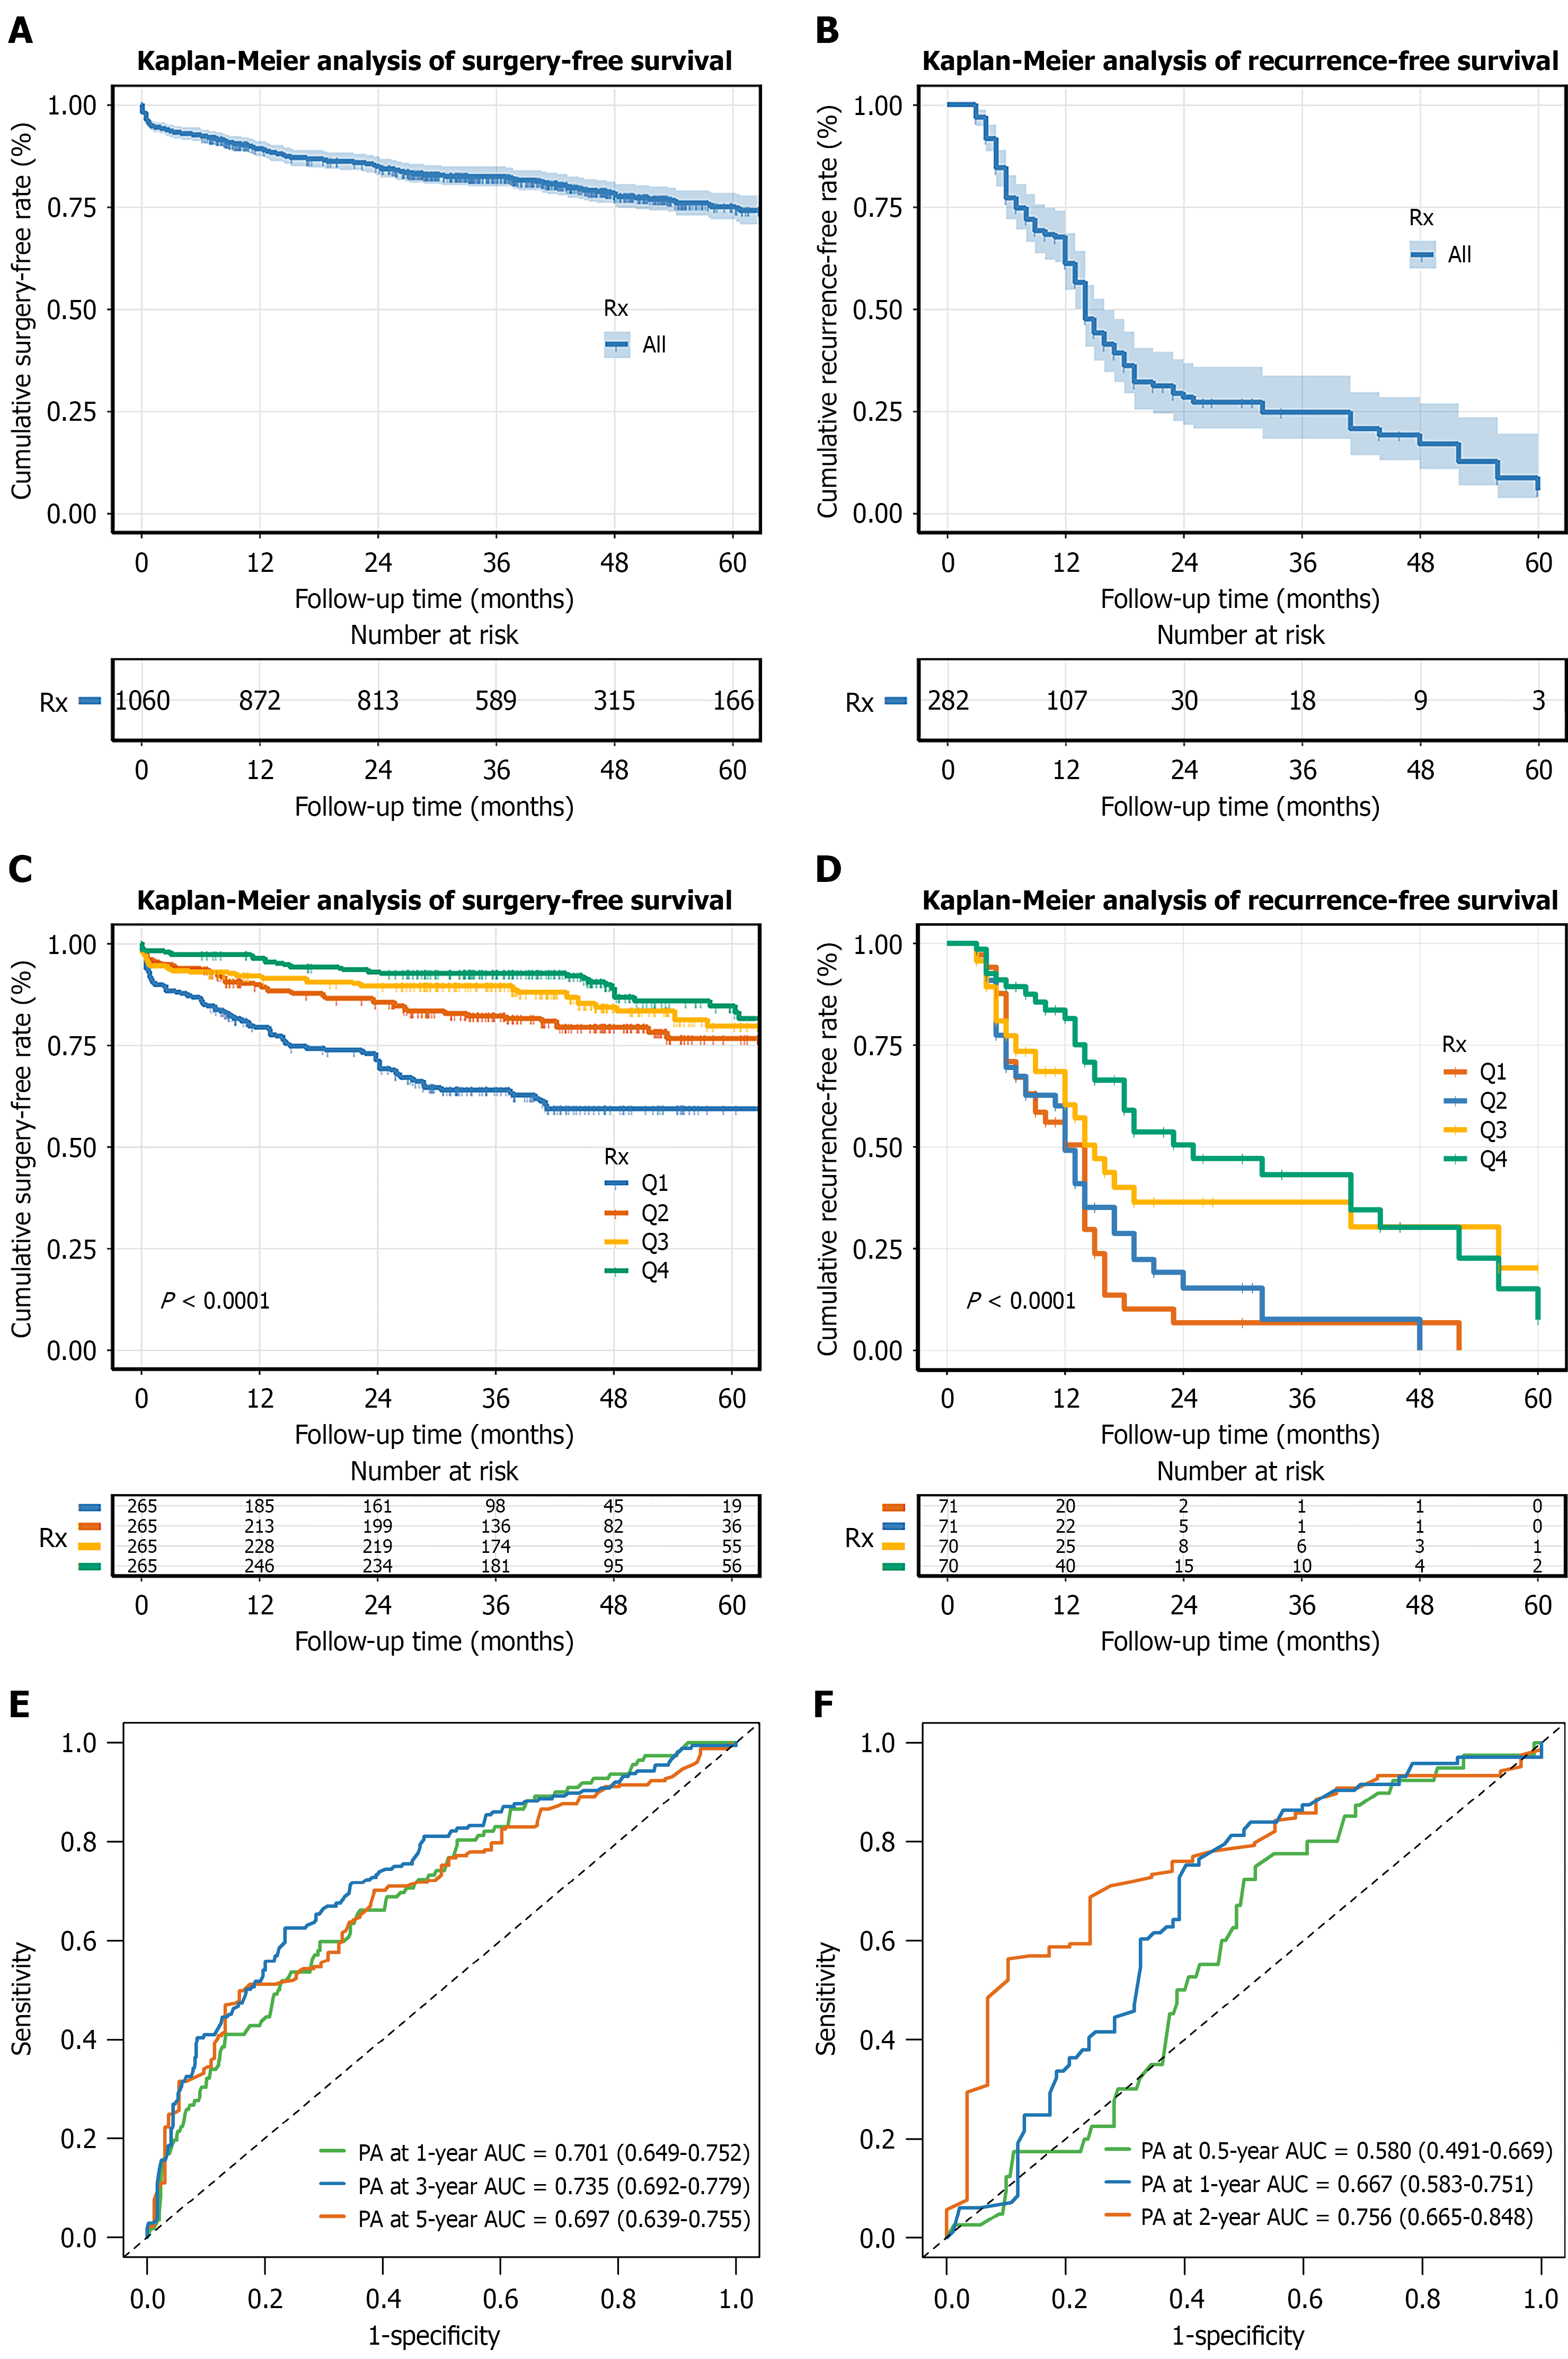
Figure 2 Kaplan-Meier and time-dependent receiver operating characteristic analyses of prealbumin for predicting abdominal surgery and postoperative endoscopic recurrence.
A: Kaplan-Meier curve for surgery-free survival in the newly diagnosed cohort; B: Kaplan-Meier curve for recurrence-free survival in the surgical cohort; C and D: Kaplan-Meier curves for surgery-free survival (C) and recurrence-free survival (D) stratified by baseline prealbumin quartiles; E and F: Time-dependent receiver operating characteristic curves of prealbumin for predicting abdominal surgery (E) and postoperative endoscopic recurrence (F). P values were calculated using the log-rank test. AUC: Area under the receiver operating characteristic curve; PA: Prealbumin.
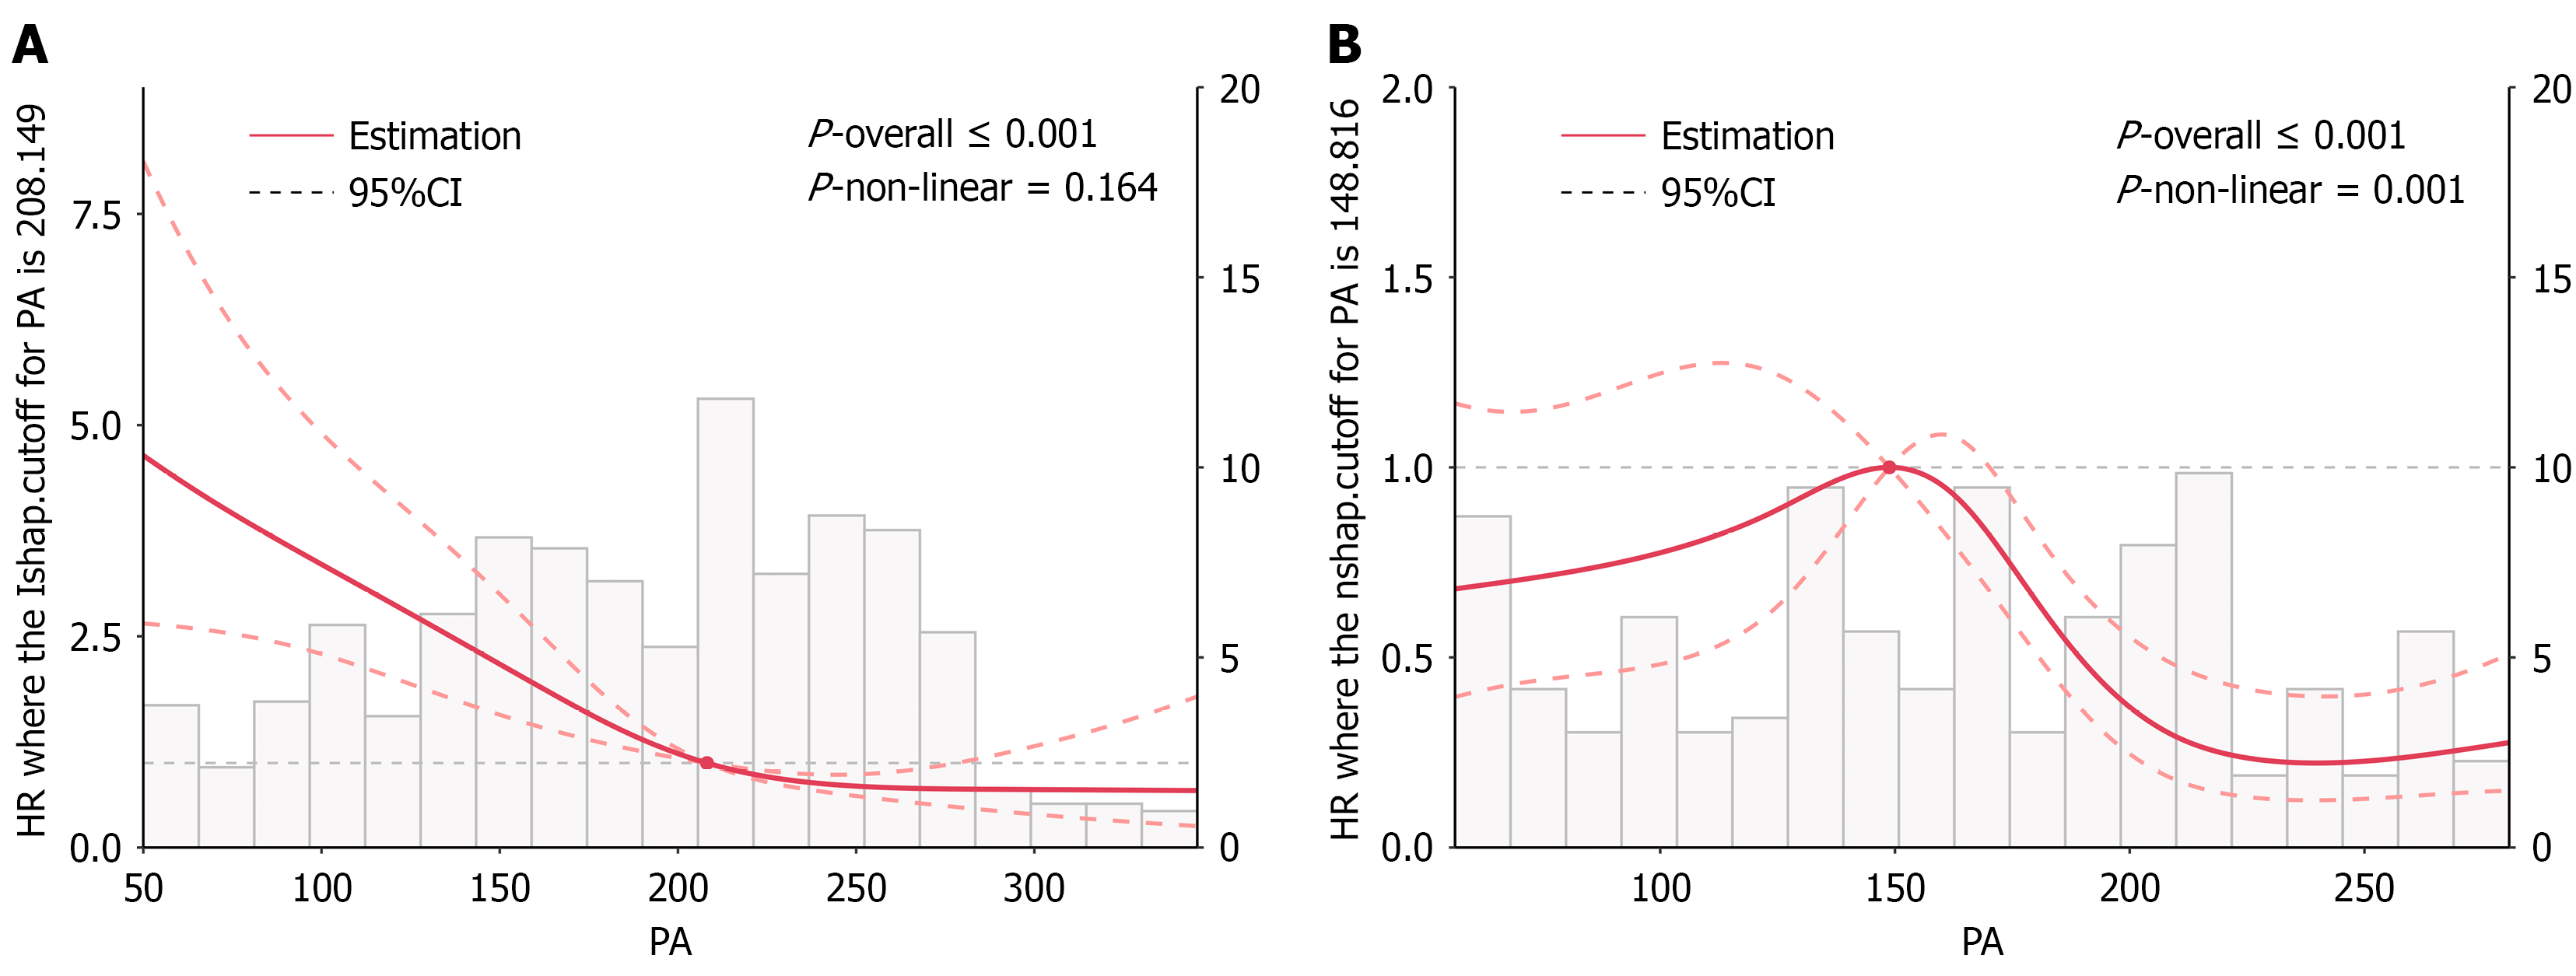
Figure 3 Restricted cubic spline analyses of the associations between prealbumin and clinical outcomes.
A: Association between prealbumin and the risk of abdominal surgery; B: Association between prealbumin and the risk of postoperative endoscopic recurrence. The solid lines represent the estimated associations, and the dashed lines indicate the 95% confidence intervals. HR: Hazard ratio; CI: Confidence interval; PA: Prealbumin.
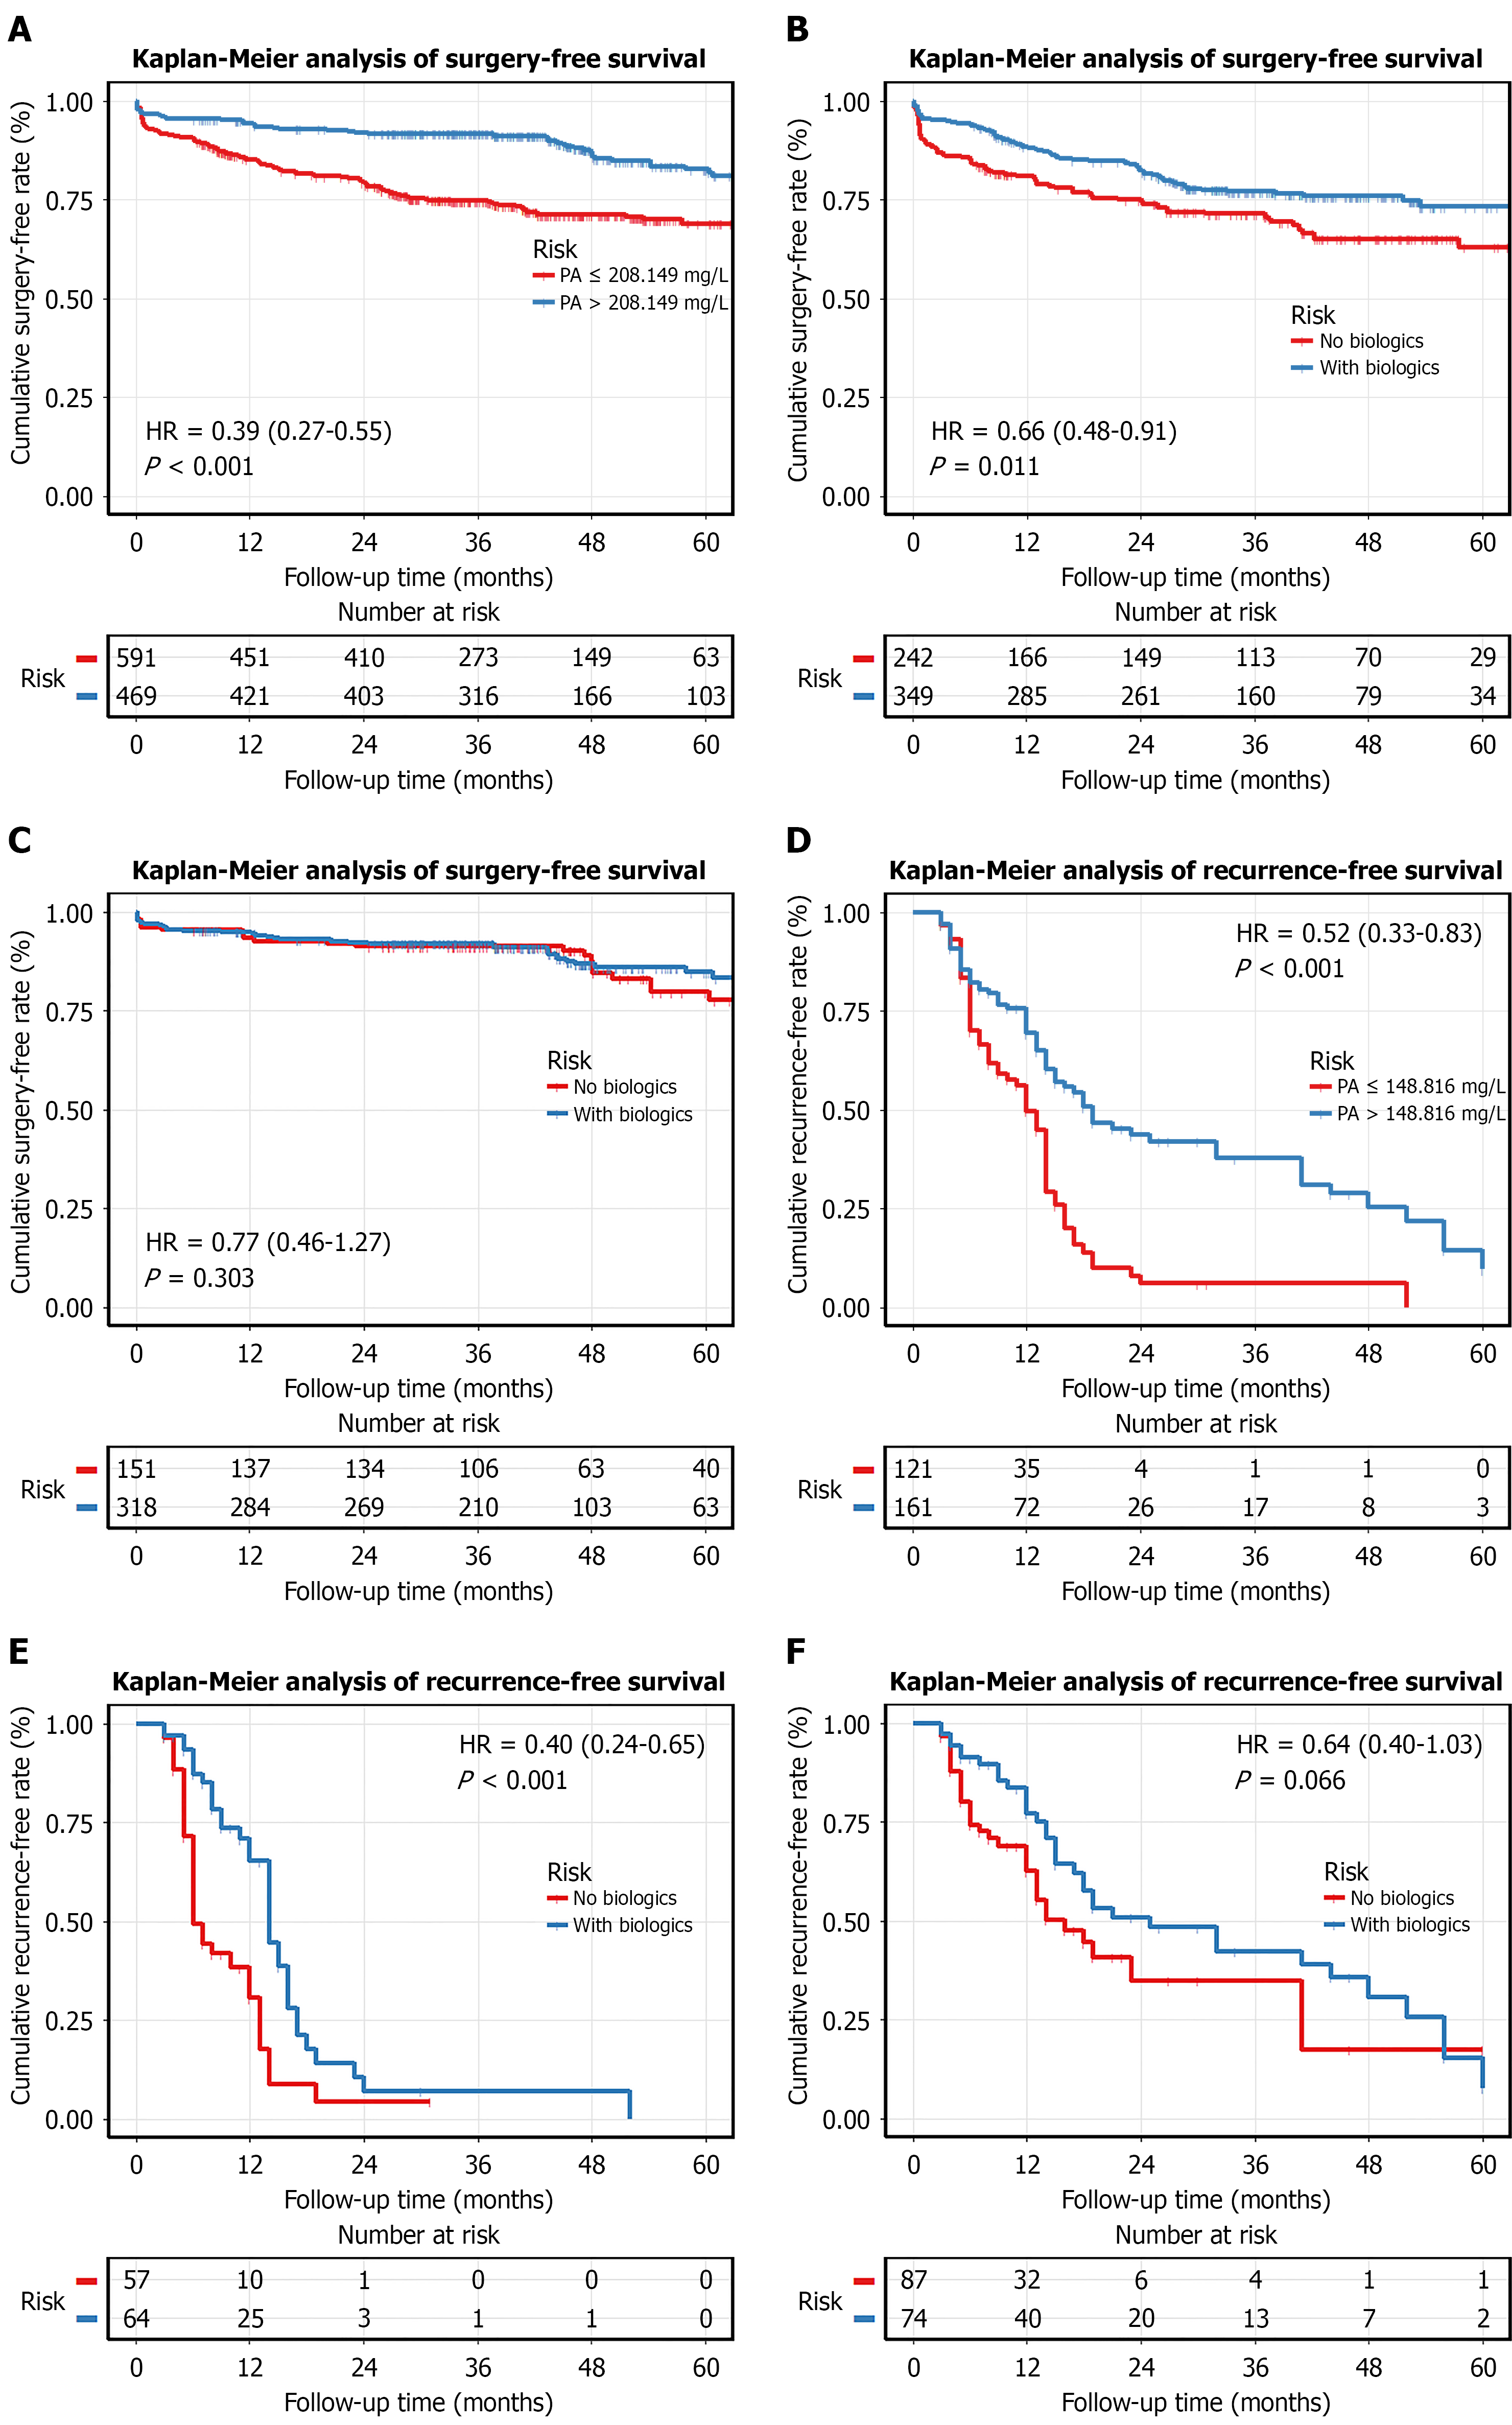
Figure 4 Clinical outcomes stratified by prealbumin thresholds.
A and B: Kaplan-Meier analyses of surgery-free survival according to the prealbumin (PA) threshold for abdominal surgery (A) and recurrence-free survival according to the PA threshold for postoperative endoscopic recurrence (B); C-F: Subgroup analyses of biologic therapy showing surgery-free survival in patients with PA ≤ 208.149 mg/L (C) and > 208.149 mg/L (D), and recurrence-free survival in patients with PA ≤ 148.816 mg/L (E) and > 148.816 mg/L (F). HR: Hazard ratio; PA: Prealbumin.
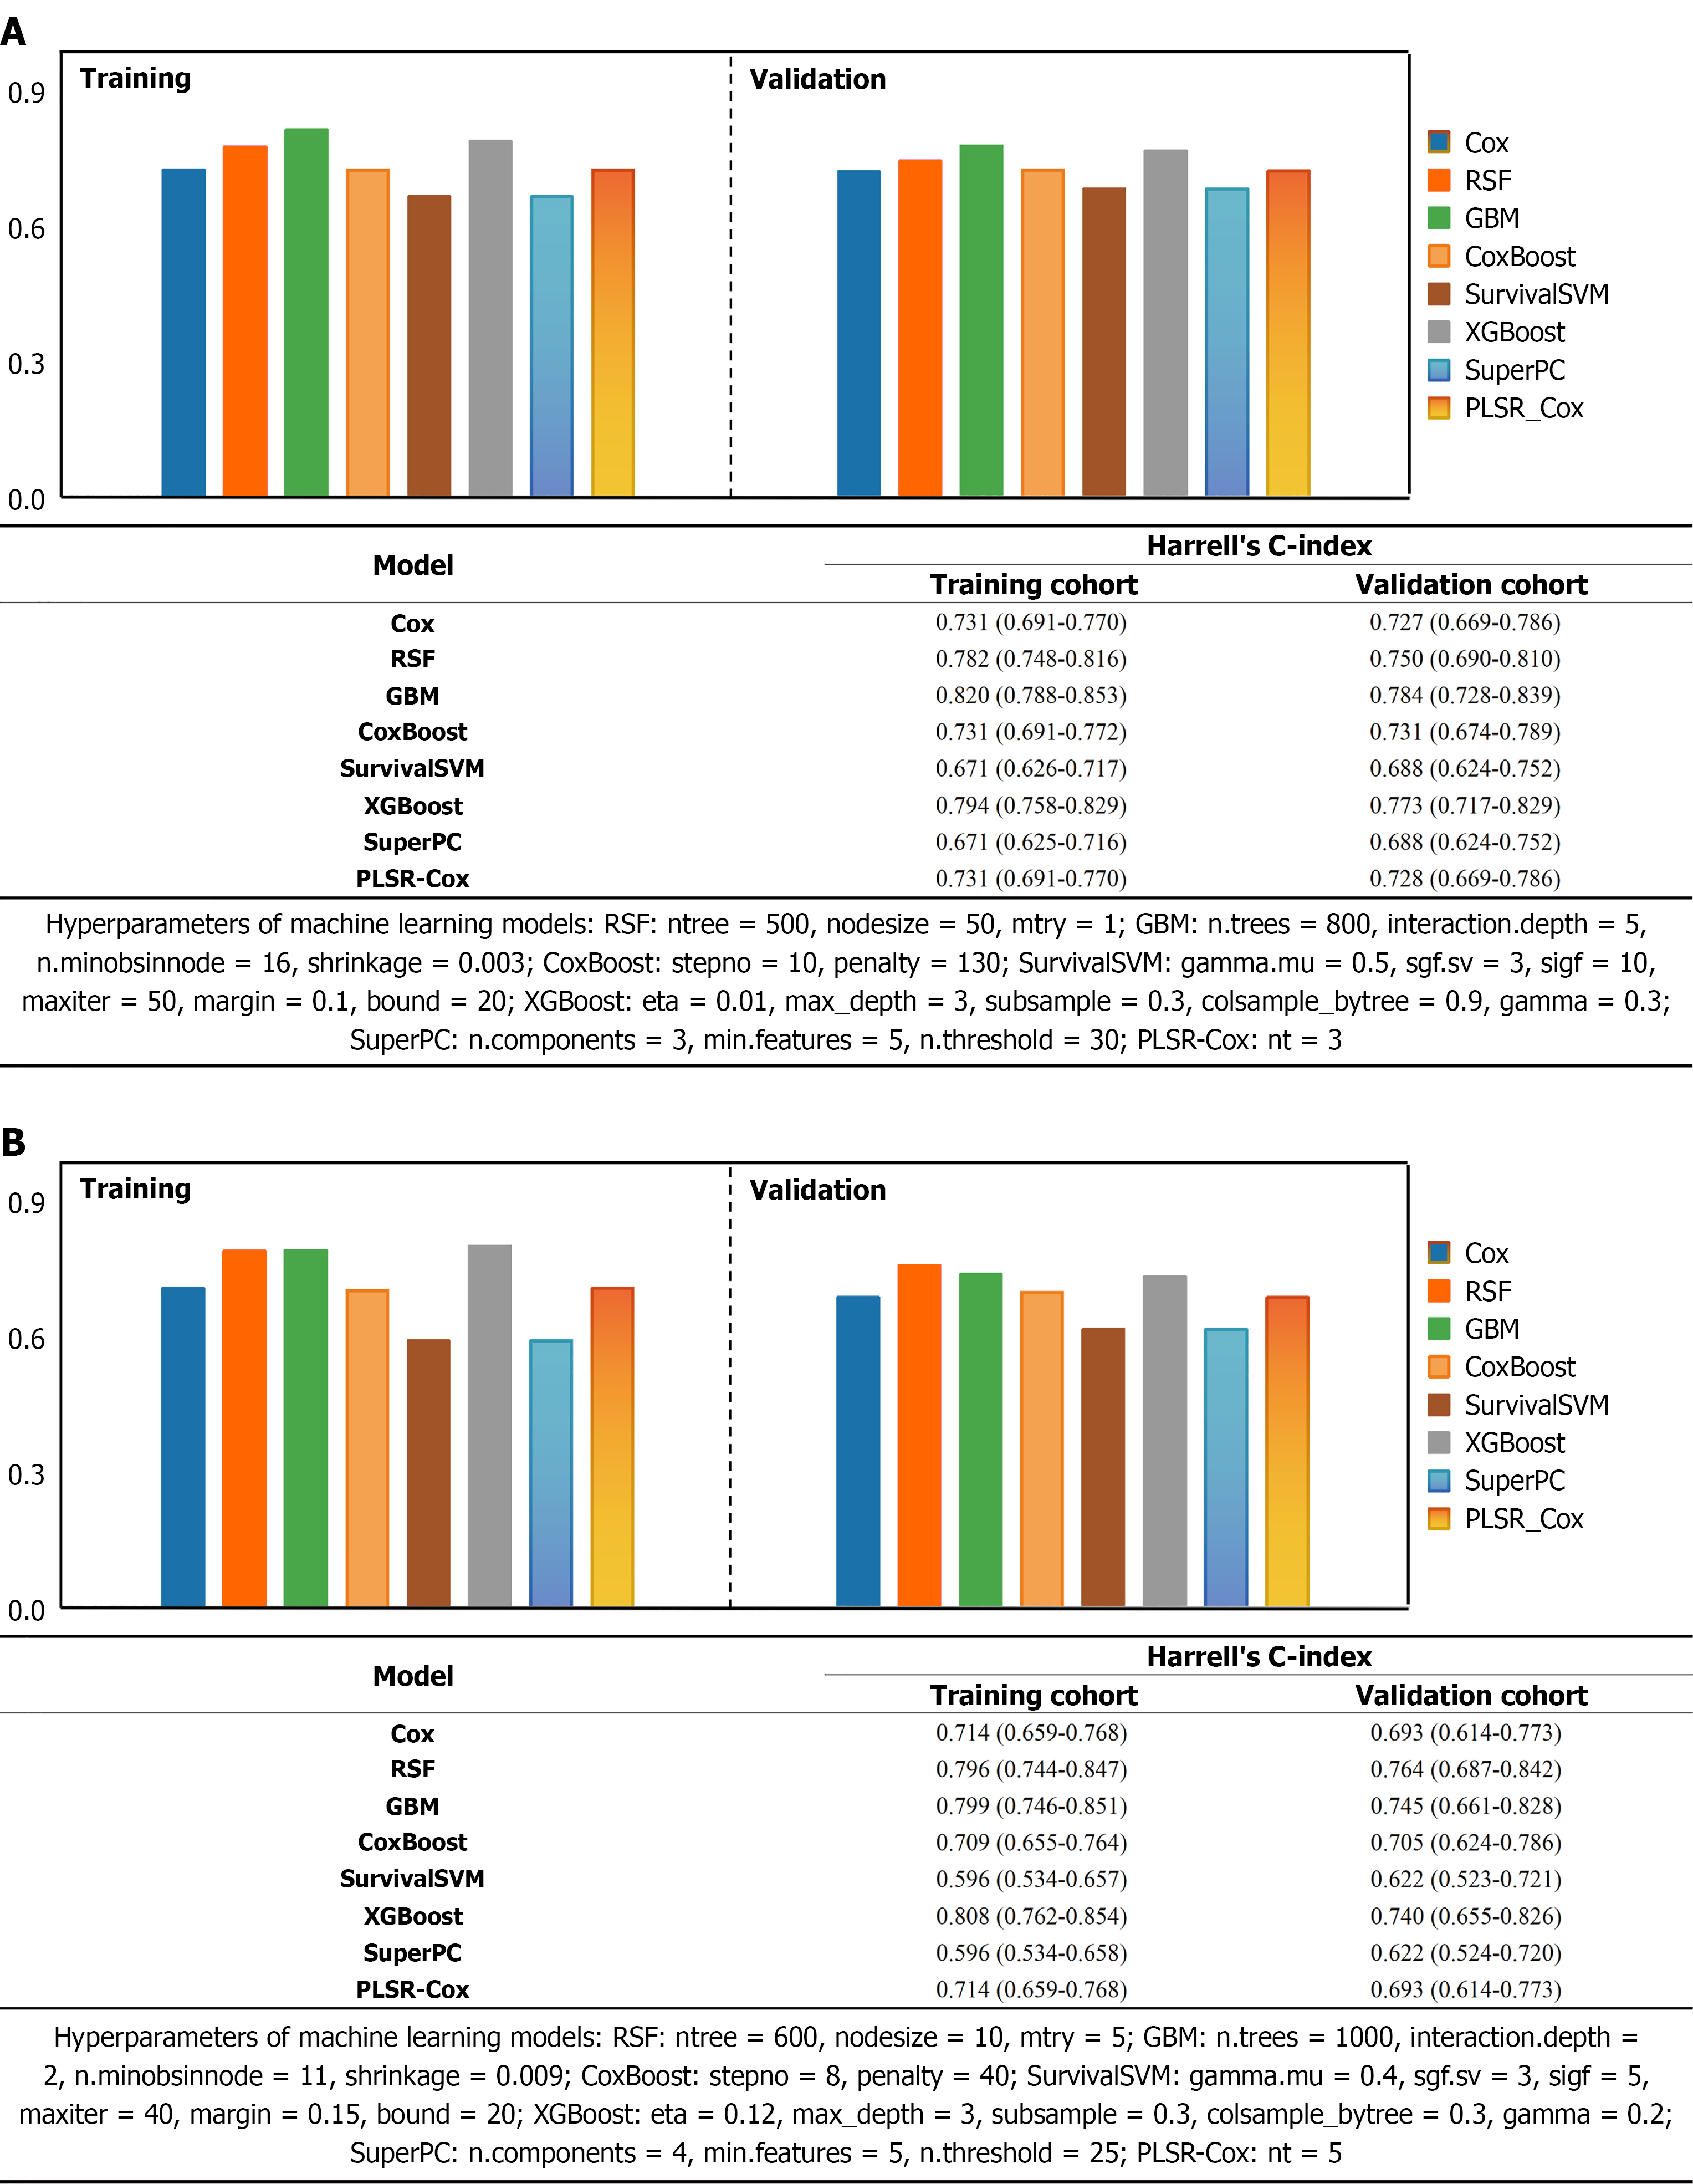
Figure 5 Comparison of the predictive performance of the eight models for abdominal surgery and postoperative endoscopic recurrence.
A: Harrell’s concordance index (C-index) of the eight models for predicting abdominal surgery in the training and validation cohorts; B: C-index of the eight models for predicting postoperative endoscopic recurrence in the training and validation cohorts. The evaluated models were Cox proportional hazards regression, random survival forest, gradient boosting machine, CoxBoost, survival support vector machine, XGBoost, SuperPC, and partial least squares regression for Cox models. RSF: Random survival forest; GBM: Gradient boosting machine; PLSR-Cox: Partial least squares regression for Cox models; SVM: Support vector machine.
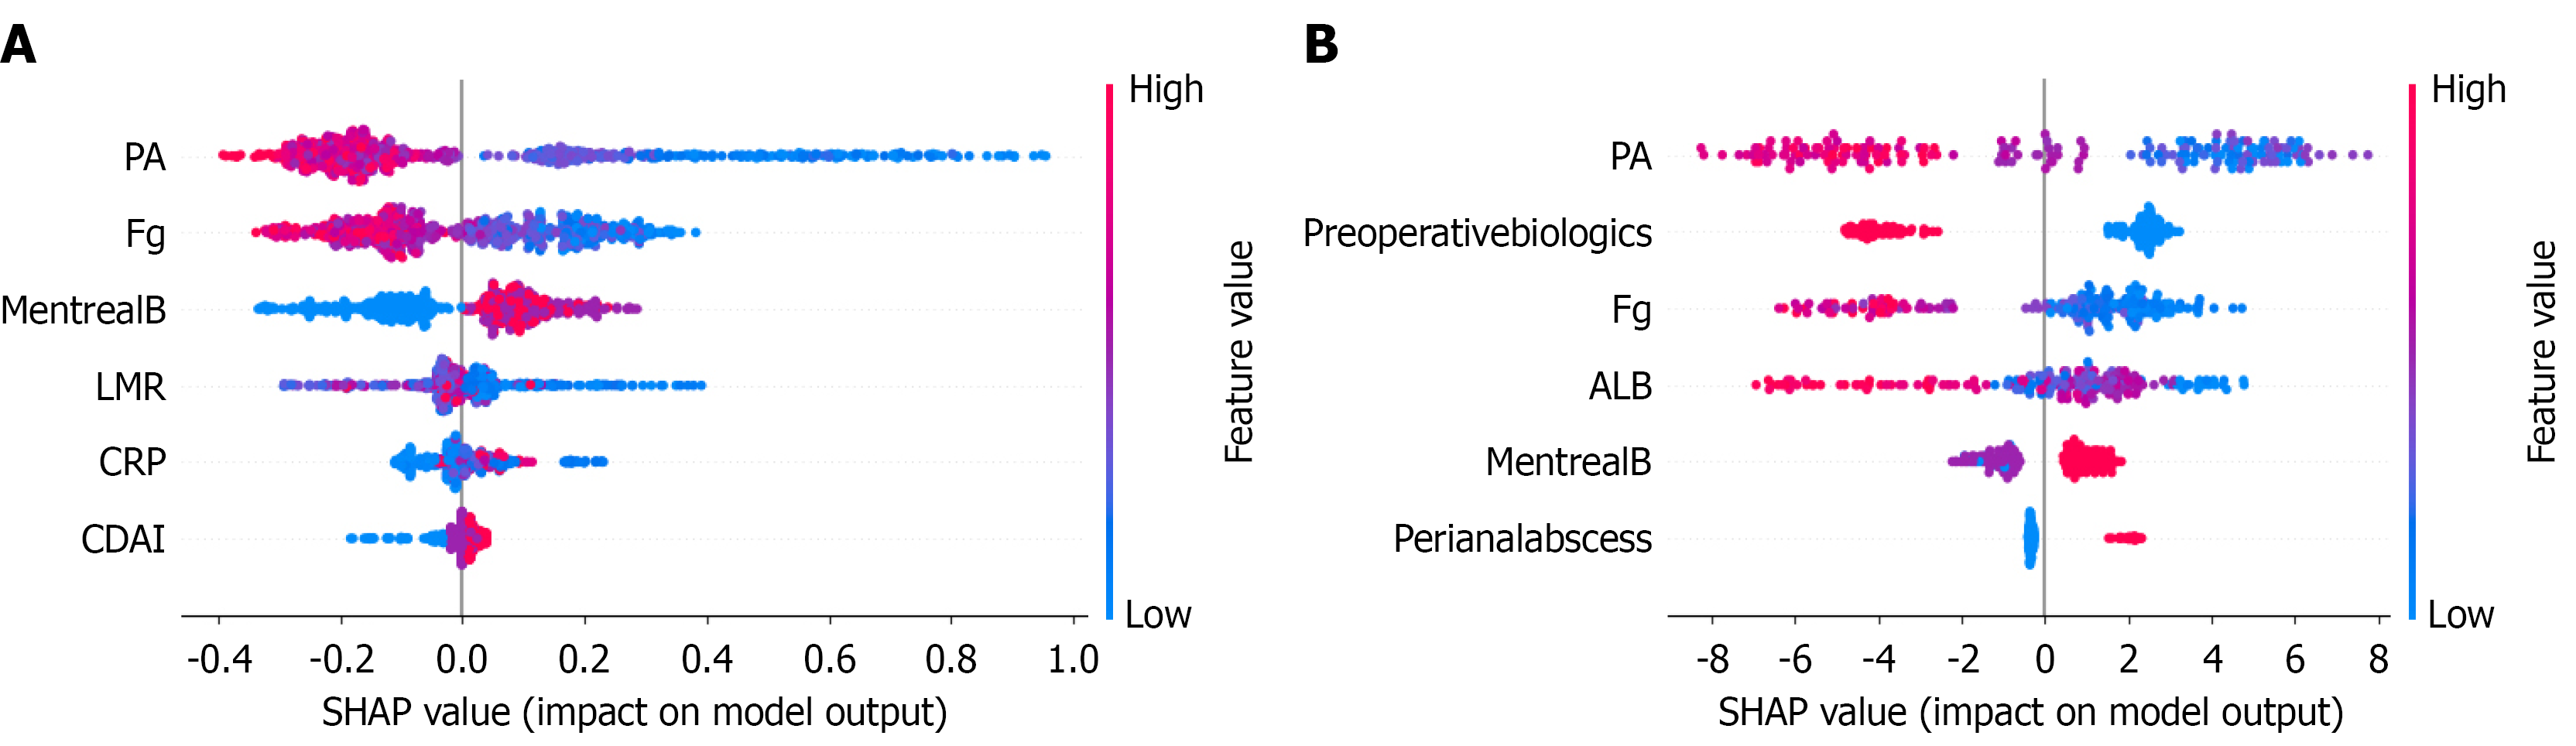
Figure 6 SHapley Additive exPlanations beeswarm plots.
A: The relative contributions of individual features to the overall prediction of abdominal surgery gradient boosting machine model; B: Postoperative endoscopic recurrence (random survival forest model). Fg: Fibrinogen; PA: Prealbumin; CDAI: Crohn’s Disease Activity Index; LMR: Lymphocyte-to-monocyte ratio; CRP: C-reactive protein; ALB: Albumin; SHAP: SHapley Additive exPlanations.
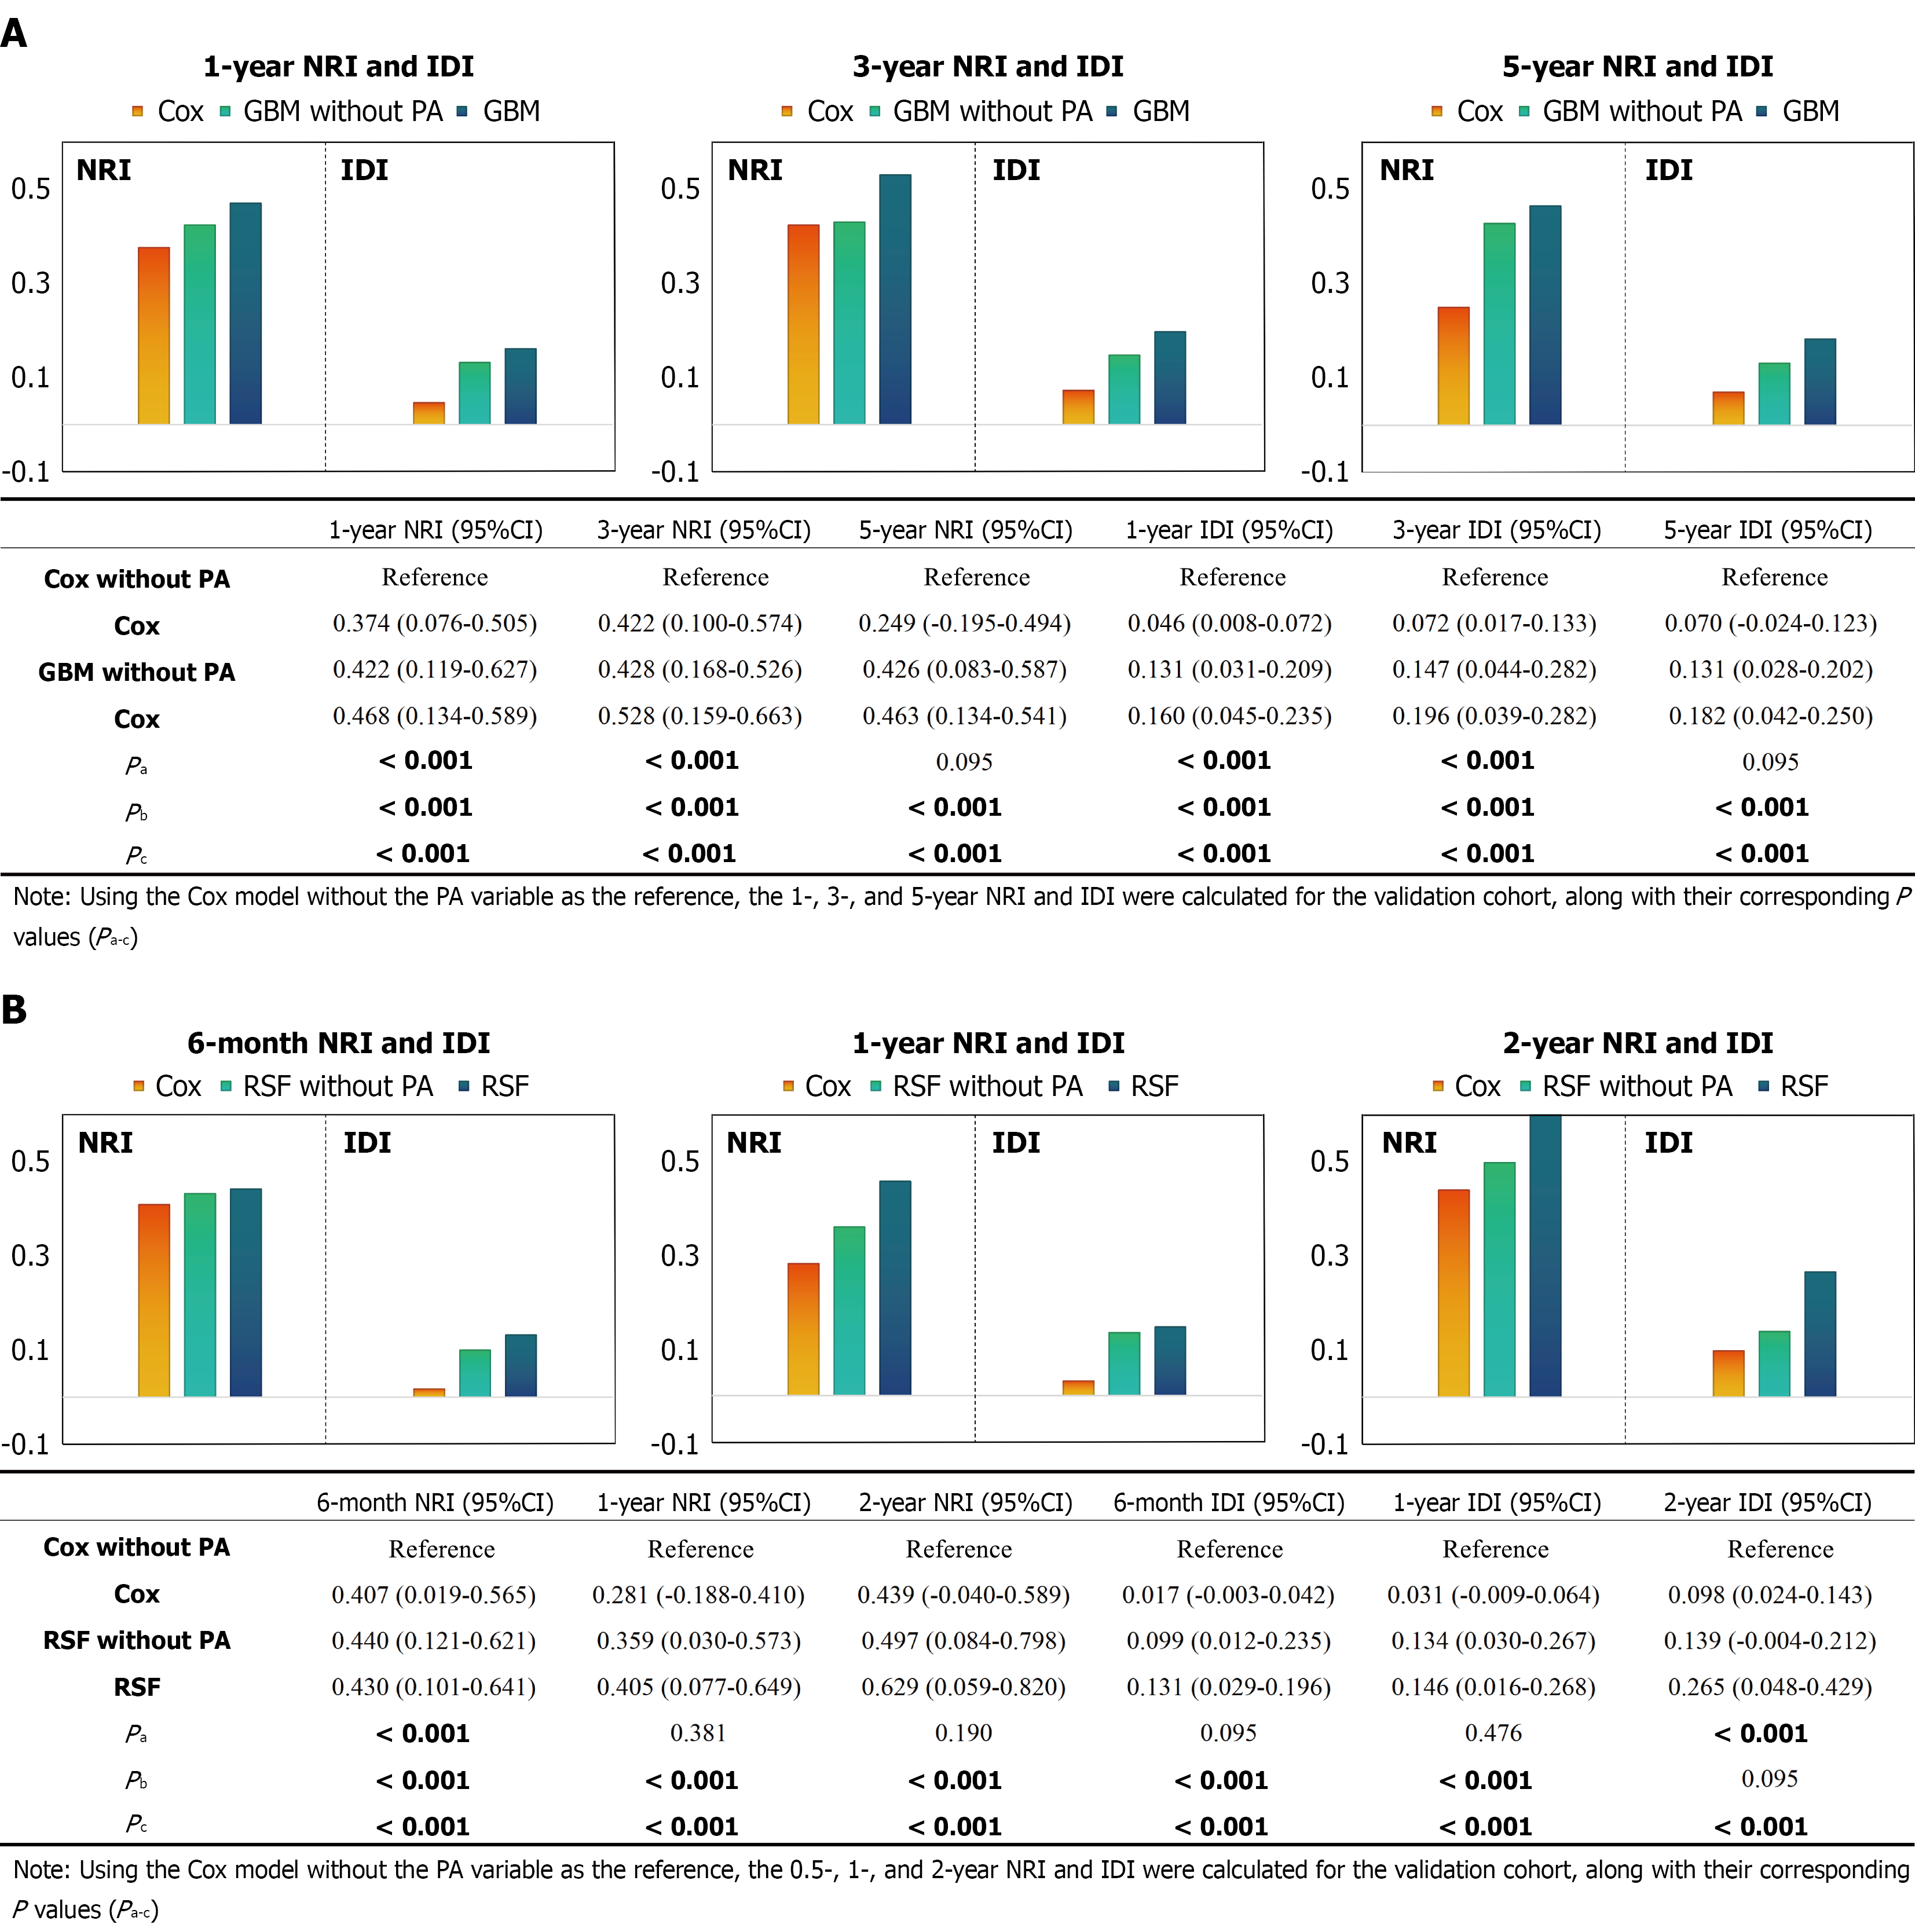
Figure 7 Incremental contribution of prealbumin to the predictive performance of the models in the validation cohort.
Net reclassification improvement and integrated discrimination improvement were used to evaluate the added predictive value of prealbumin in the models with and without prealbumin. A: Abdominal surgery; B: Postoperative endoscopic recurrence. NRI: Net reclassification improvement; IDI: Integrated discrimination improvement; PA: Prealbumin; GBM: Gradient boosting machine; CI: Confidence interval.
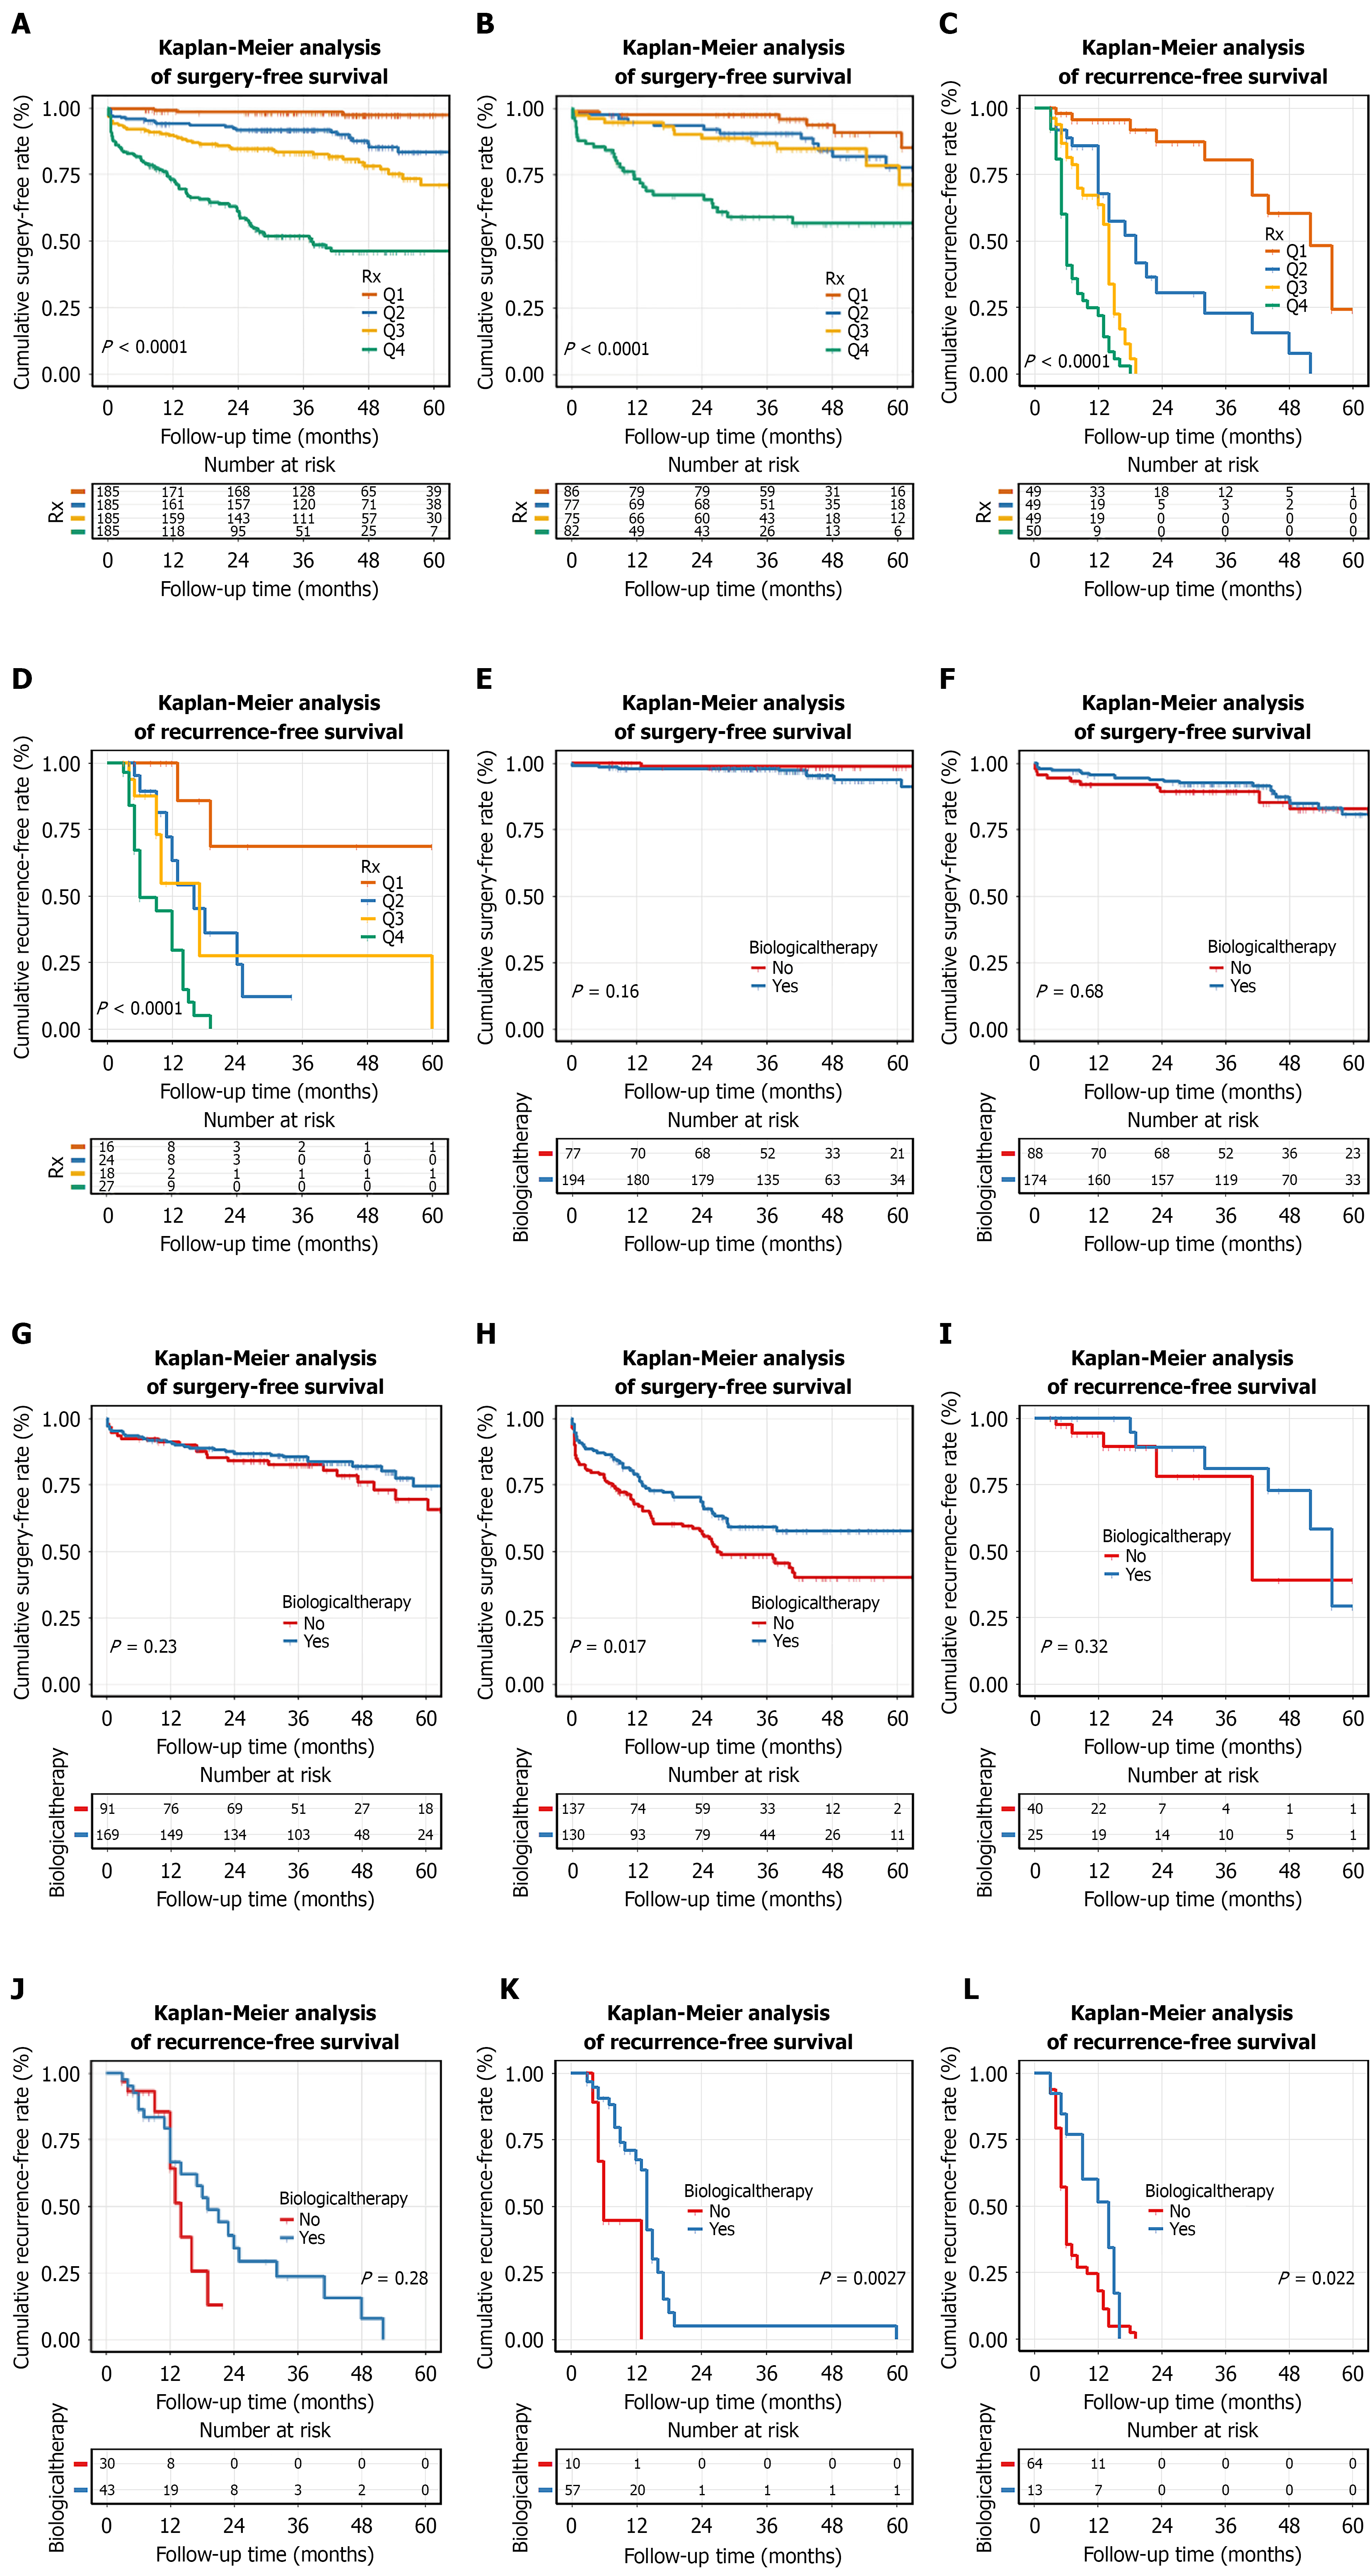
Figure 8 Kaplan-Meier analyses of model-based risk stratification and the association of biologic therapy with the disease outcomes.
A and B: Kaplan-Meier curves for abdominal surgery according to quartiles of the gradient boosting machine-derived risk score in the training (A) and validation (B) cohorts; C and D: Kaplan-Meier curves for postoperative endoscopic recurrence according to quartiles of the random survival forest-derived risk score in the training (C) and validation (D) cohorts. Q1 to Q4 represent increasing model-predicted risk; E-H: Kaplan-Meier curves showing the association between biologic therapy and abdominal surgery within each gradient boosting machine-defined risk quartile: Q1 (E), Q2 (F), Q3 (G), and Q4 (H); I-L: Kaplan-Meier curves showing the association between biologic therapy and postoperative endoscopic recurrence within each random survival forest-defined risk quartile: Q1 (I), Q2 (J), Q3 (K), and Q4 (L). P values were calculated using the log-rank test.
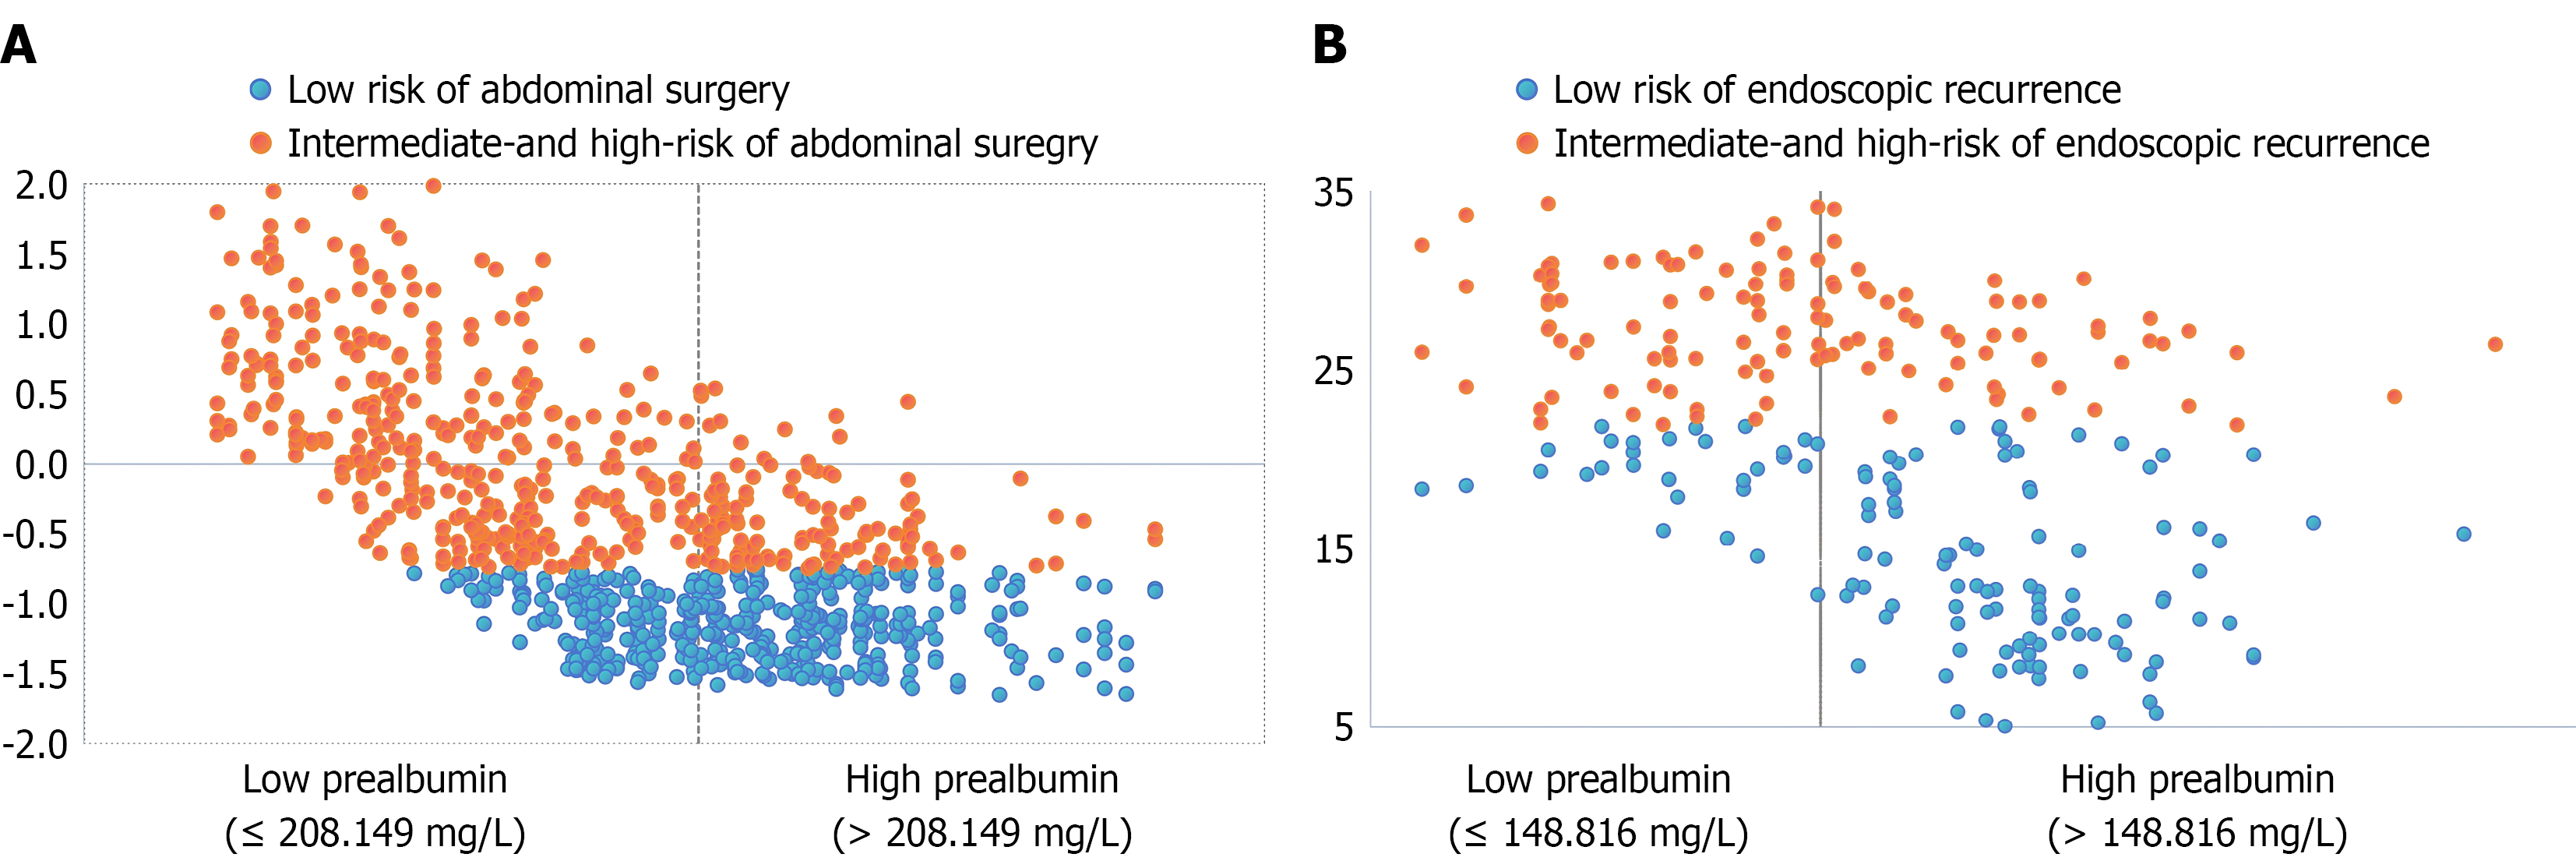
Figure 9 Association between prealbumin and the risk scores based on the machine learning models.
A: Surgery; B: Endoscopic recurrence.
- Citation: Xie KL, Long G, Yuan LW, Zhang D. Association of prealbumin with risk of abdominal surgery and endoscopic recurrence in Crohn’s disease: A machine learning study. World J Gastroenterol 2026; 32(36): 119629
- URL: https://www.wjgnet.com/1007-9327/full/v32/i36/119629.htm
- DOI: https://dx.doi.org/10.3748/wjg.119629