
















Copyright: ©Author(s) 2026.
World J Gastroenterol. Sep 28, 2026; 32(36): 119629
Published online Sep 28, 2026. doi: 10.3748/wjg.119629
Published online Sep 28, 2026. doi: 10.3748/wjg.119629
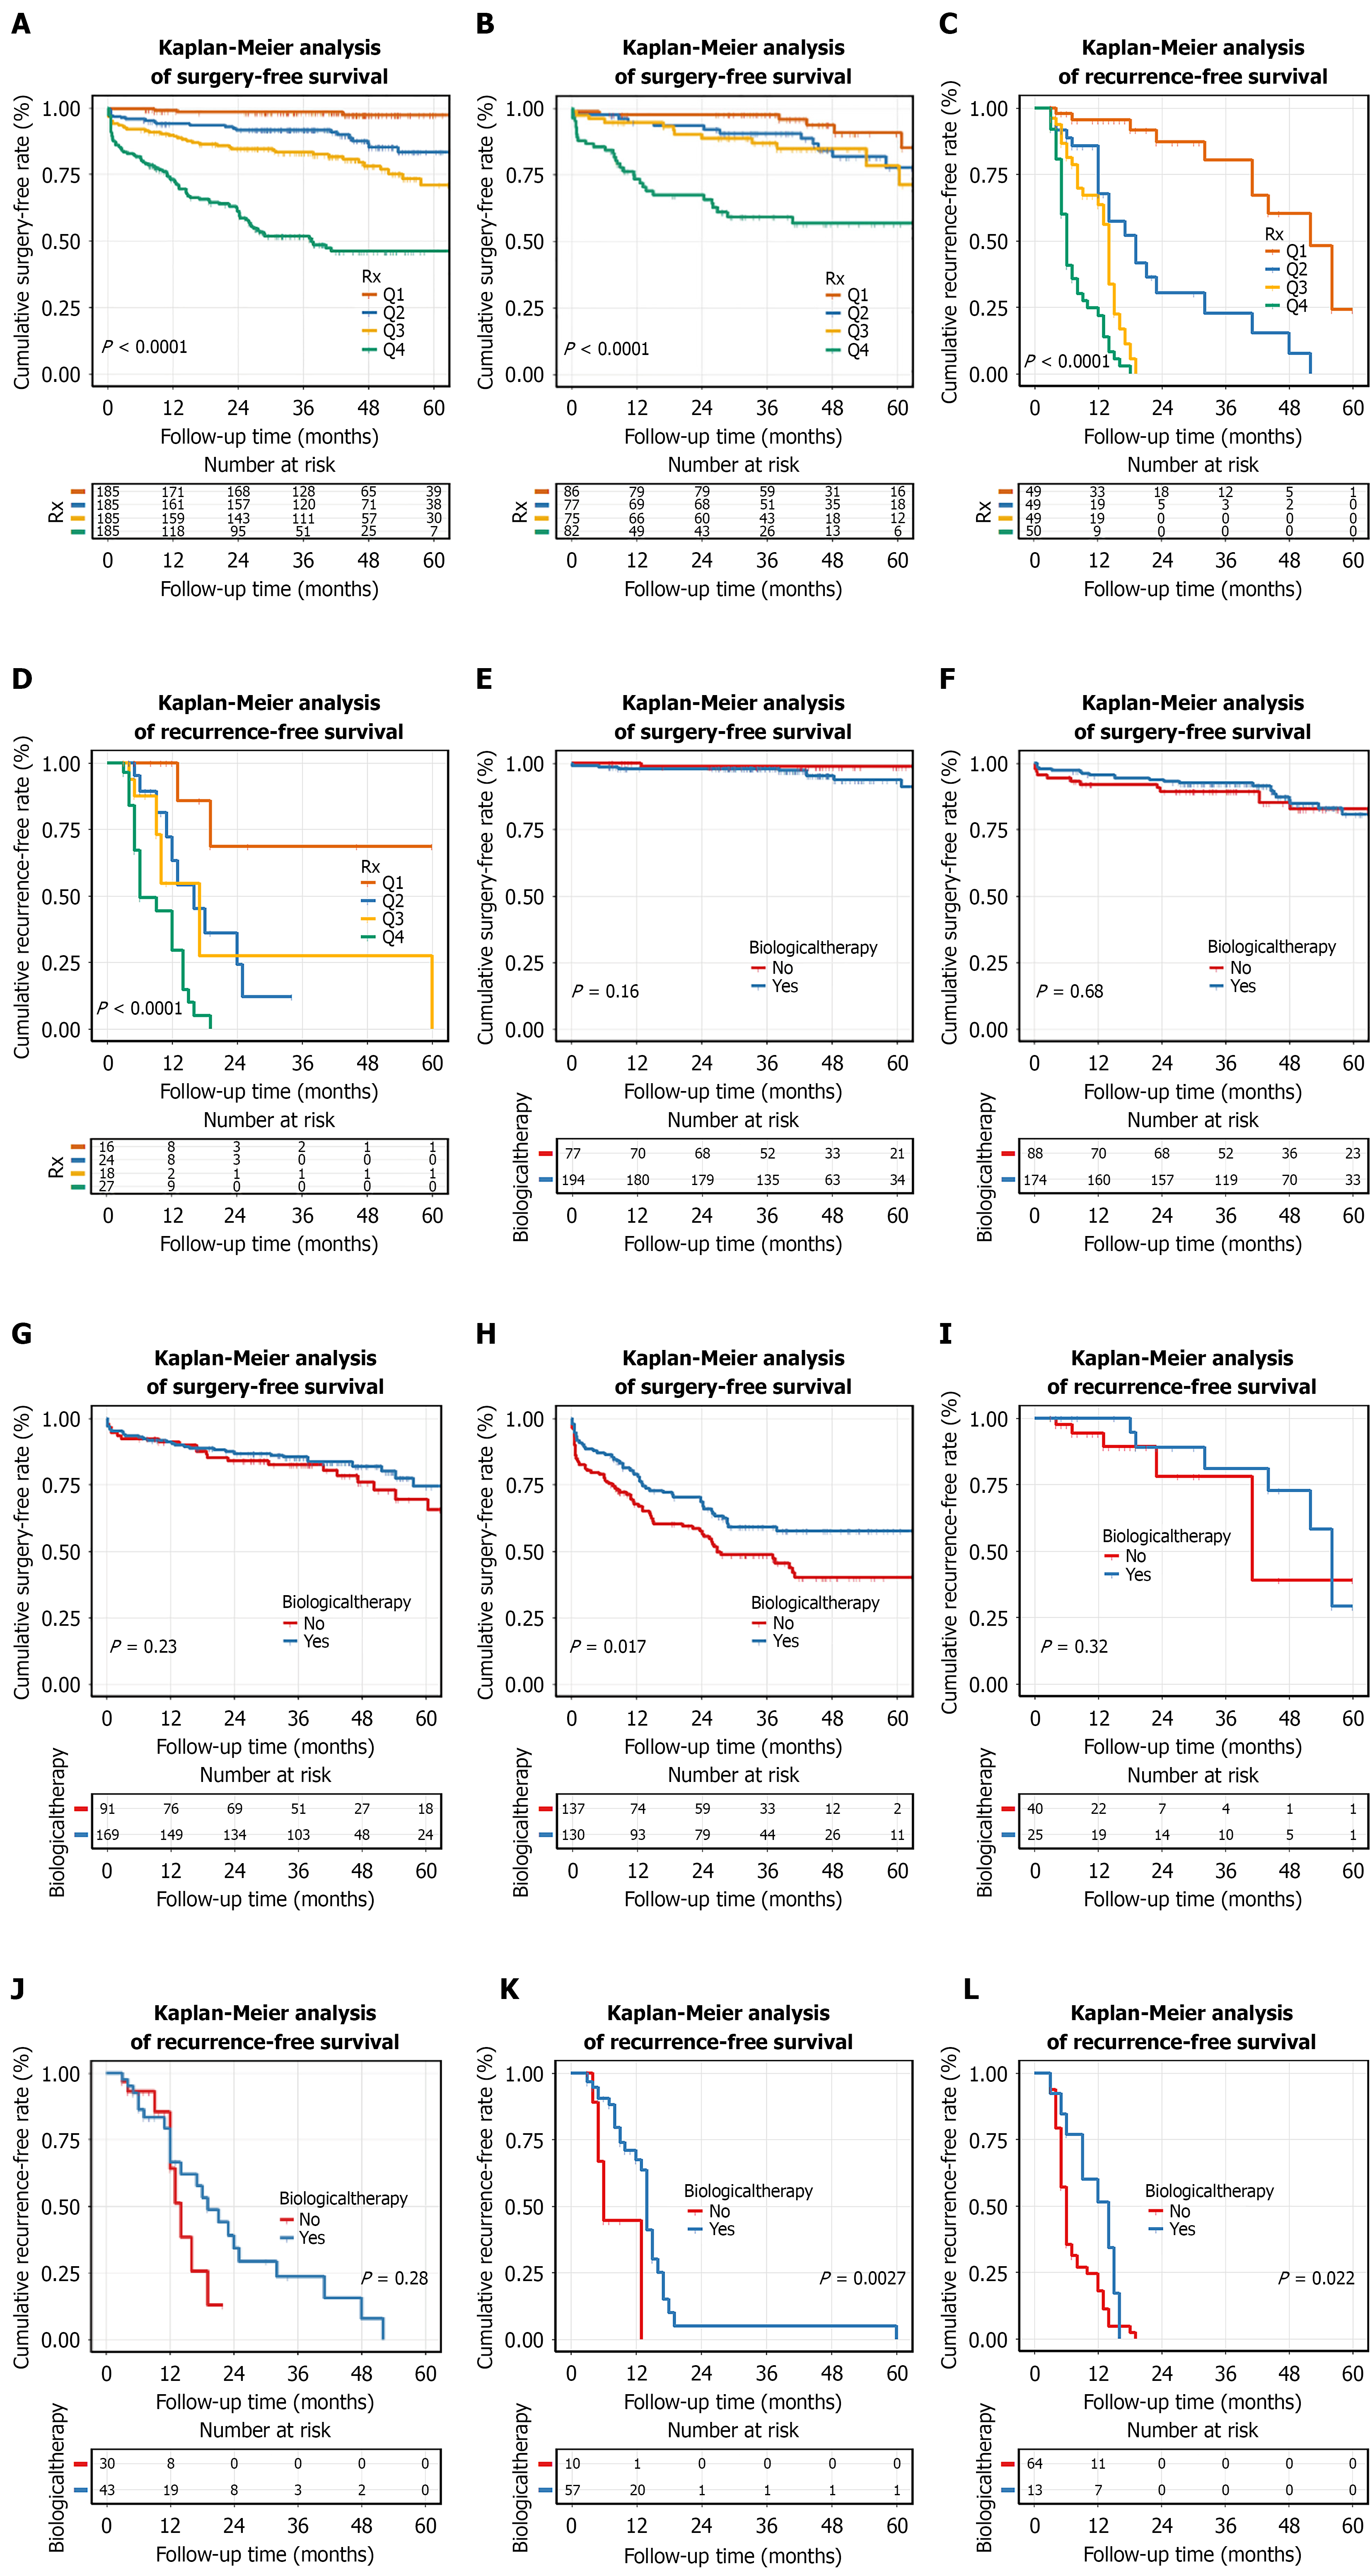
Figure 8 Kaplan-Meier analyses of model-based risk stratification and the association of biologic therapy with the disease outcomes.
A and B: Kaplan-Meier curves for abdominal surgery according to quartiles of the gradient boosting machine-derived risk score in the training (A) and validation (B) cohorts; C and D: Kaplan-Meier curves for postoperative endoscopic recurrence according to quartiles of the random survival forest-derived risk score in the training (C) and validation (D) cohorts. Q1 to Q4 represent increasing model-predicted risk; E-H: Kaplan-Meier curves showing the association between biologic therapy and abdominal surgery within each gradient boosting machine-defined risk quartile: Q1 (E), Q2 (F), Q3 (G), and Q4 (H); I-L: Kaplan-Meier curves showing the association between biologic therapy and postoperative endoscopic recurrence within each random survival forest-defined risk quartile: Q1 (I), Q2 (J), Q3 (K), and Q4 (L). P values were calculated using the log-rank test.
- Citation: Xie KL, Long G, Yuan LW, Zhang D. Association of prealbumin with risk of abdominal surgery and endoscopic recurrence in Crohn’s disease: A machine learning study. World J Gastroenterol 2026; 32(36): 119629
- URL: https://www.wjgnet.com/1007-9327/full/v32/i36/119629.htm
- DOI: https://dx.doi.org/10.3748/wjg.119629