Copyright
©The Author(s) 2024.
World J Gastroenterol. Feb 14, 2024; 30(6): 565-578
Published online Feb 14, 2024. doi: 10.3748/wjg.v30.i6.565
Published online Feb 14, 2024. doi: 10.3748/wjg.v30.i6.565
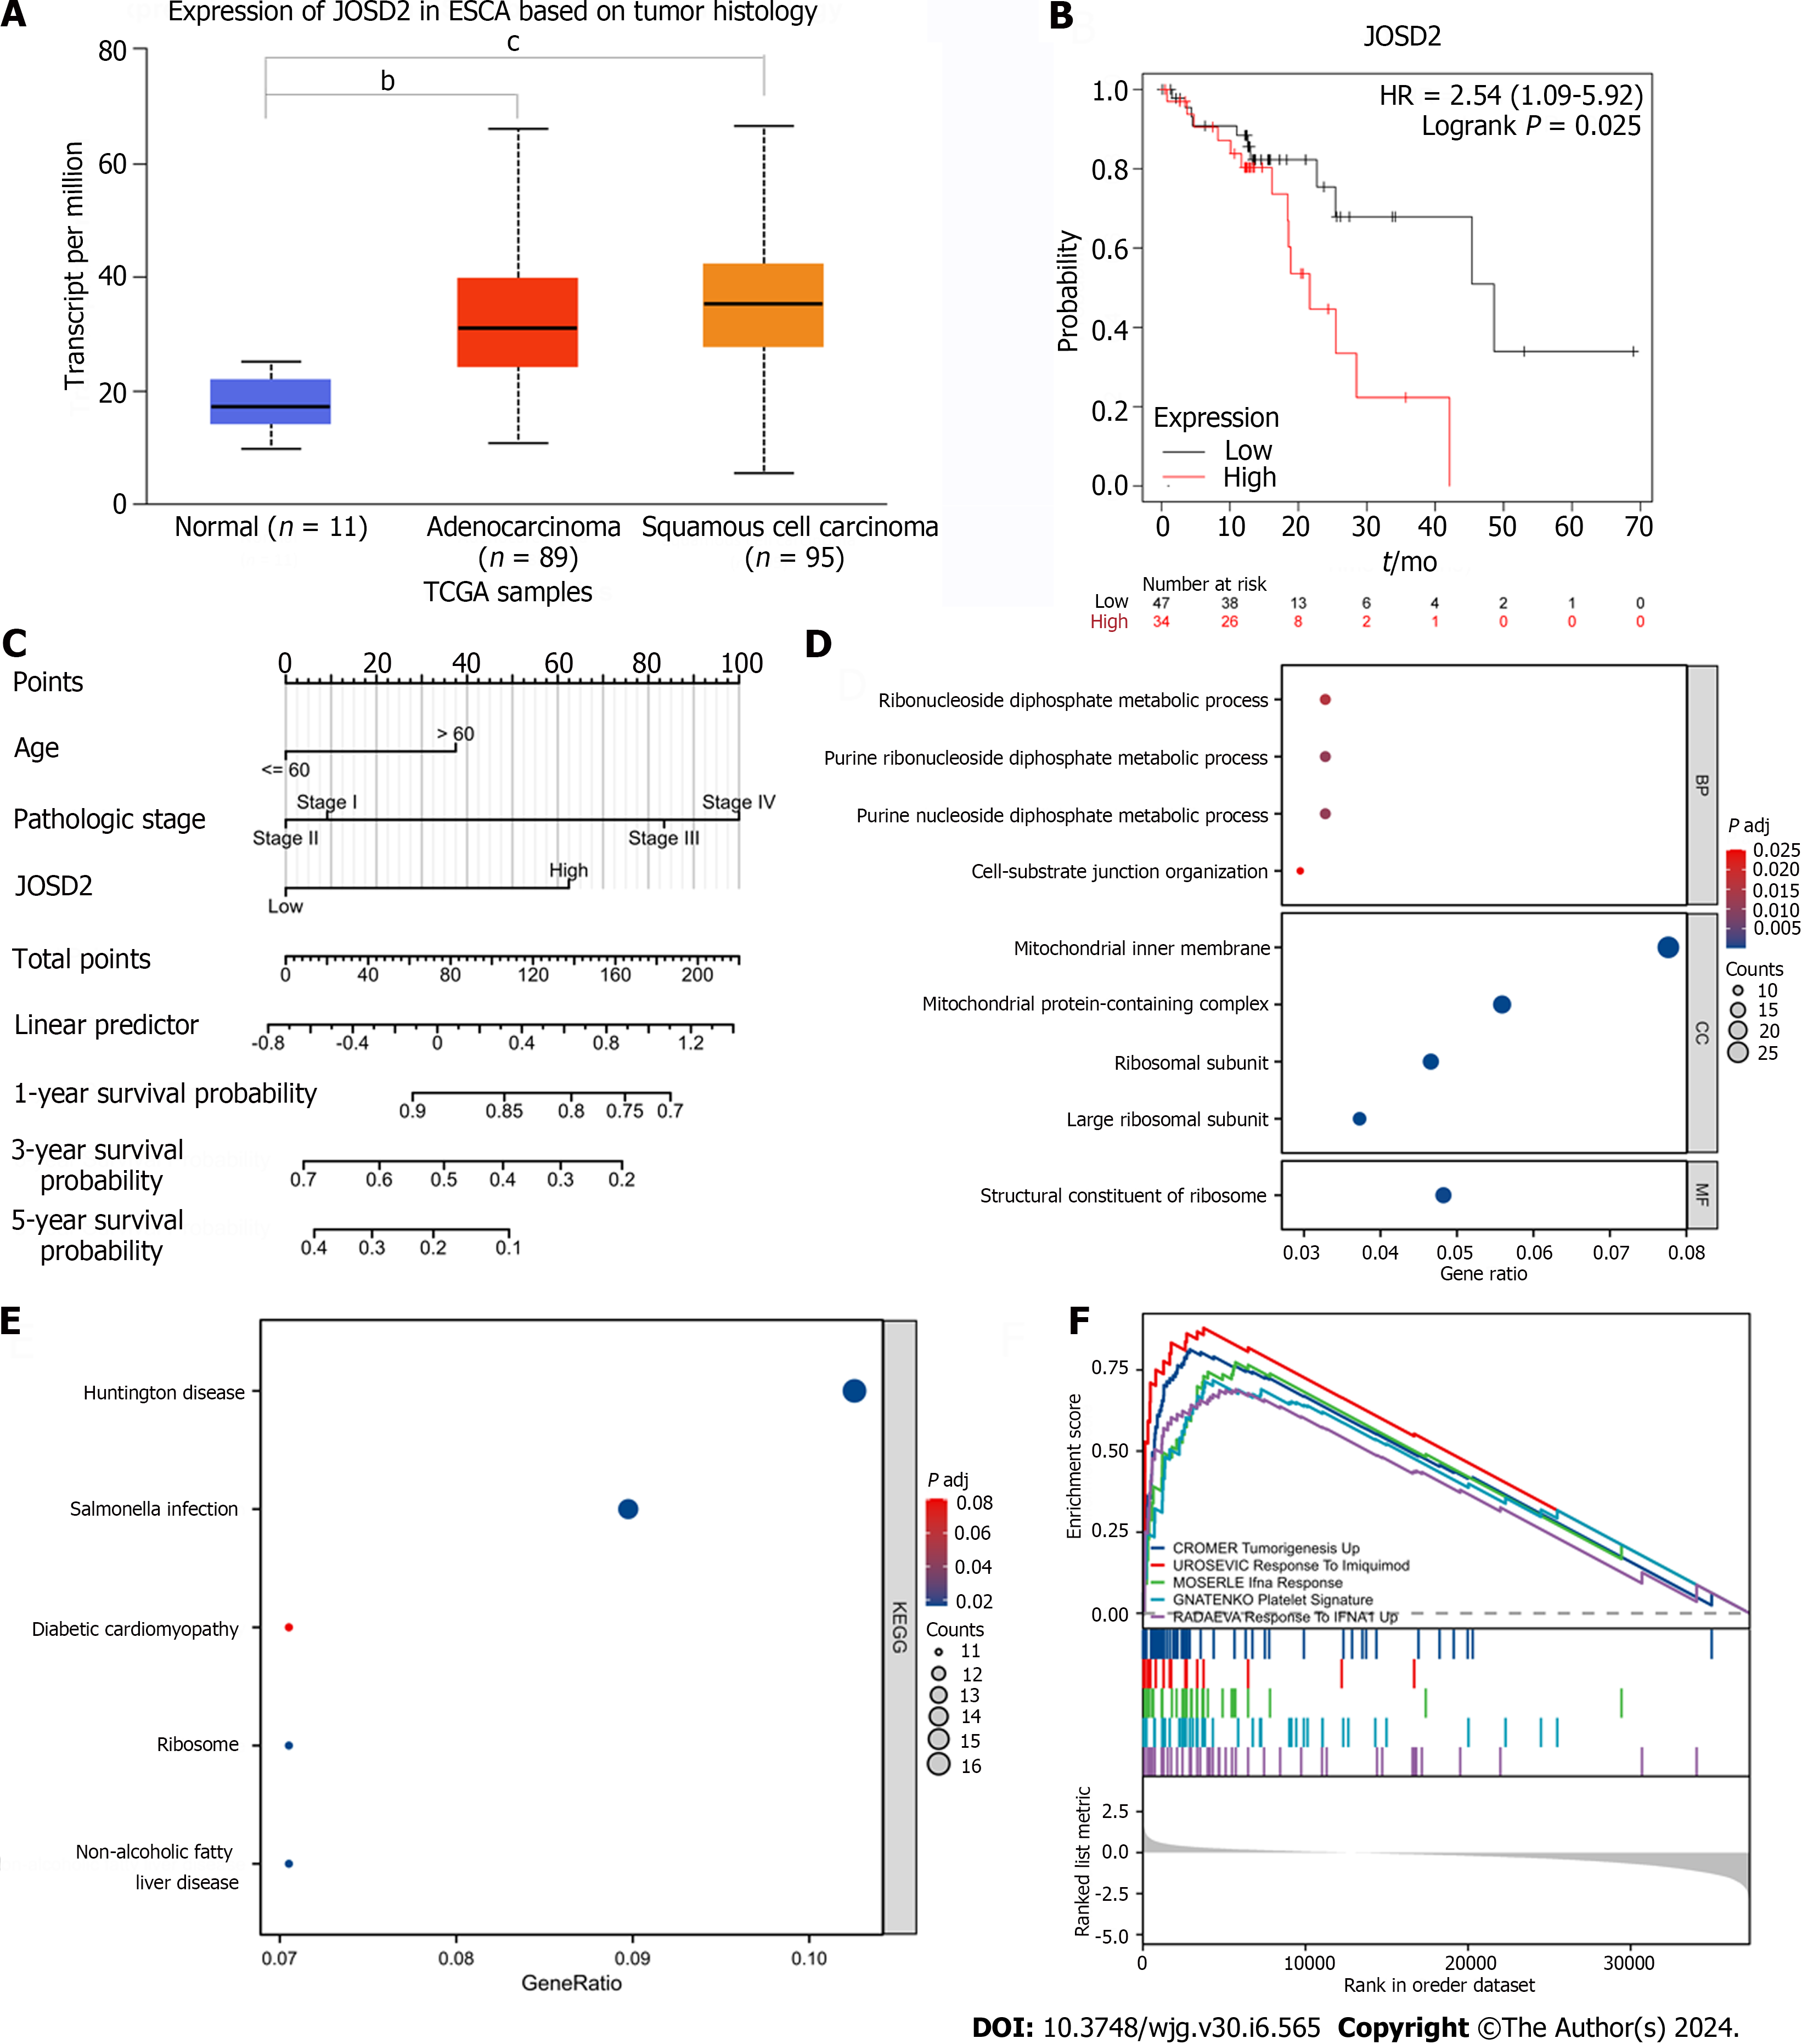
Figure 1 Expression level, survival analysis, and enrichment analyses of JOSD2 in esophageal squamous cell carcinoma tissues.
A: Boxplots of JOSD2 expression in esophageal squamous cell carcinoma (ESCC) tissues and normal esophageal tissues based on University of Alabama at Birmingham CANcer database; B: Kaplan-Meier plot showing the survival difference between ESCC patients with high vs low JOSD2 expression based on the Kaplan-Meier Plotter database; C: Nomogram of JOSD2 expression predicting 1-, 3- and 5-year survival probability of ESCC patients; D-F: Gene Ontology (D), Kyoto Encyclopedia of Genes and Genomes (E) and Gene Set Enrichment Analysis (F) enrichment analyses of JOSD2. bP < 0.001; cP < 0.0001.
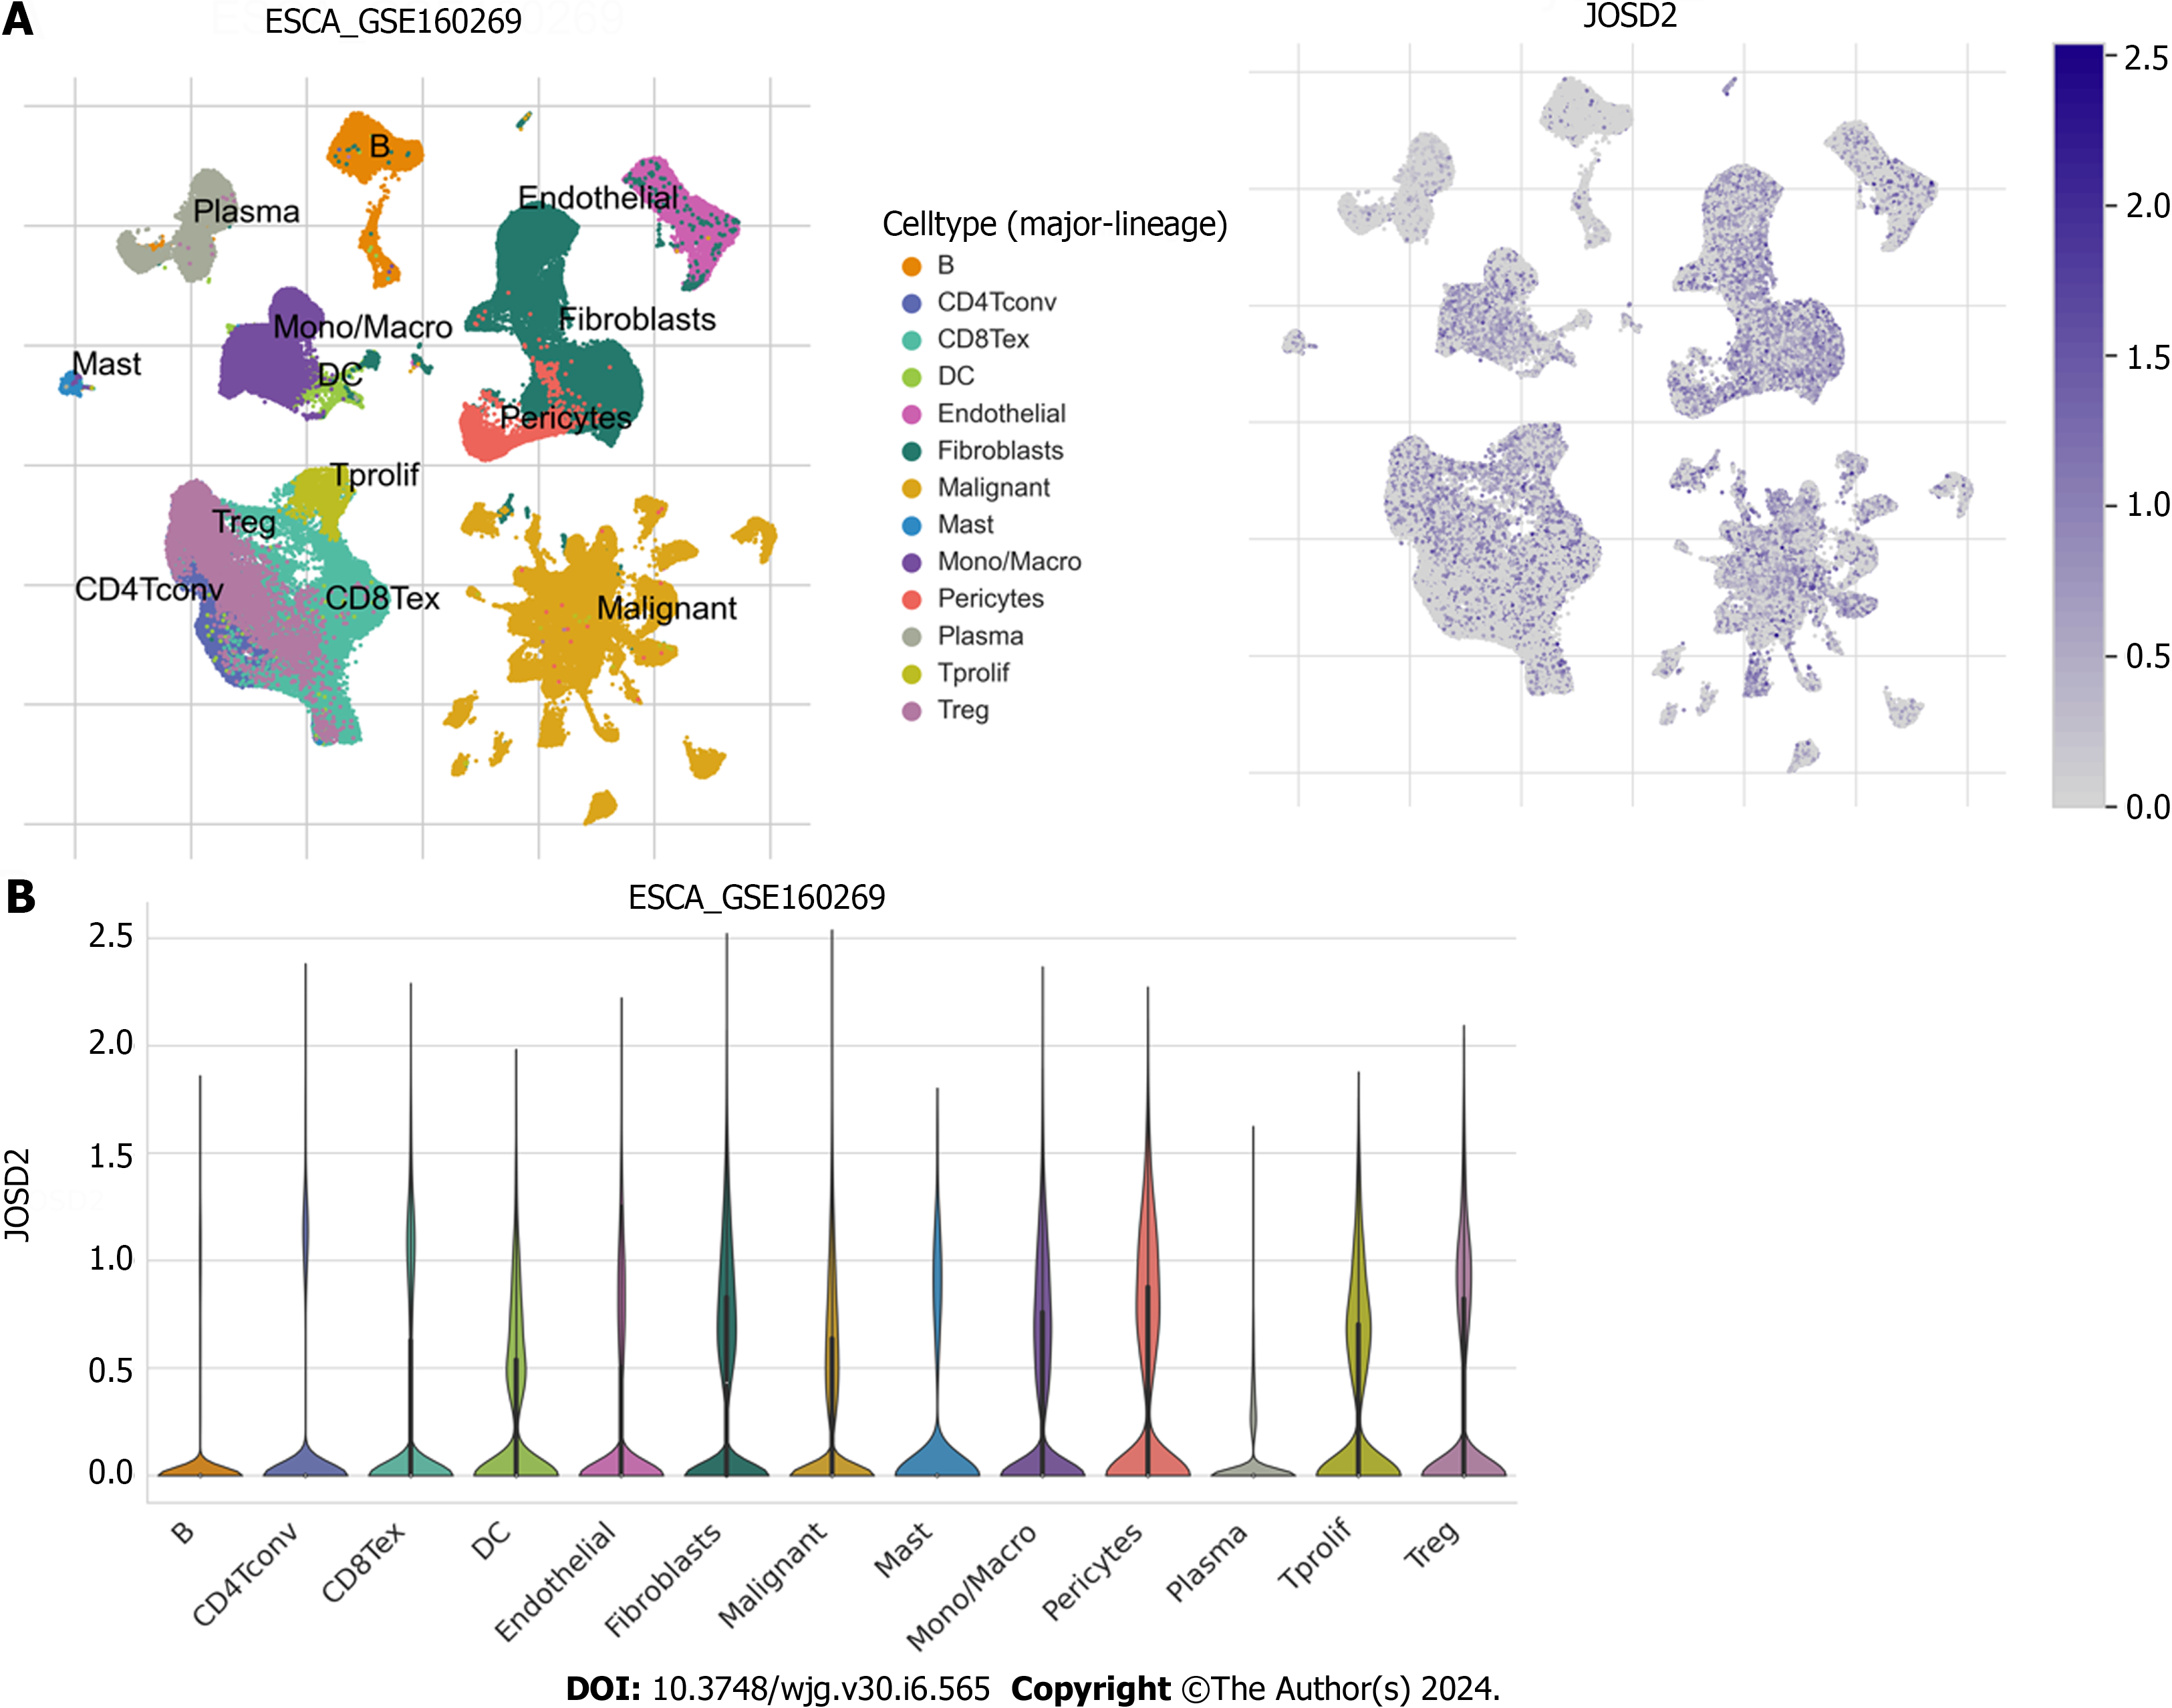
Figure 2 Single-cell sequencing data of esophageal squamous cell carcinoma in GSE160269.
A: Uniform manifold approximation and projection plots showing the grouping of different cell types (left) and the expression profile of JOSD2 (right) in different cell types; B: Violin plots showing JOSD2 expression in different cell types.
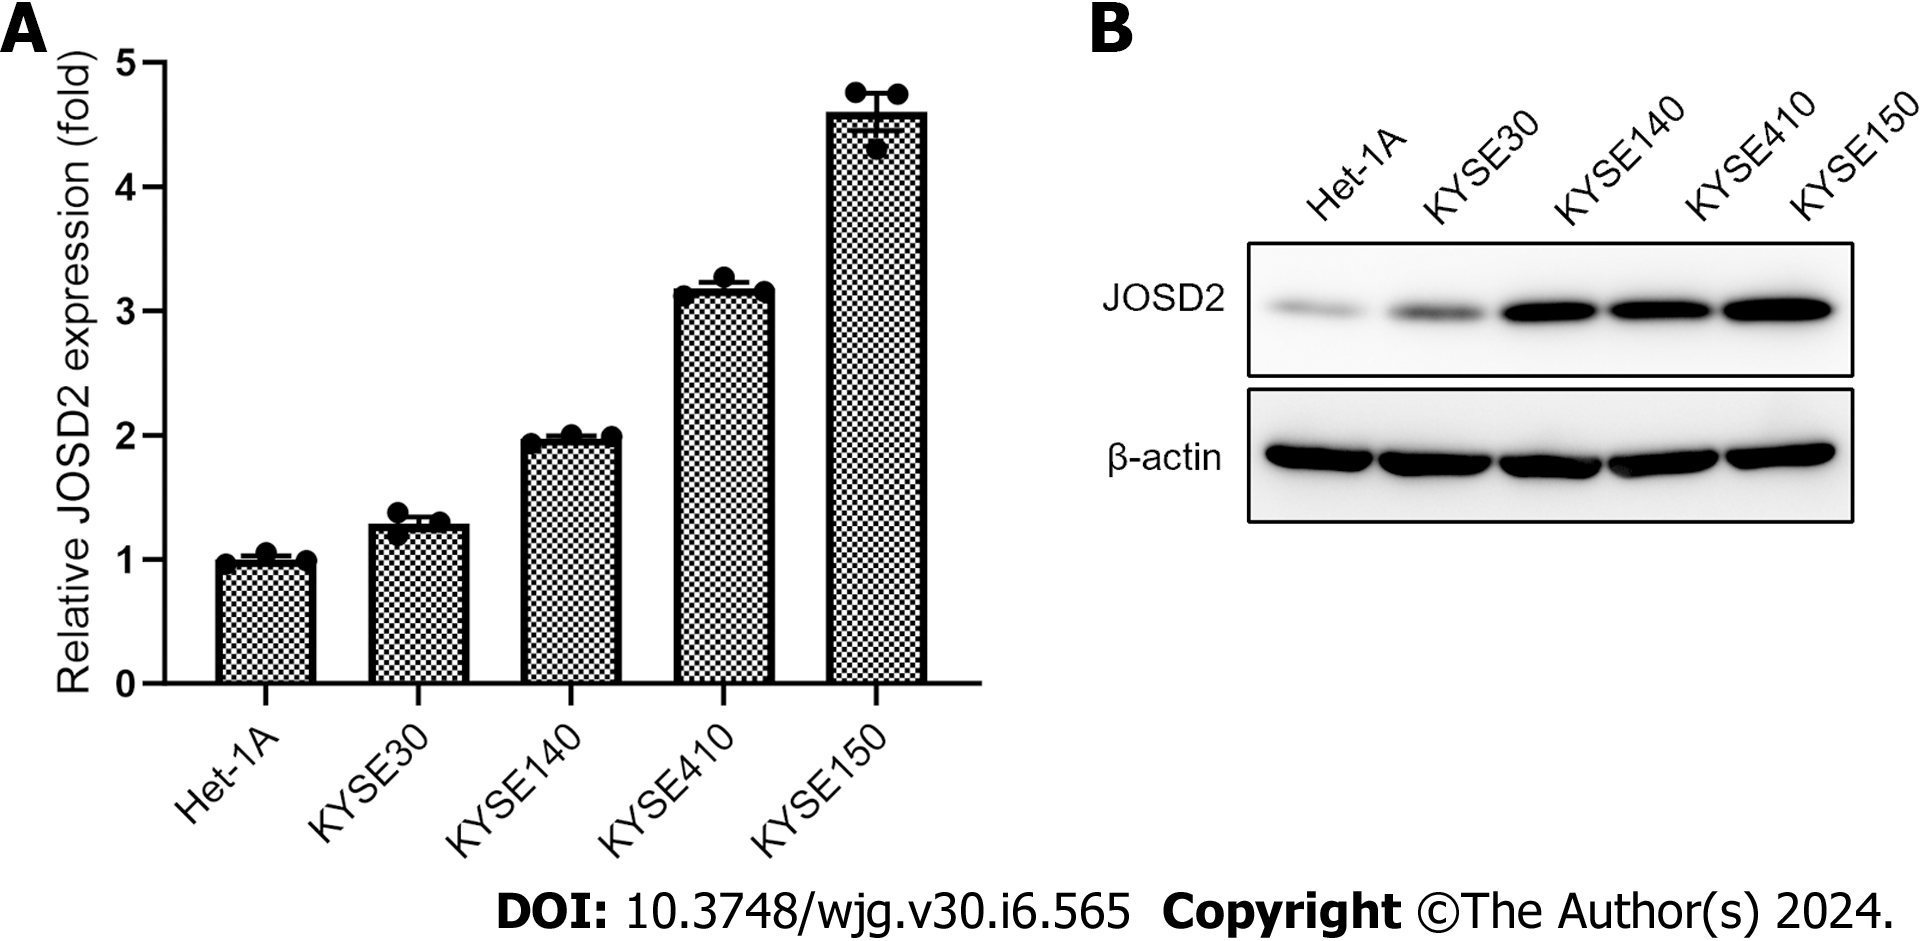
Figure 3 JOSD2 expression in esophageal squamous cell carcinoma cell lines.
Real-time fluorescence quantitative polymerase chain reaction and western blotting results showing JOSD2 mRNA (A) and protein (B) expression in esophageal squamous cell carcinoma cell lines and a normal esophageal epithelial cell line. A: JOSD2 mRNA; B: Protein.
Figure 4 JOSD2 knockdown significantly suppresses the activity of esophageal squamous cell carcinoma cells.
A: JOSD2 was successfully knocked down using shRNA1/2 directed against JOSD2 in KYSE150 cells; B: JOSD2 knockdown significantly inhibited cell proliferation; C: JOSD2 knockdown significantly inhibited the ability of the cells to form colonies. cP < 0.0001.
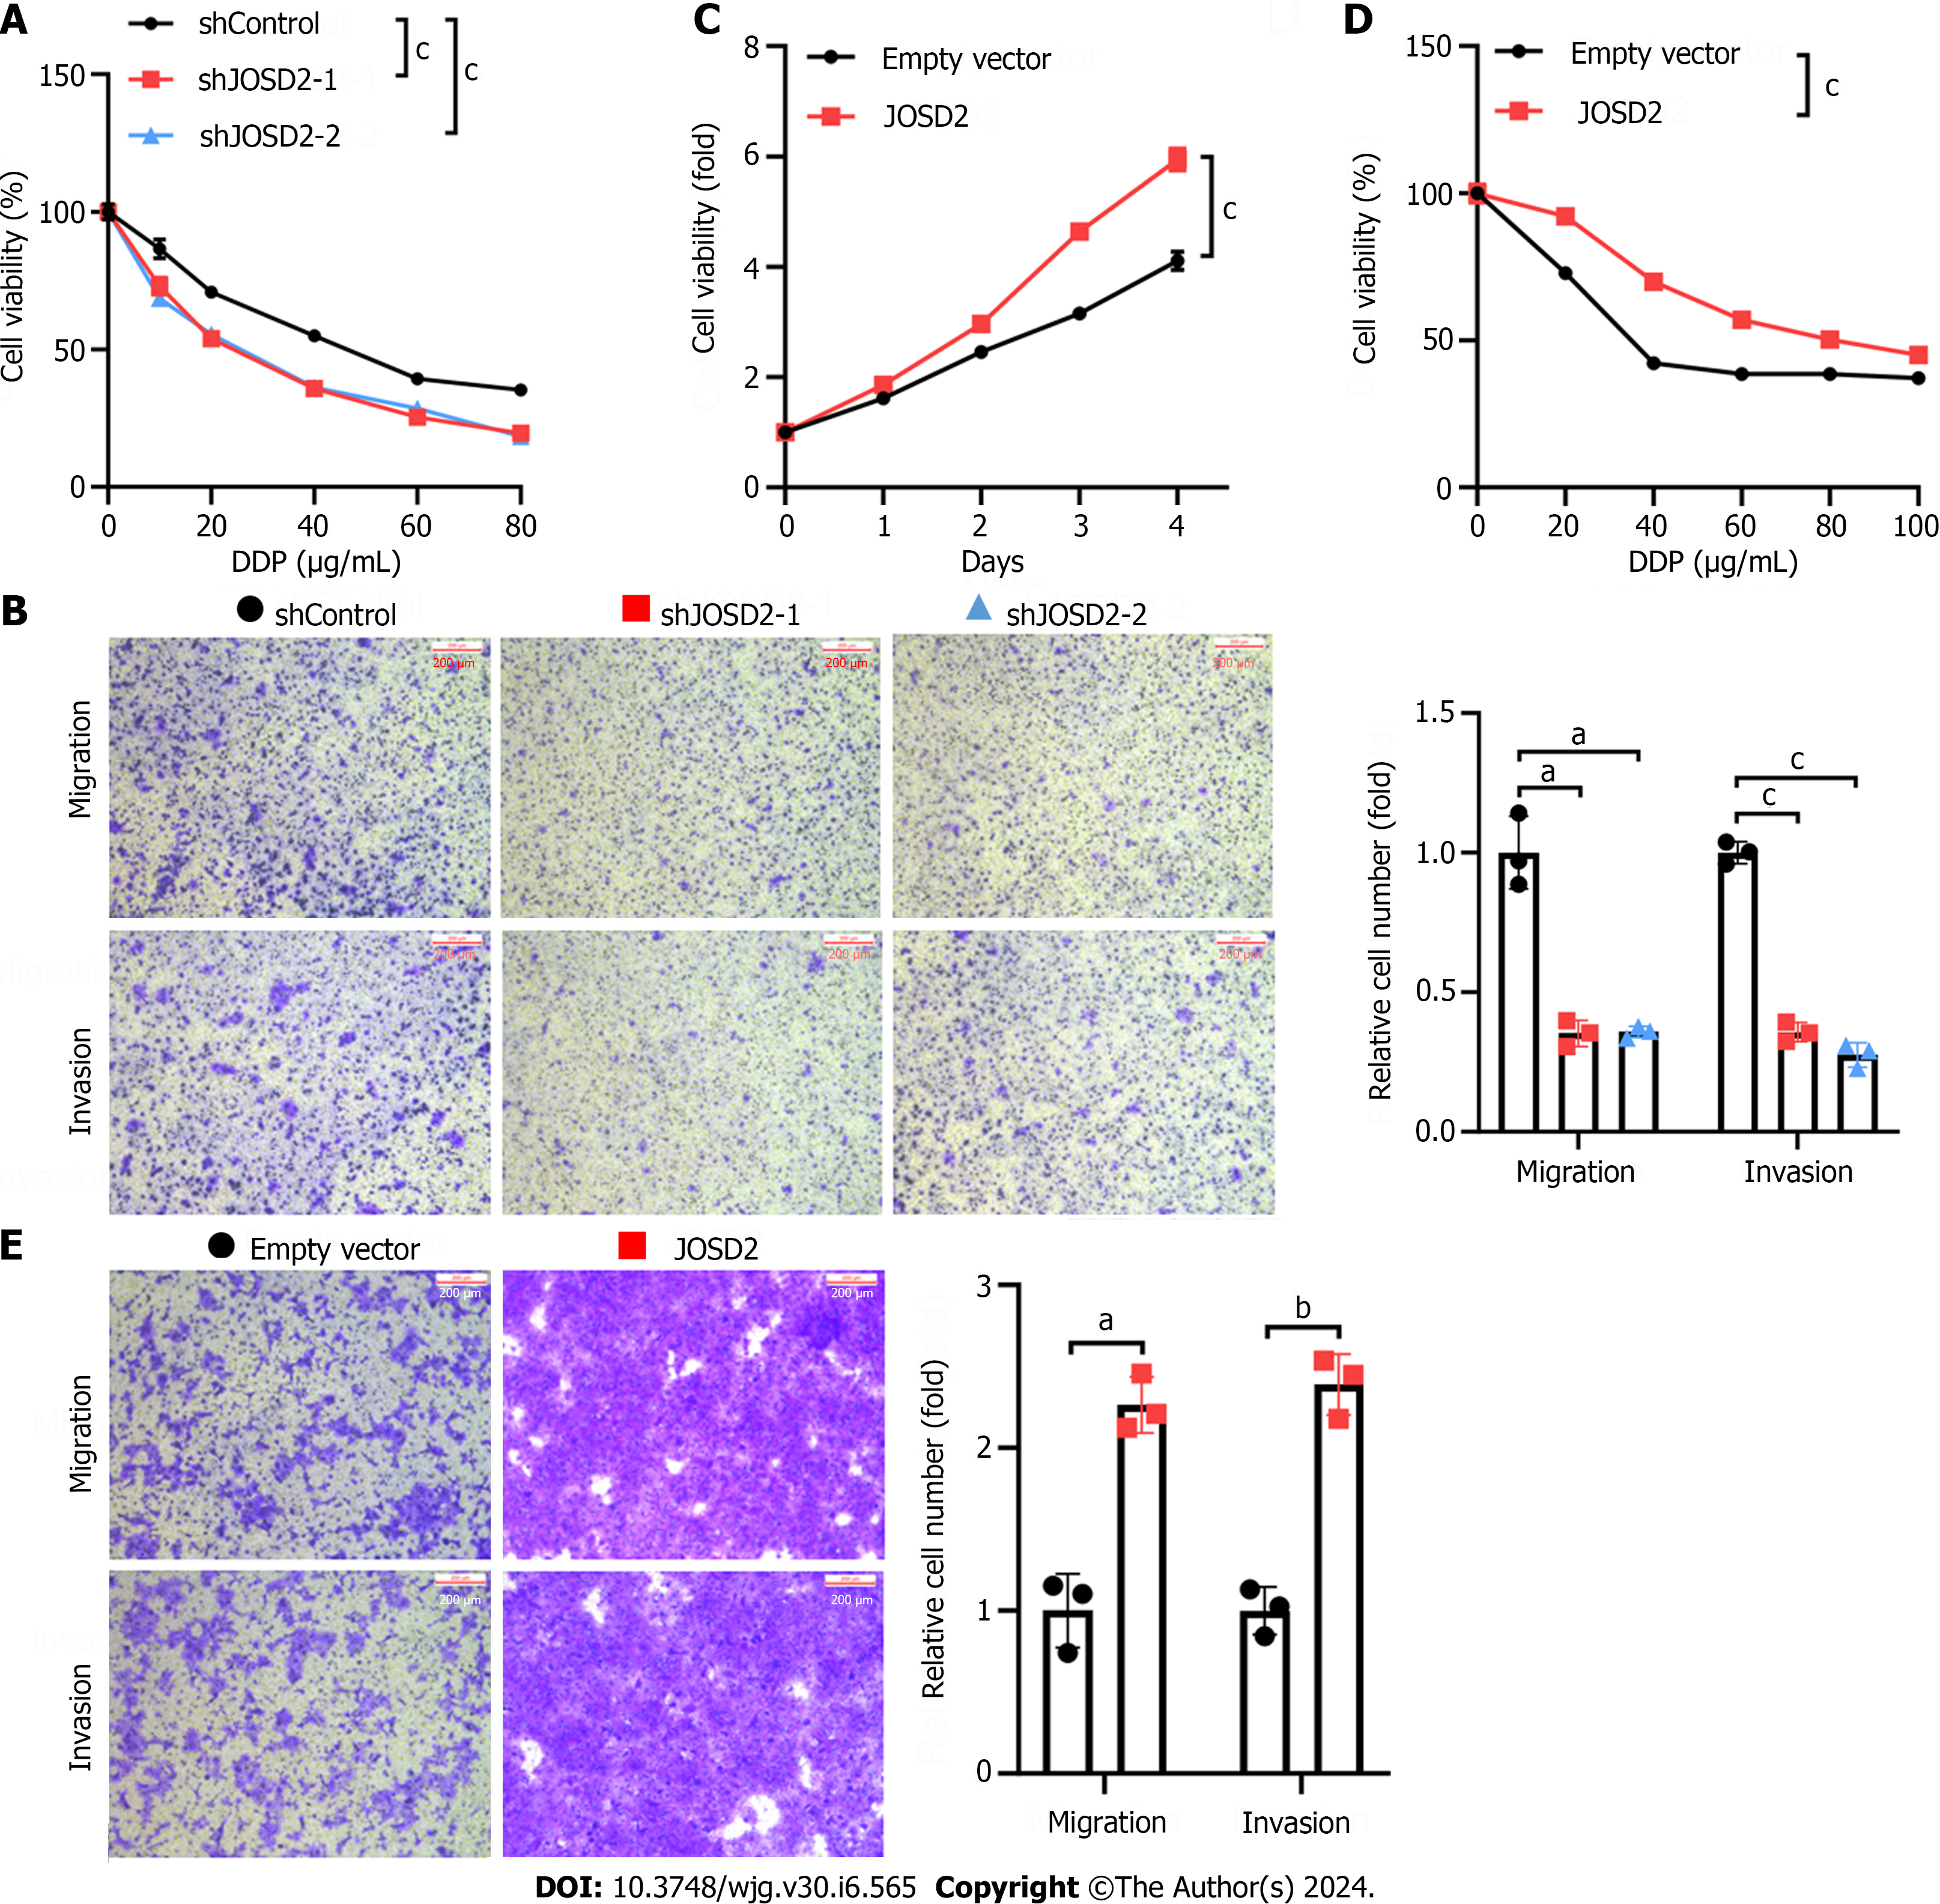
Figure 5 JOSD2 contributes to the proliferation, drug resistance, and metastatic capability of esophageal squamous cell carcinoma cells.
A: JOSD2-knockdown KYSE150 cells exhibited increased sensitivity to 48-h treatment with various concentrations of cisplatin; B: JOSD2-knockdown KYSE150 cells exhibited significantly decreased migration and invasion in Transwell migration and invasion assays; C: JOSD2-overexpressing KYSE30 cells exhibited significantly increased cell growth in cell proliferation assays; D: JOSD2-overexpressing KYSE30 cells exhibited increased resistance to 48-h treatment with various concentrations of cisplatin; E: JOSD2-overexpressing KYSE30 cells exhibited significantly increased migration and invasion in Transwell migration and invasion assays. aP < 0.01; bP < 0.001; cP < 0.0001.
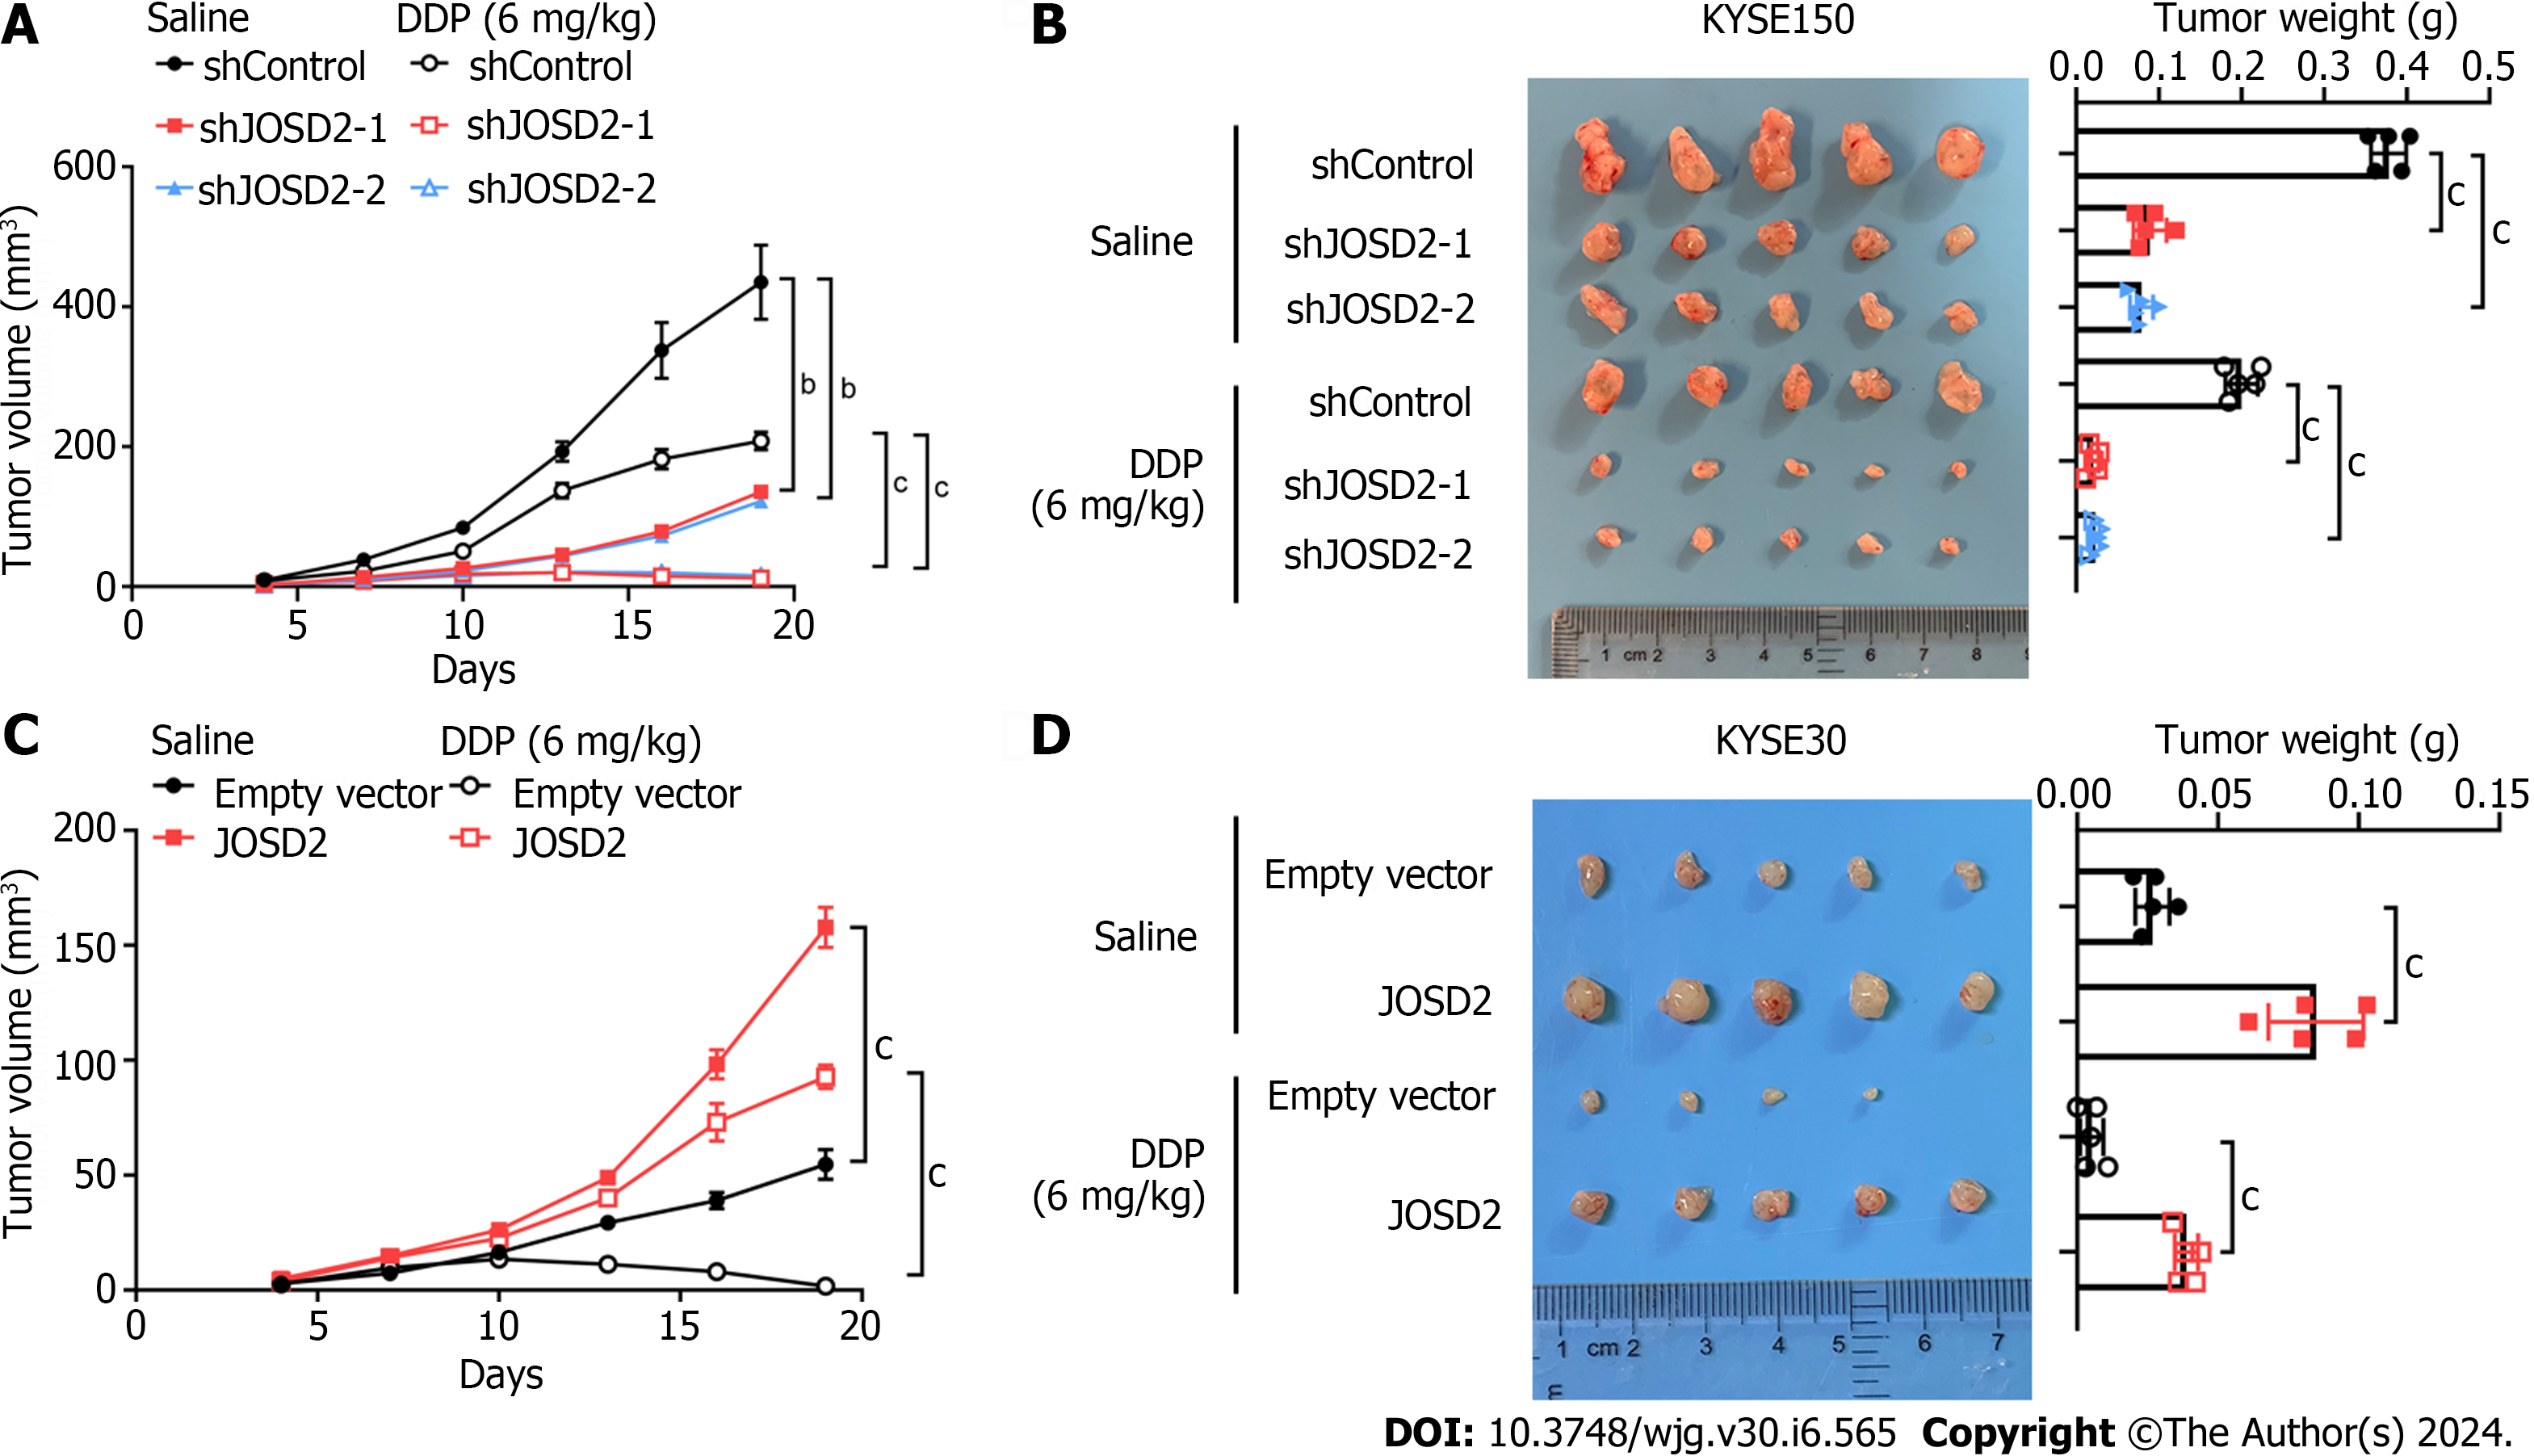
Figure 6 JOSD2 promotes in vivo esophageal squamous cell carcinoma cell proliferation and cisplatin resistance.
A and B: JOSD2-knockdown cisplatin-treated KYSE150 cells exhibited significantly decreased tumor growth in both volume (A) and weight (B) compared to cisplatin-treated control cells; C and D: JOSD2-overexpressing cisplatin-treated KYSE30 cells exhibited significantly increased tumor growth in both volume (C) and weight (D) compared to cisplatin-treated control cells. bP < 0.001; cP < 0.0001.
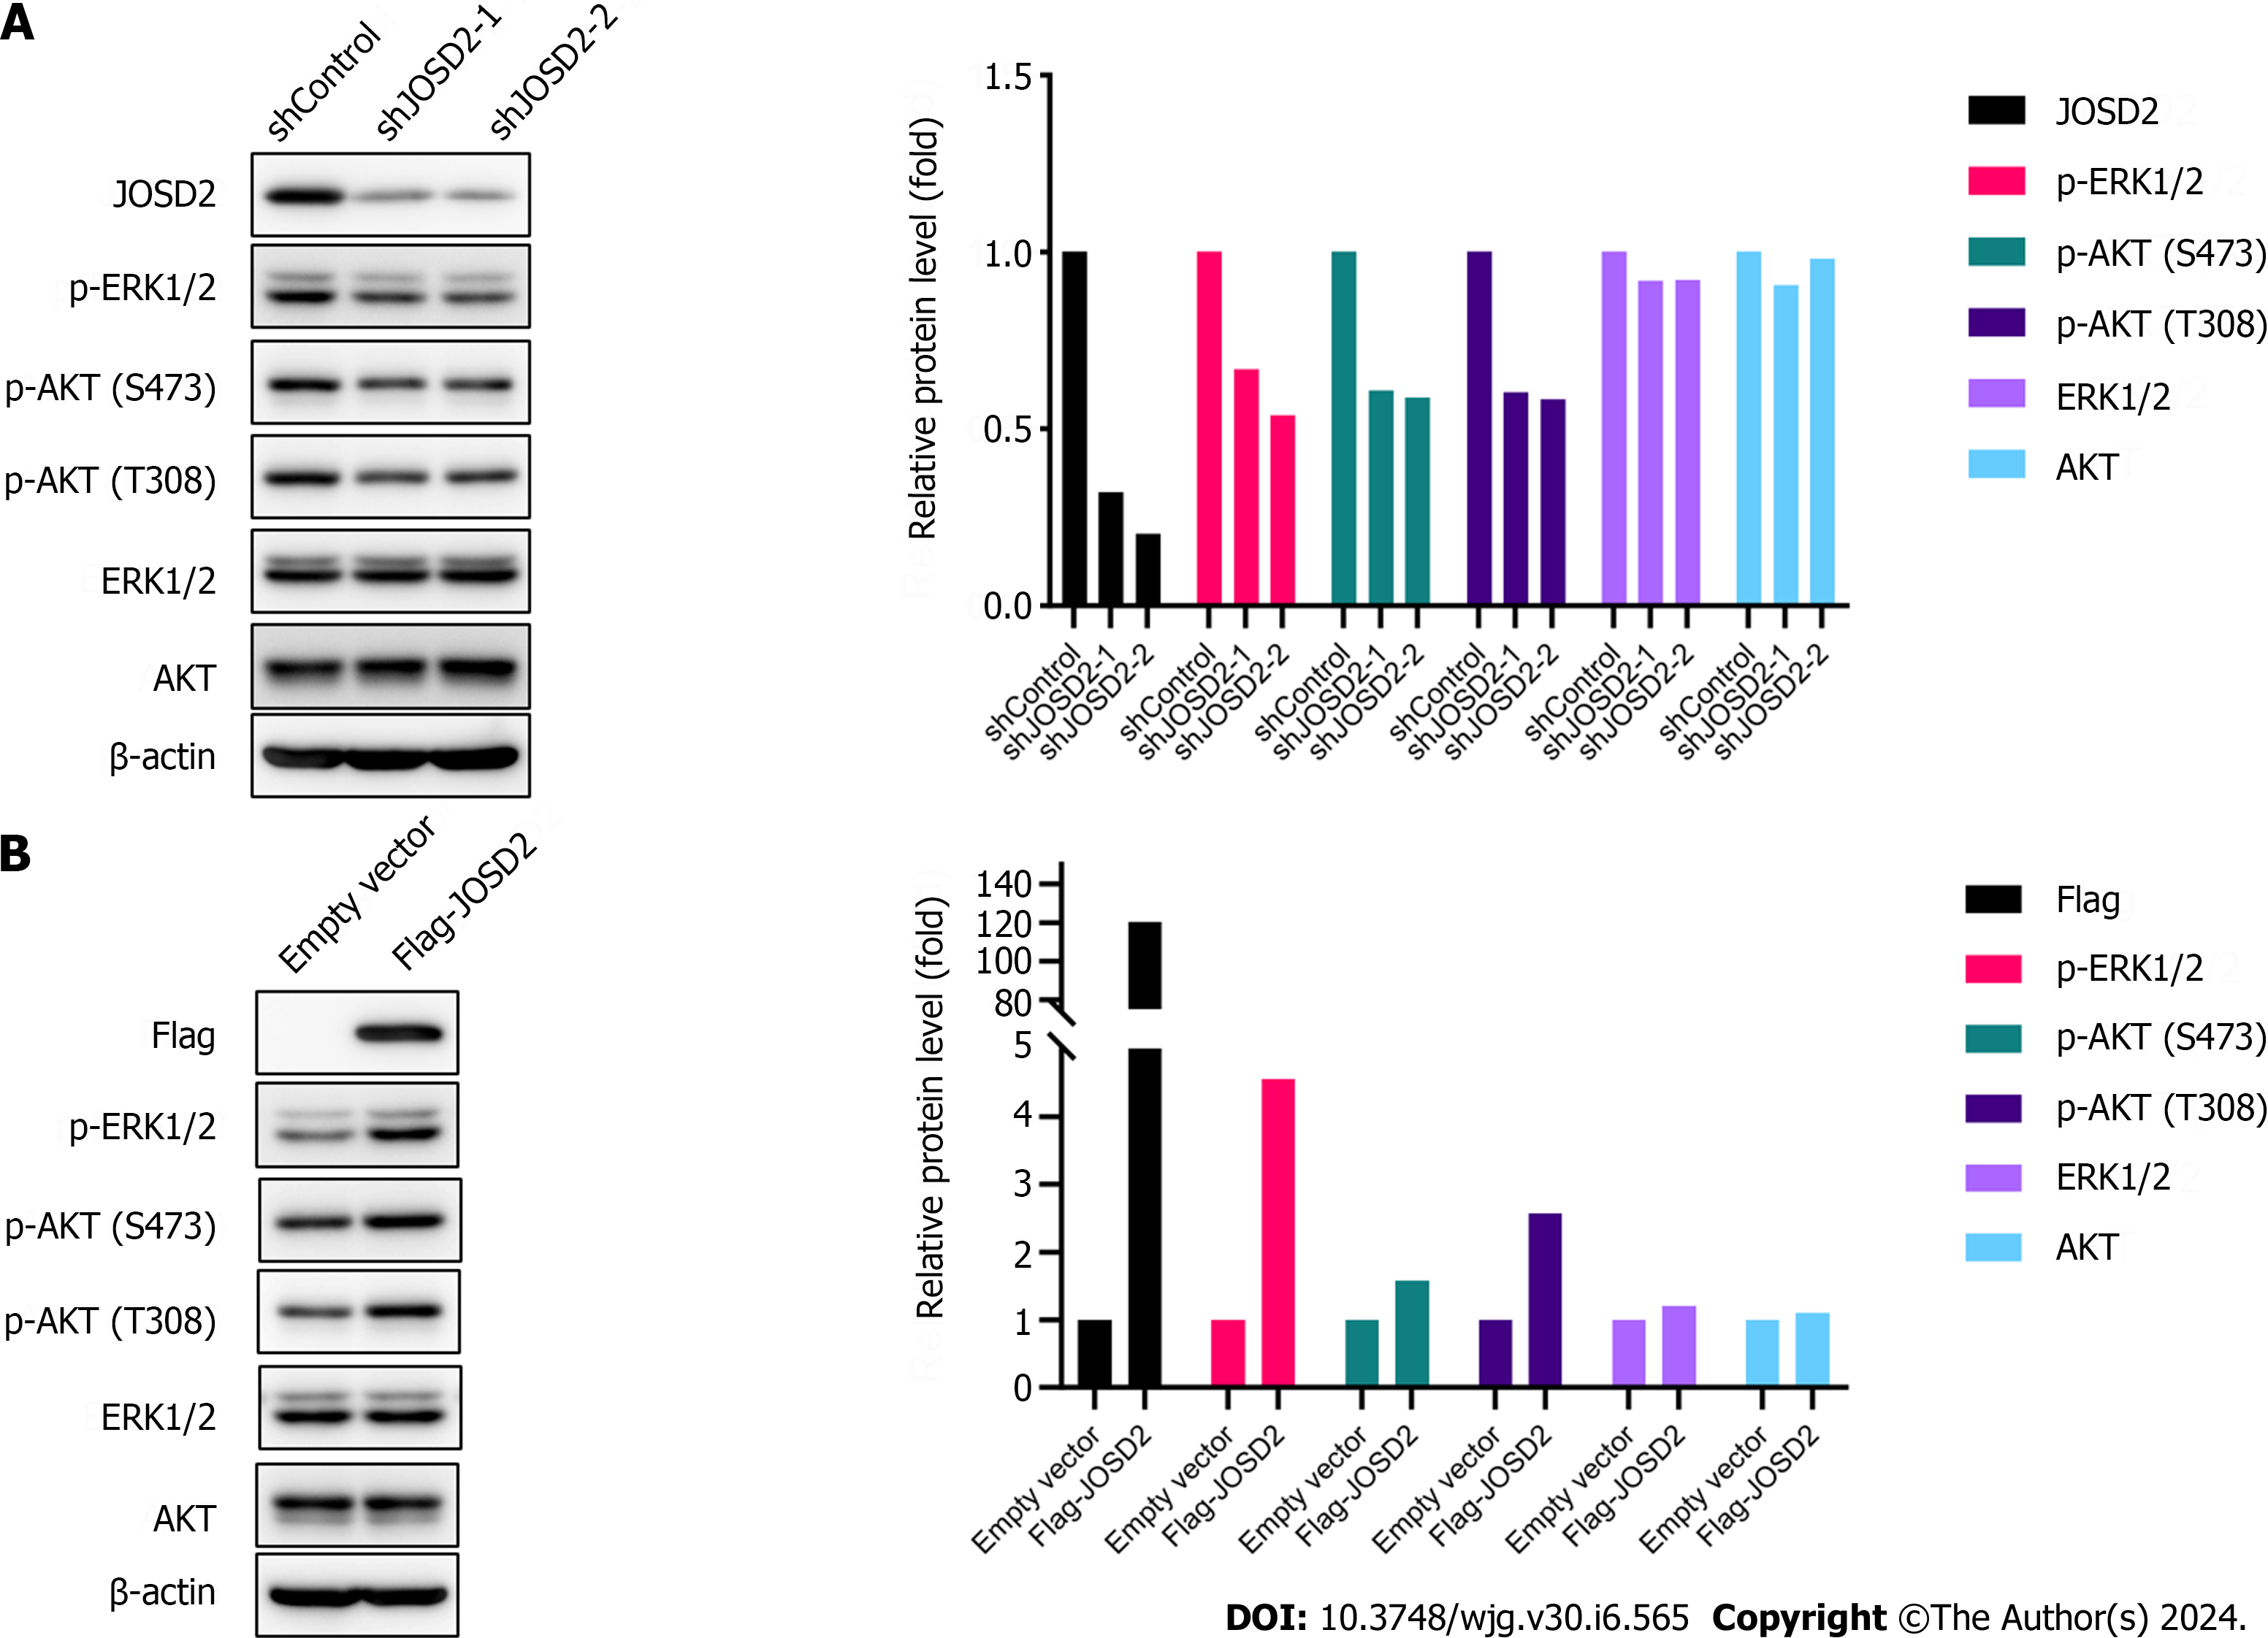
Figure 7 JOSD2 enhances the activation of phosphorylation pathways in esophageal squamous cell carcinoma.
A: Western blotting showing that JOSD2 knockdown in esophageal squamous cell carcinoma (ESCC) cells decreased the phosphorylation of ERK1/2 and AKT; B: Western blotting showing that JOSD2 overexpression in ESCC cells activated the MAPK/ERK and PI3K/AKT signaling pathways.
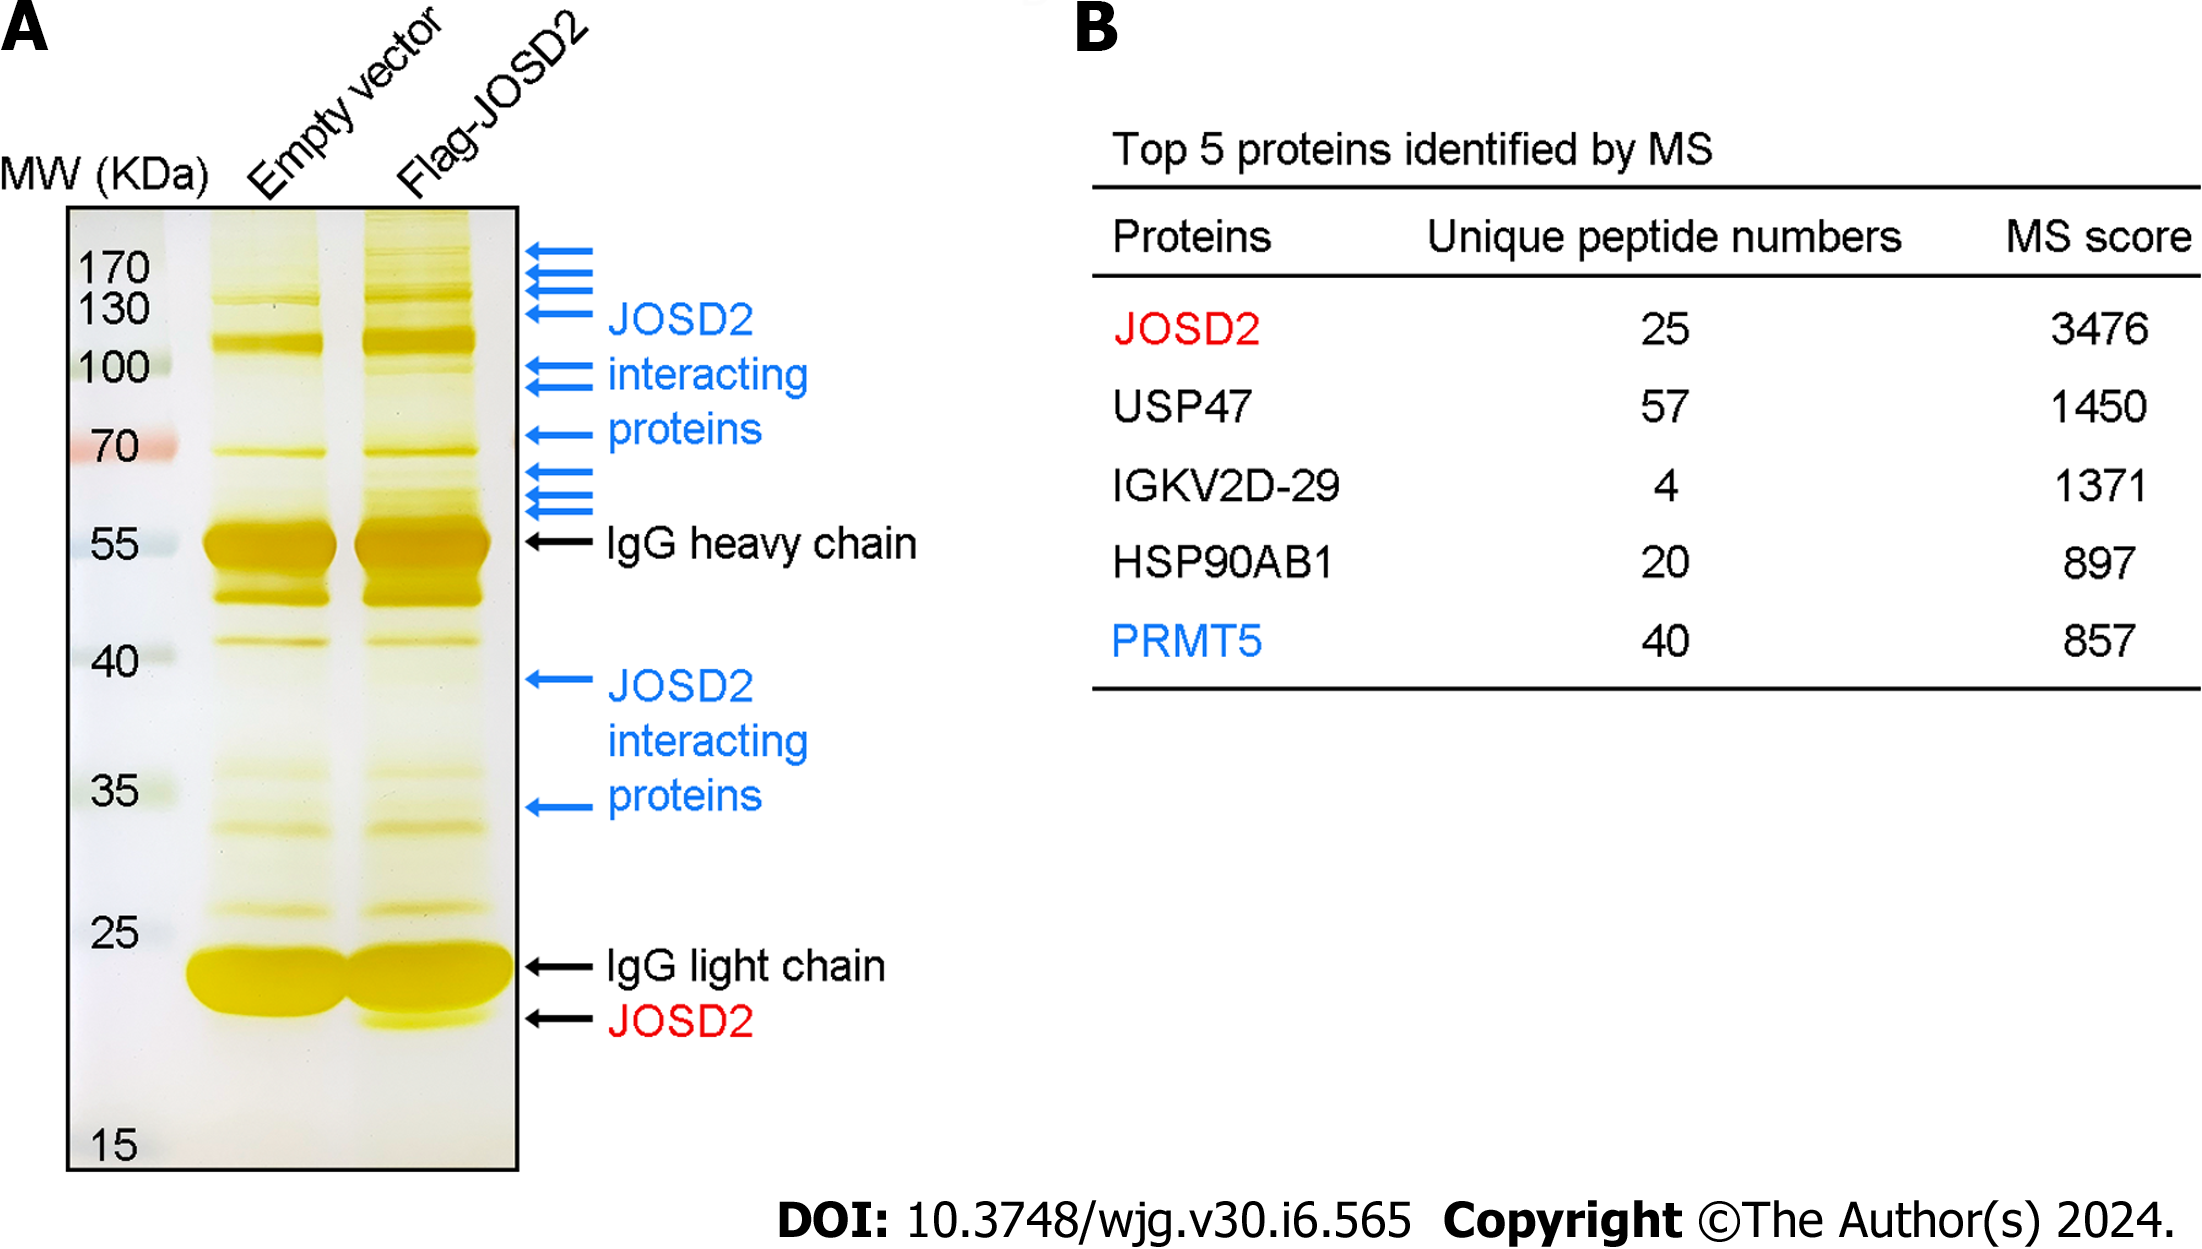
Figure 8 Mass spectrometry analysis of proteins that bind to JOSD2 protein.
A: Protein bands after SDS-PAGE gel silver staining; B: Proteins that potentially interact with JOSD2.
- Citation: Wang WP, Shi D, Yun D, Hu J, Wang JF, Liu J, Yang YP, Li MR, Wang JF, Kong DL. Role of deubiquitinase JOSD2 in the pathogenesis of esophageal squamous cell carcinoma. World J Gastroenterol 2024; 30(6): 565-578
- URL: https://www.wjgnet.com/1007-9327/full/v30/i6/565.htm
- DOI: https://dx.doi.org/10.3748/wjg.v30.i6.565


