Copyright
©The Author(s) 2024.
World J Gastroenterol. May 21, 2024; 30(19): 2553-2563
Published online May 21, 2024. doi: 10.3748/wjg.v30.i19.2553
Published online May 21, 2024. doi: 10.3748/wjg.v30.i19.2553
Figure 1 Isolation of exosomes from HepG2.
2.15 cells. A: Analysis of the exosome marker protein CD9, expressed in HepG2.2.15, HepG2 and WRL68 cells, conducted via western blotting; B: Representative TEM examination images depicting exosomes secreted from HepG2.2.15 cells. Note scale bar: 0.1 nm; C: Determination of size distribution of the isolated exosomes, as measured by nanoparticle tracking analysis.
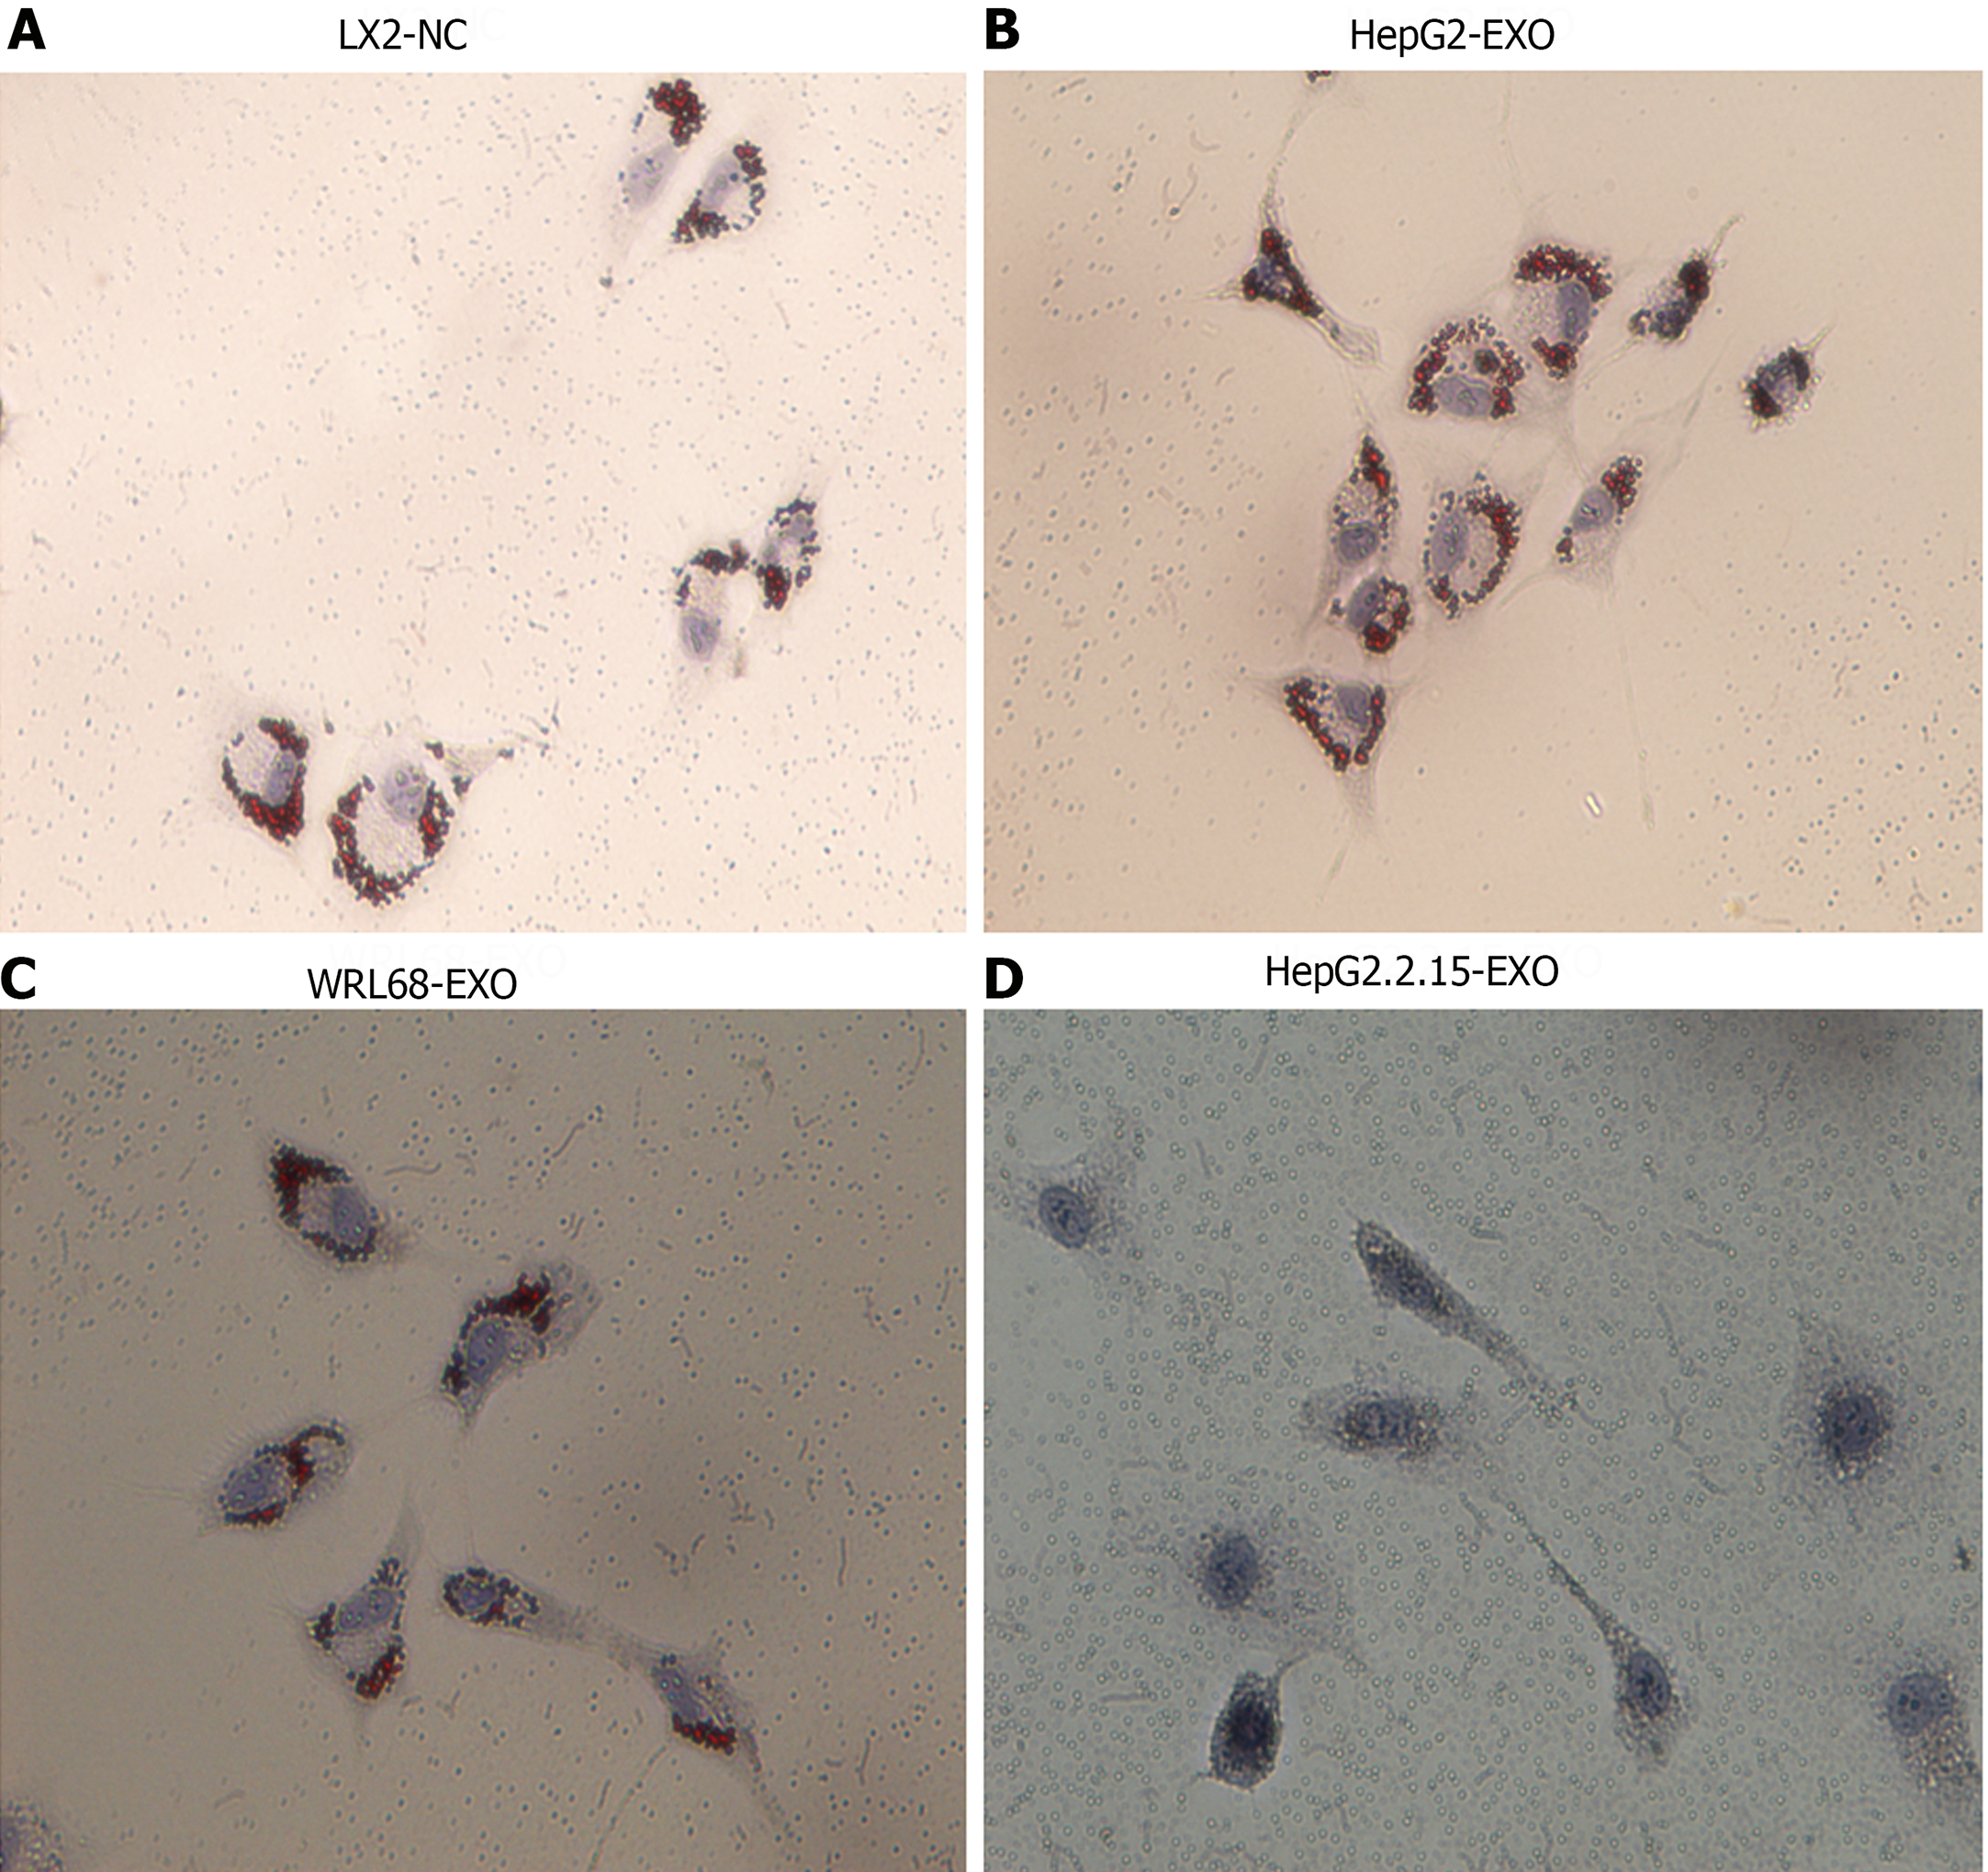
Figure 2 The impact of HepG2.
2.15-derived exosomes on the activation of LX2 cells. A: Display of LX2 cells in a normal culture environment, showing red lipid droplets; B: Illustration of LX2 cells co-cultured with HepG2-exo. Similar to the normal culture, red lipid droplets are present; C: Depiction of LX2 cells co-cultured with WRL68-exo. Also maintains presence of red lipid droplets; D: Representation of LX2 cells when co-cultured with HepG2.2.15-exo. Notably, after 24 h of oil red staining, the red lipid droplets disappear, indicating a significant change caused by the HepG2.2.15-exo. Magnification Times: 20 ×.
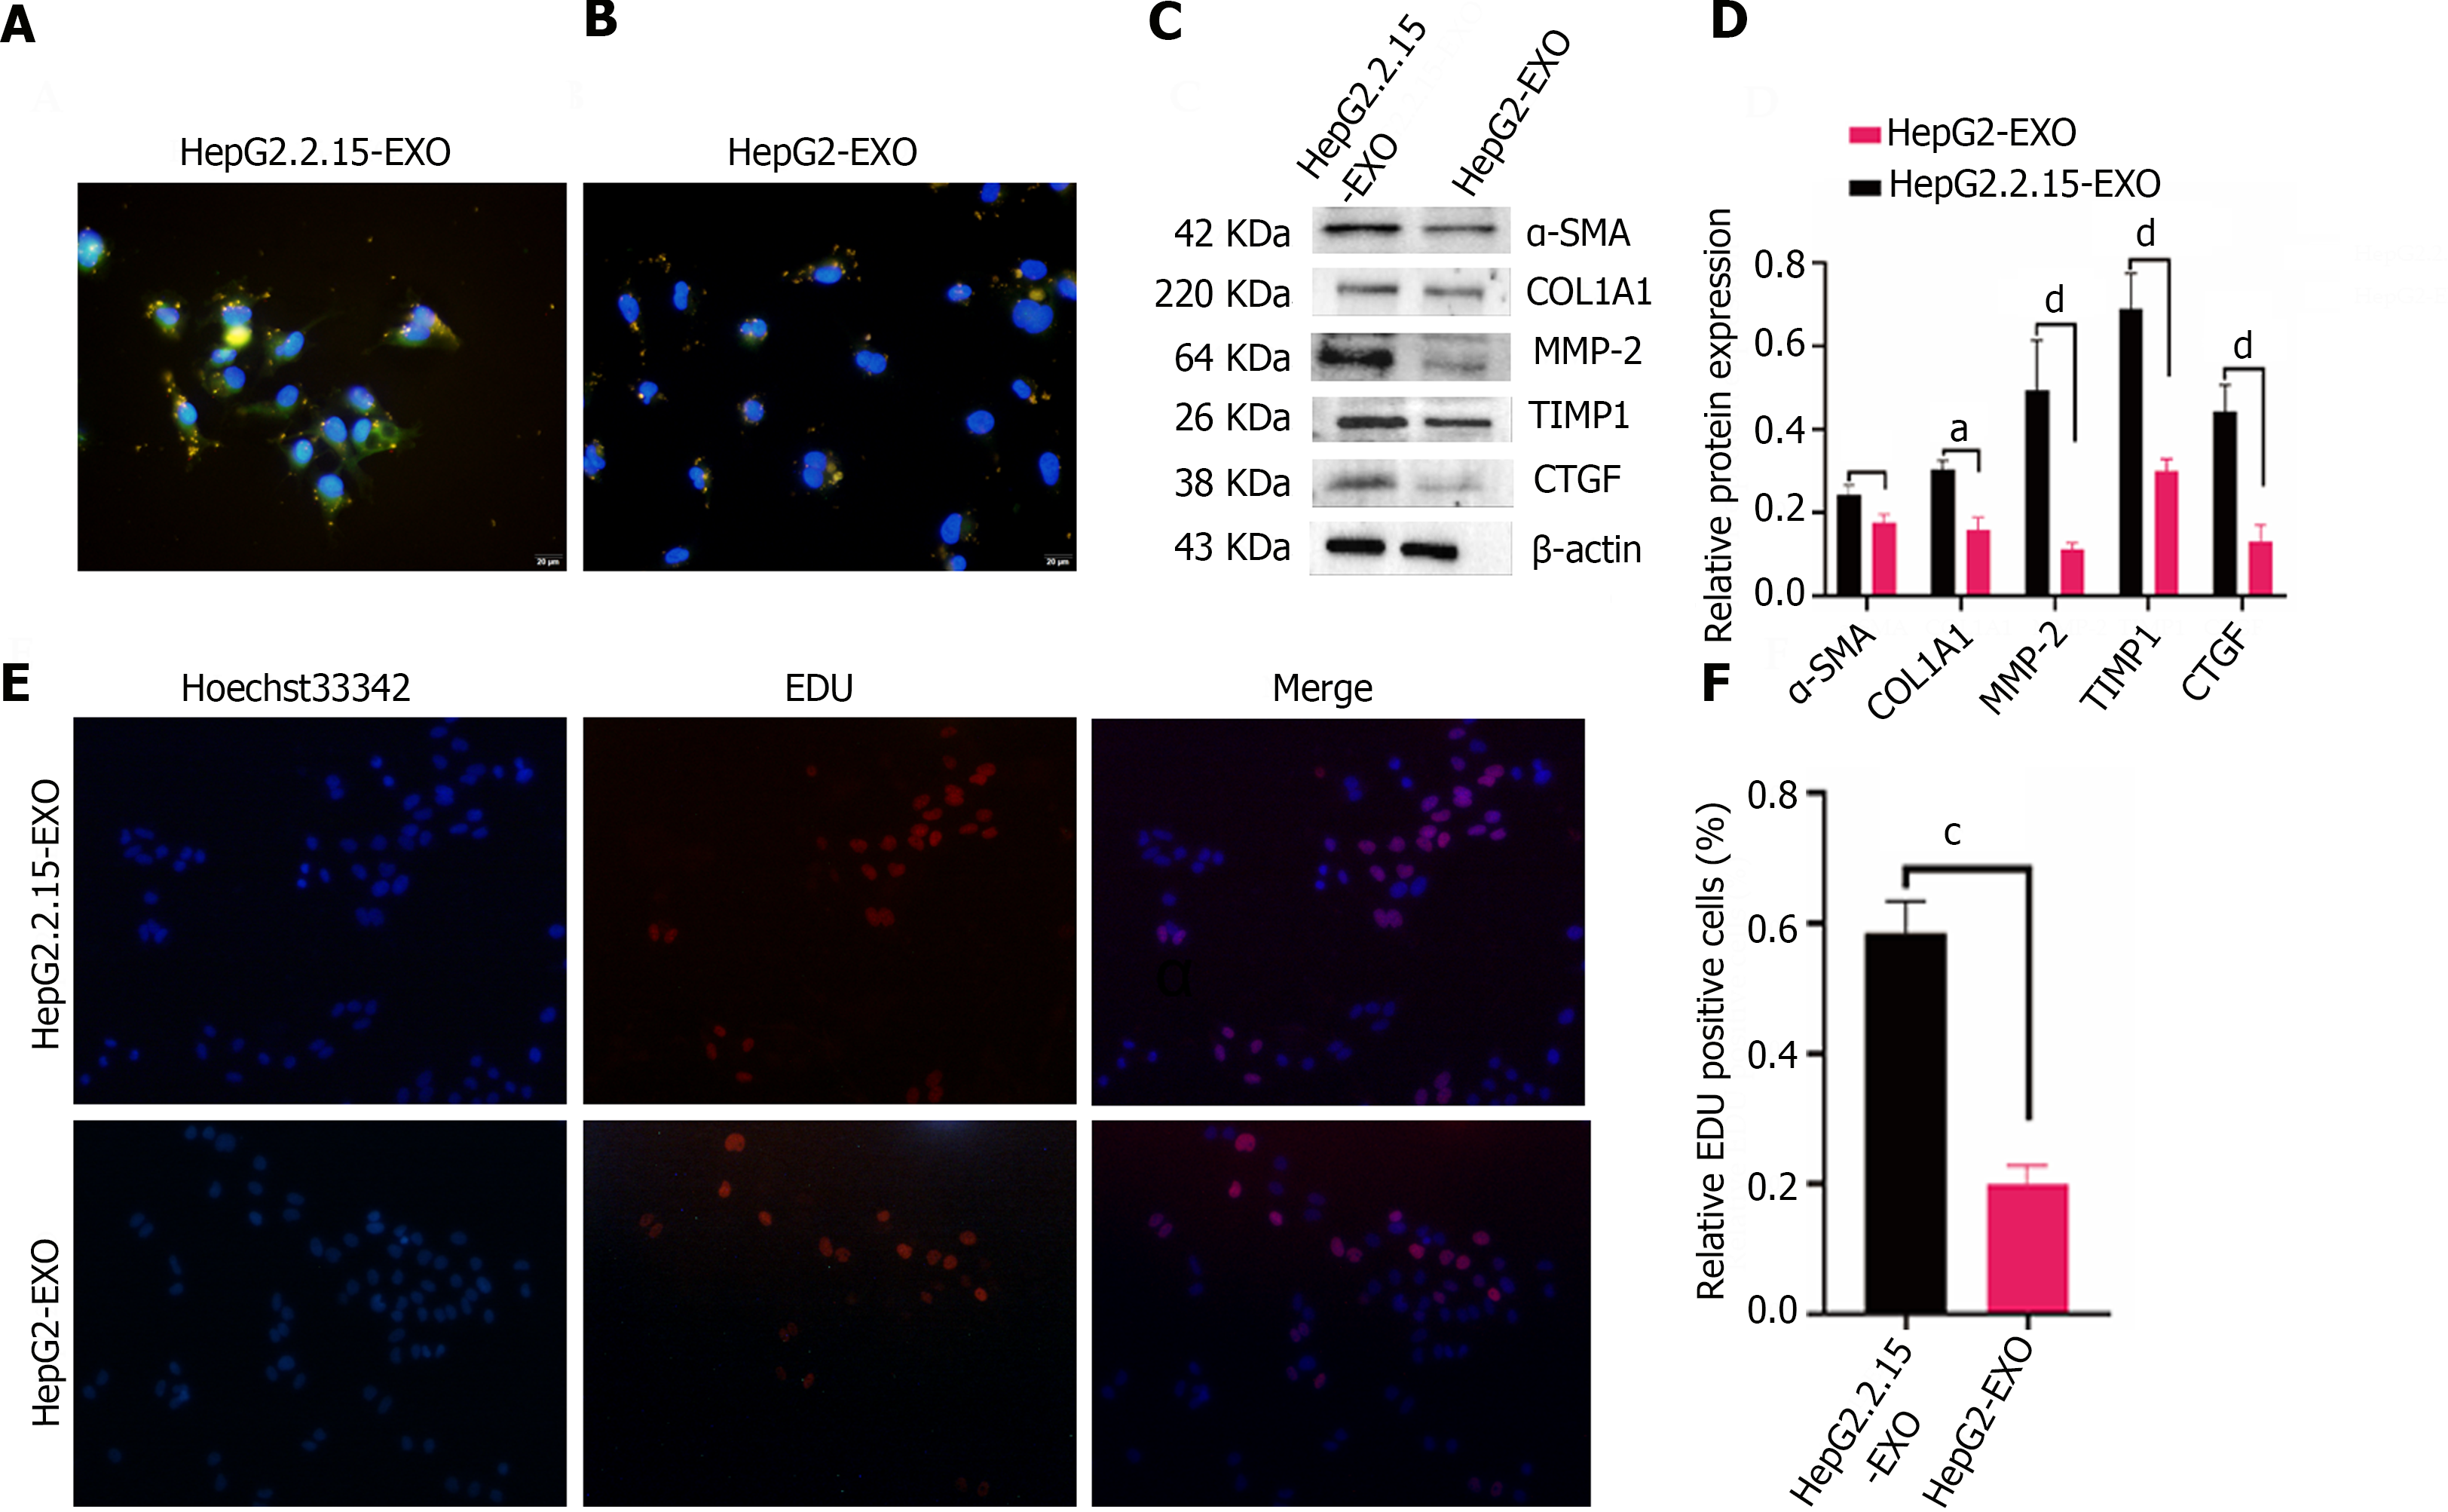
Figure 3 The role of HepG2.
2.15-derived exosomes in LX2 proliferation and fibrosis. A: HepG2.2.15-derived exosomes (colored in yellow), highly expressing α-smooth muscle actin (SMA) (shown in green), are illustrated as being internalized by LX2 cells. The cells showcase a spindled shape and notable pseudopodia with some exosomes penetrating the cell nucleus (depicted in blue). The scale bar signifies 100 μm for reference; B: The HepG2-derived exosomes (yellow) exhibit lower expression levels of α-SMA (green) within the cytoplasm of the internalizing LX2 cells. Again, several exosomes can be observed within the cell nuclei (shown in blue). The same scale is applied; C: The expression of fibrosis marker proteins, namely α-SMA, COL1A1 type, MMP2, TIMP-1, and CTGF, within LX2 cells are verified through a Western blotting assay; D: Quantitative analysis of Western blotting was done on the intensity of fibrosis marker protein bands; E and F: The 5-ethynyl-2′-deoxyuracil cell proliferation experiment presents that the exosomes secreted by hepatitis B virus-infected hepatocytes have the capabilities of promoting LX2 cell proliferation. A 100 μm scale bar is used (Error bars represent the mean ± SD; aP < 0.05; cP < 0.001; dP < 0.0001). EDU: 5-ethynyl-2′-deoxyuracil; α-SMA: α-smooth muscle actin.
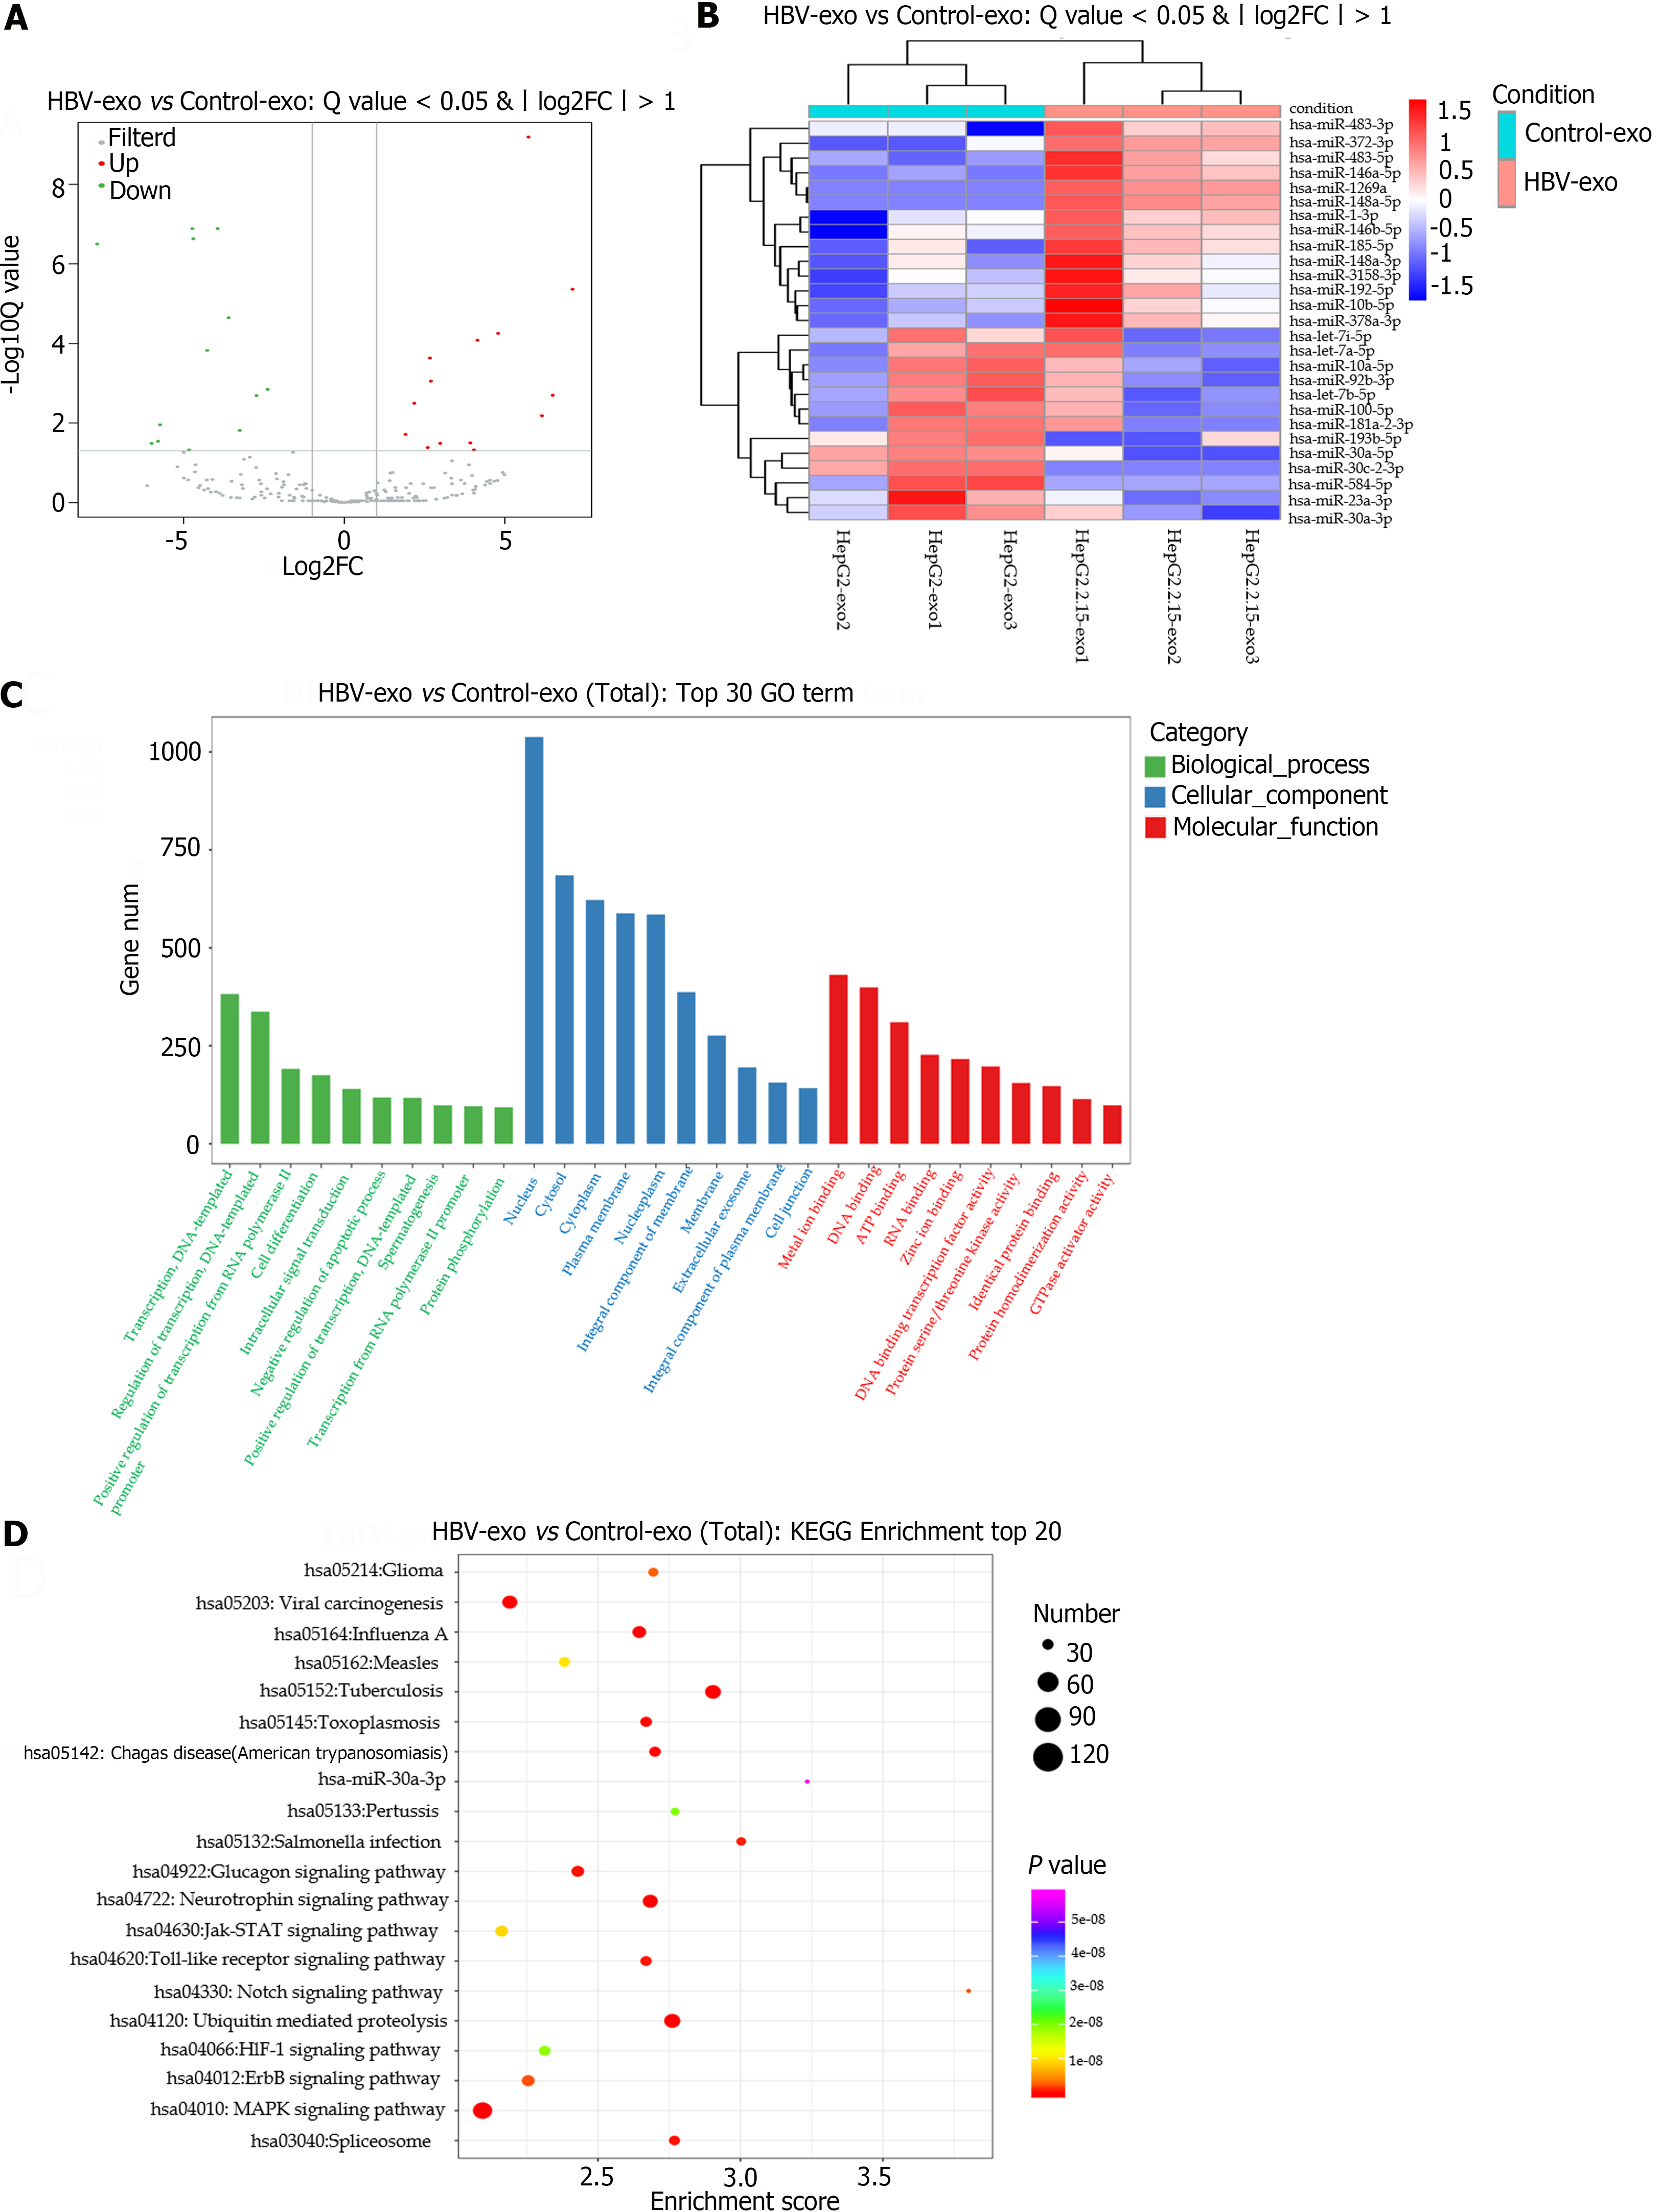
Figure 4 Differential miRNA expression in HepG2.
2.15-derived exosomes. A: The volcano plot demonstrates the differentially expressed miRNAs between HepG2.2.15-derived exosomes and HepG2-derived exosomes. Using a threshold of a P value less than 0.05 and absolute value of log2FC exceeding one, the up-regulated miRNAs are illustrated in red, while down-regulated miRNAs are in green; B: A heat map represents alterations in the expression of the differential miRNAs between HepG2.2.15-derived and HepG2-derived exosomes; with the colour red symbolising up-regulated miRNAs and blue indicating down-regulated miRNAs; C: The Gene Ontology enrichment analysis provides an insightful look into the respective target genes of the differentially expressed miRNAs; D: Enriched Kyoto Encyclopedia of Genes and Genomes pathway statistics are shown in scatter plots, highlighting the top 20 enriched pathways for an easy comparison and further analysis. GO: Gene Ontology; KEGG: Kyoto Encyclopedia of Genes and Genomes; HBV: Hepatitis B virus; FC: Fold change.
- Citation: Gao Y, Li L, Zhang SN, Mang YY, Zhang XB, Feng SM. HepG2.2.15-derived exosomes facilitate the activation and fibrosis of hepatic stellate cells. World J Gastroenterol 2024; 30(19): 2553-2563
- URL: https://www.wjgnet.com/1007-9327/full/v30/i19/2553.htm
- DOI: https://dx.doi.org/10.3748/wjg.v30.i19.2553


