Copyright
©The Author(s) 2024.
World J Gastroenterol. May 21, 2024; 30(19): 2523-2537
Published online May 21, 2024. doi: 10.3748/wjg.v30.i19.2523
Published online May 21, 2024. doi: 10.3748/wjg.v30.i19.2523
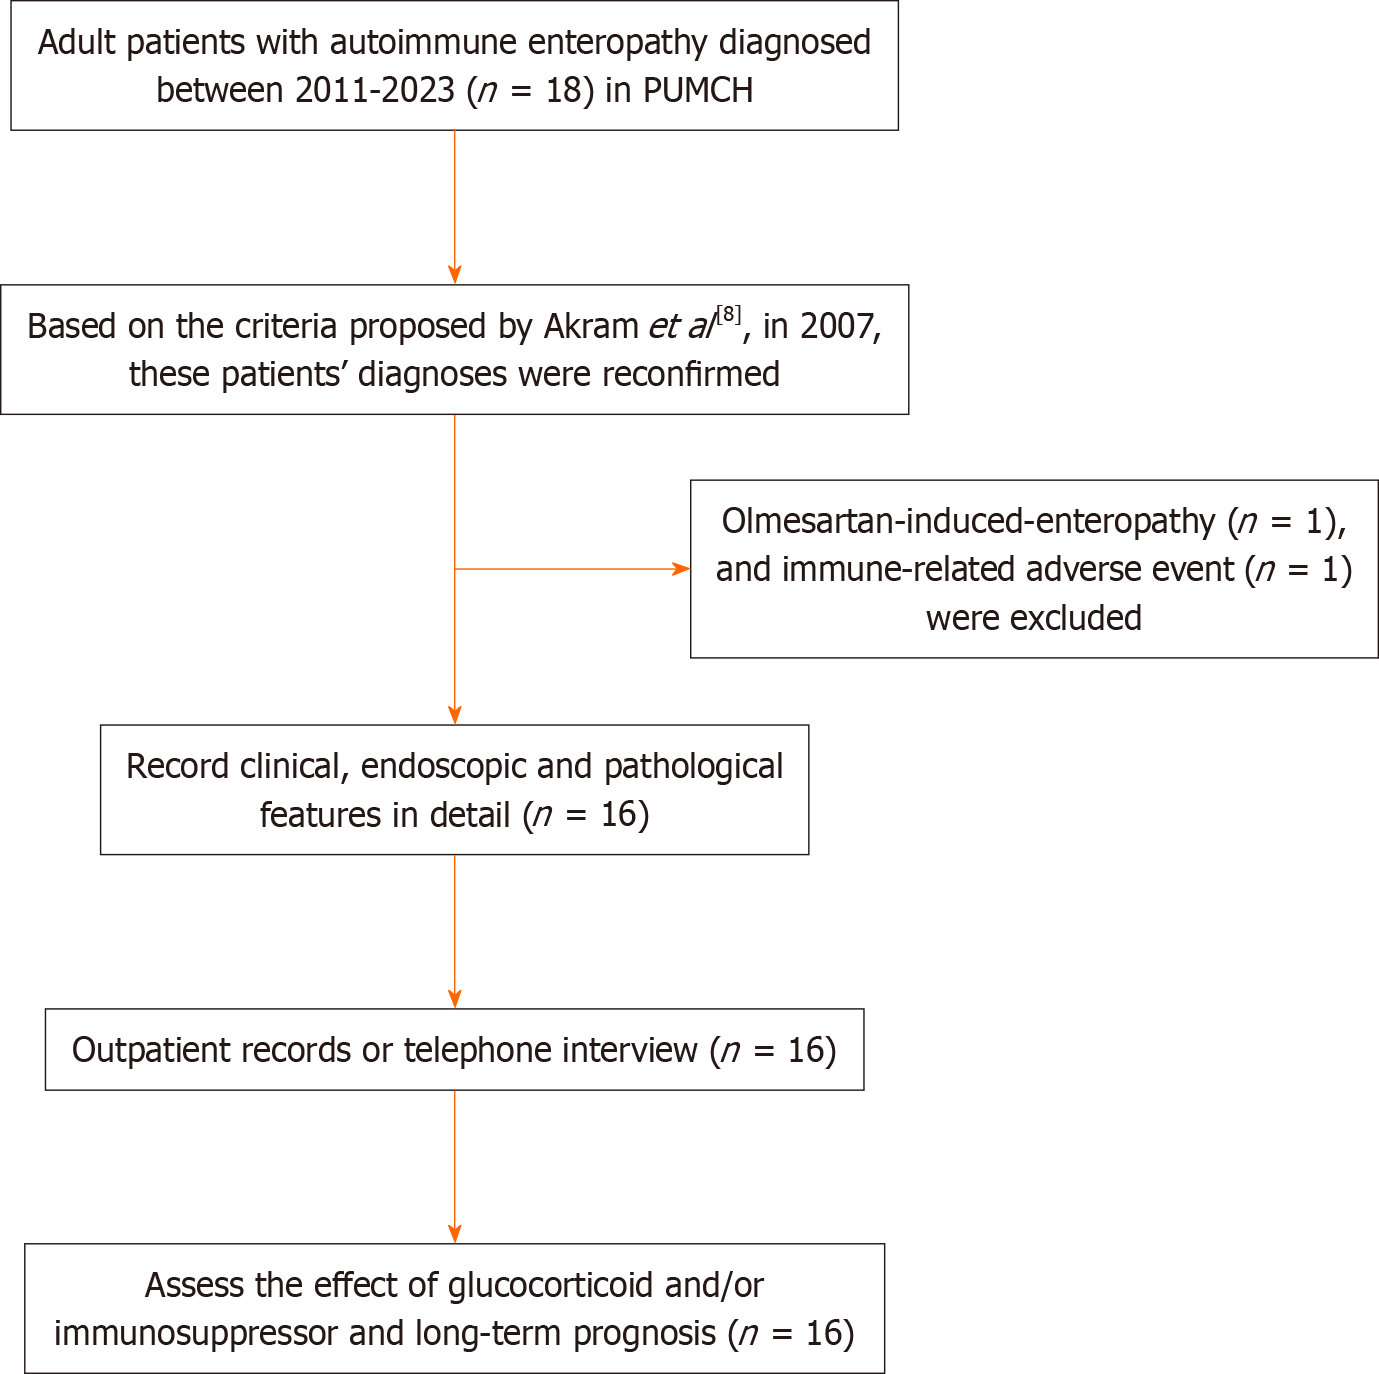
Figure 1 Flowchart of patient enrollment and follow-up.
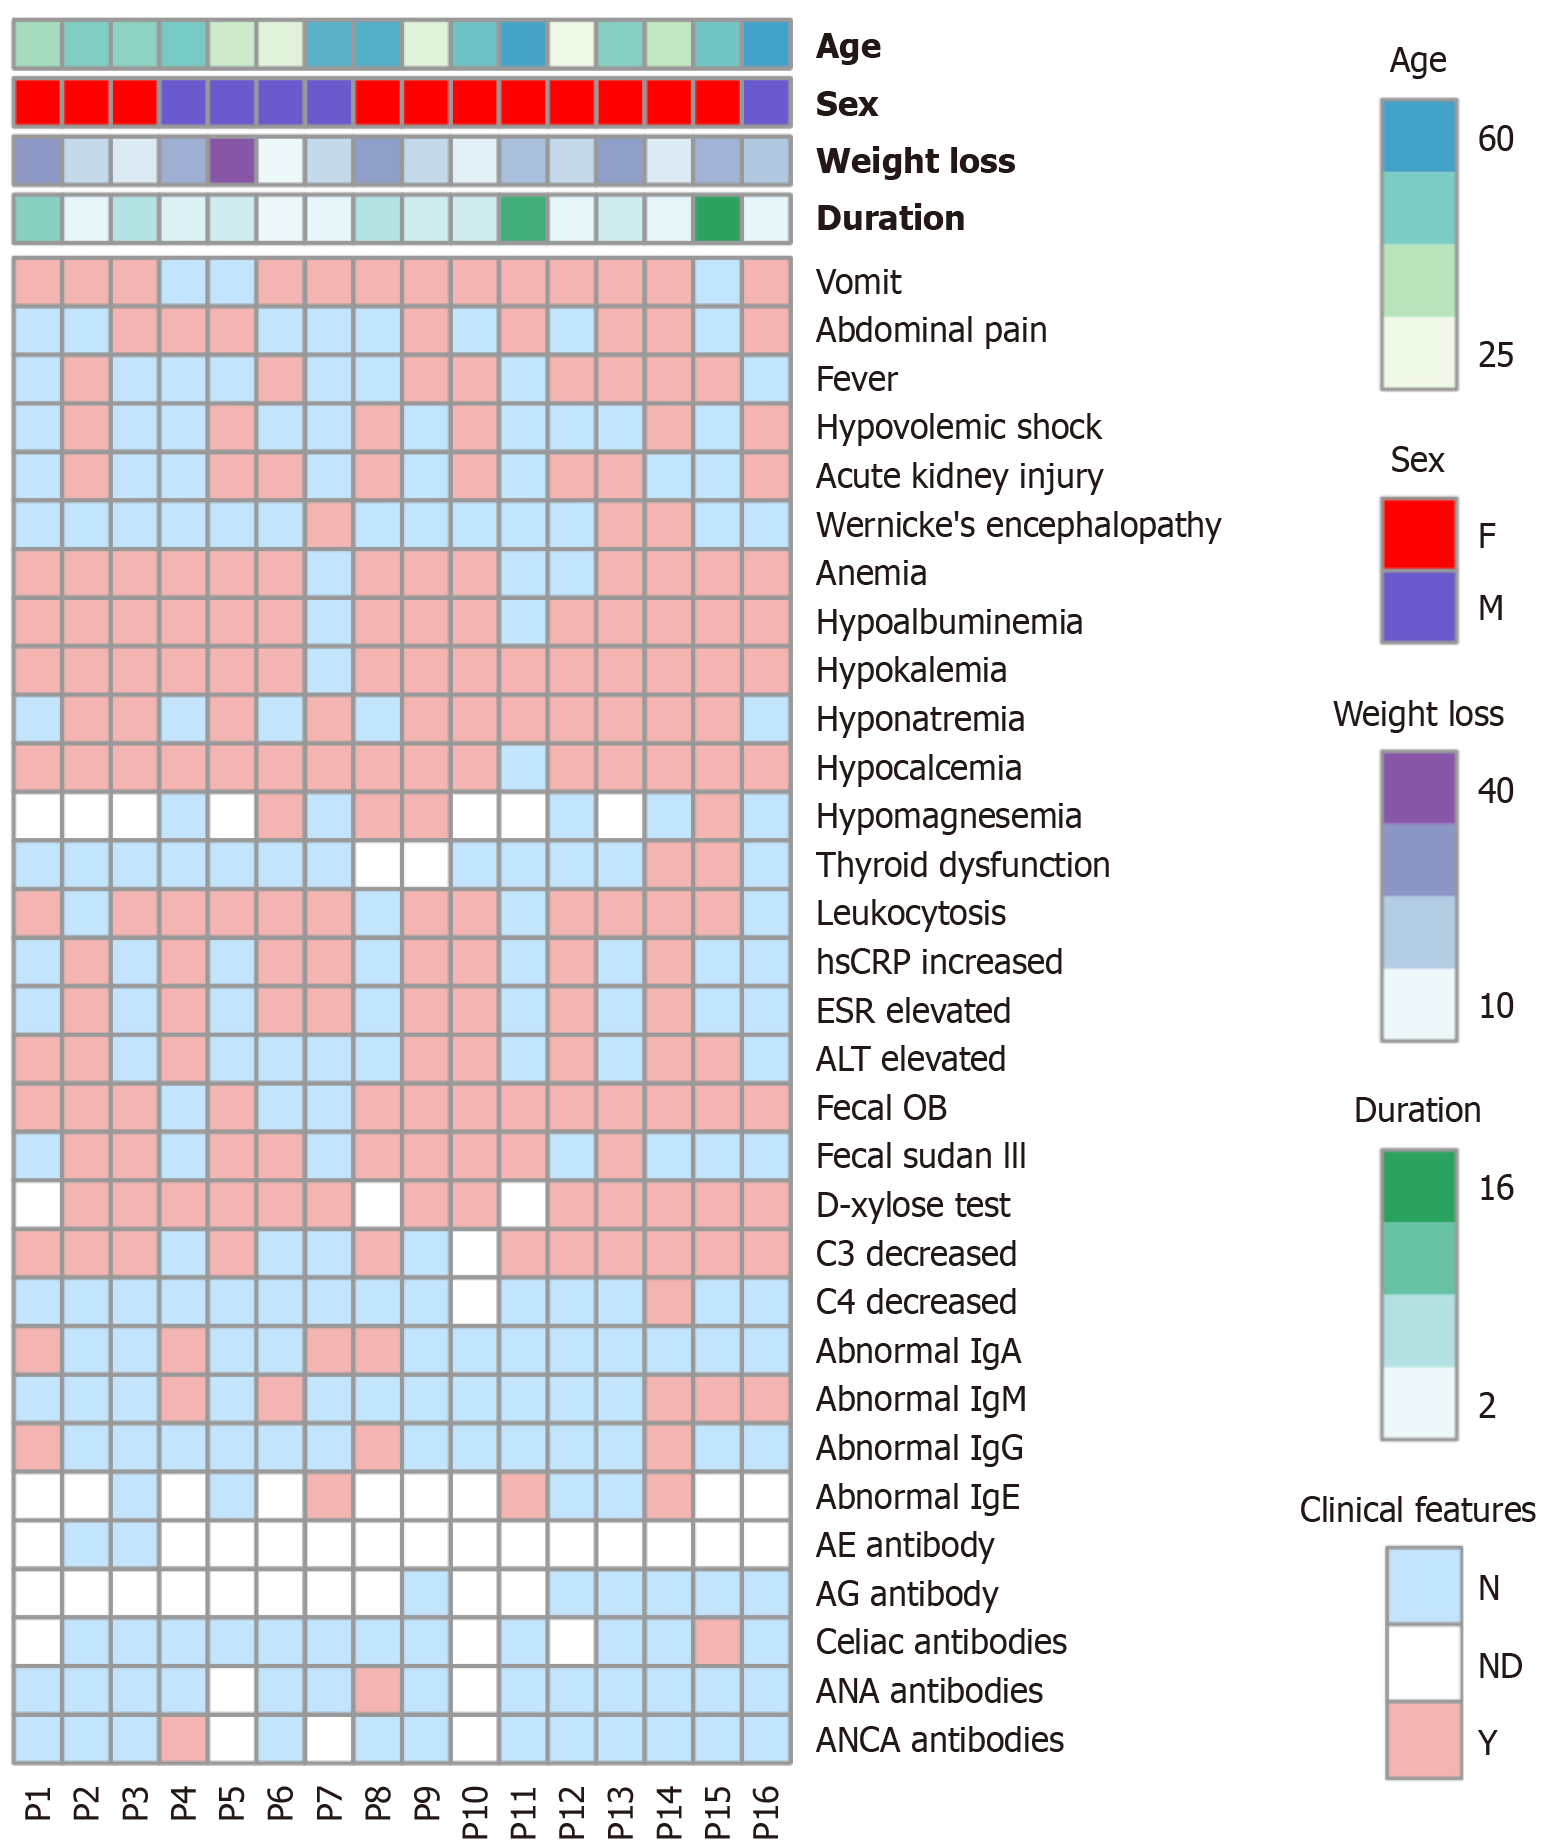
Figure 2 Illustration of each patient’s clinical features.
Duration: Duration of diarrhea; Weight loss: Weight loss throughout the course of diarrhea; Y: The patient presents with this clinical feature; ND: Undetected; N: The patient shows no such clinical feature; WBC: White blood cell counts; hsCRP: High-sensitivity C-reactive protein; ESR: Erythrocyte sedimentation rate; ALT: Alanine transferase; Fecal OB: Fecal occult blood test; IgA: Immunoglobulin A; IgM: Immunoglobulin M; IgG: Immunoglobulin G; IgE: Immunoglobulin E; AE: Anti-enterocyte; AG: Anti–goblet cell; ANA: Antinuclear antibodies; ANCA: Anti-neutrophil cytoplasmic antibody.
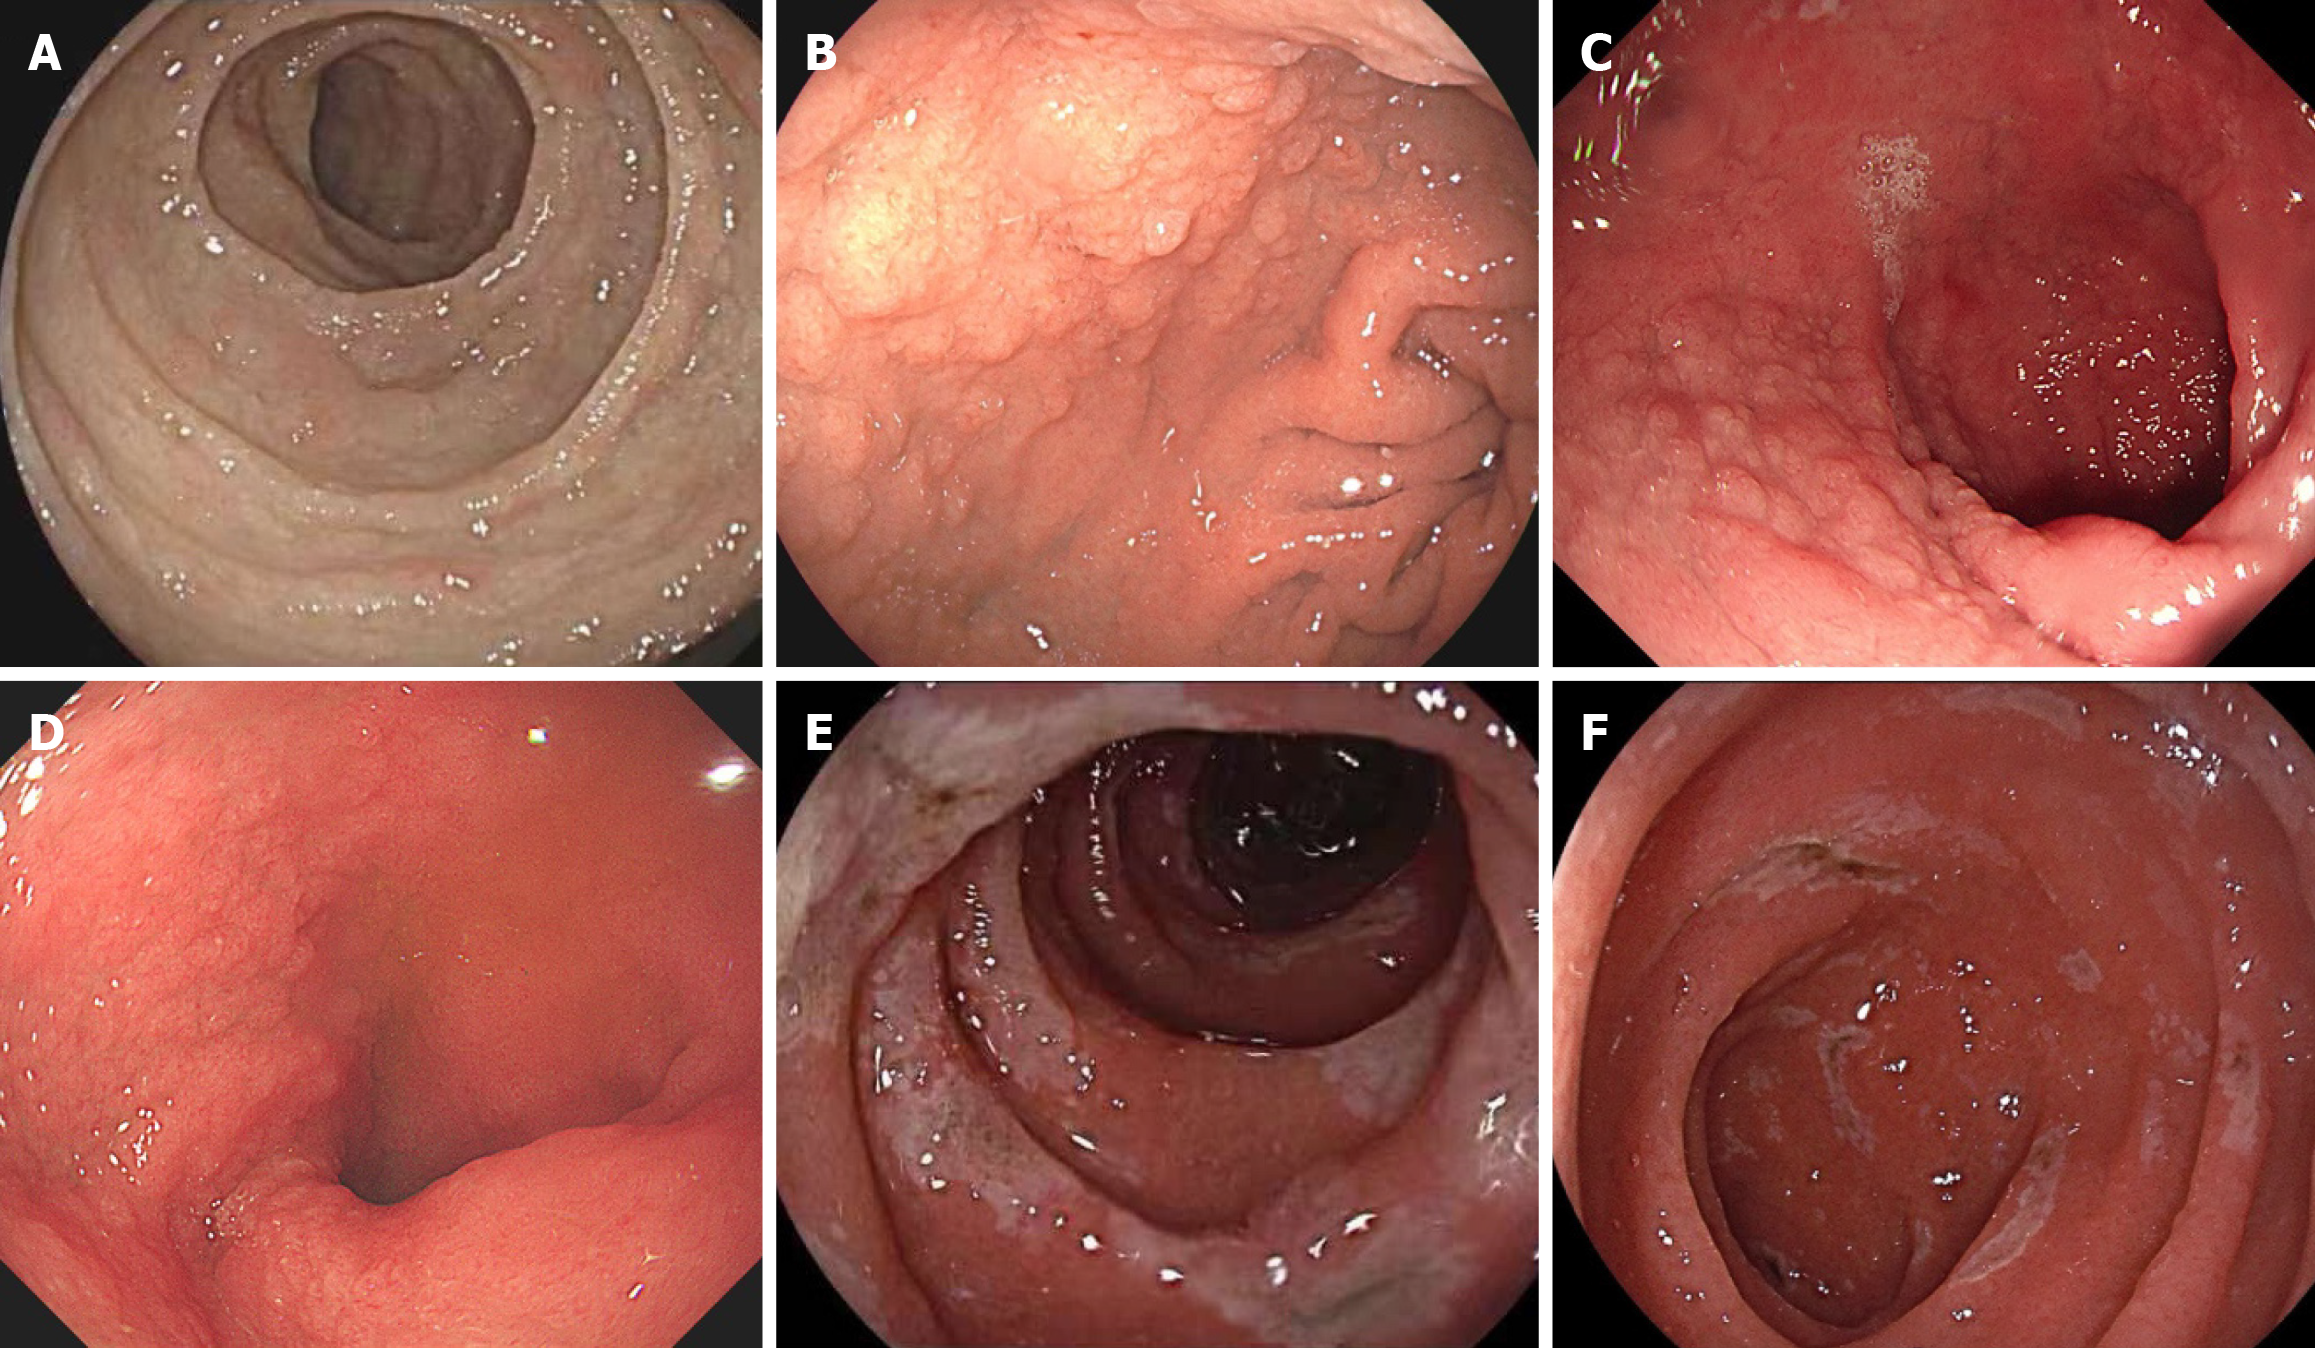
Figure 3 Index endoscopic features of autoimmune enteropathy patients.
A: Short villi and scalloped folds in the descending duodenum; B and C: Mucosa thinning and nodular changes in the duodenal bulb or retrobulbar; D: Duodenal post-bulbar mosaic mucosa; E and F: Ulcer in the descending duodenum.
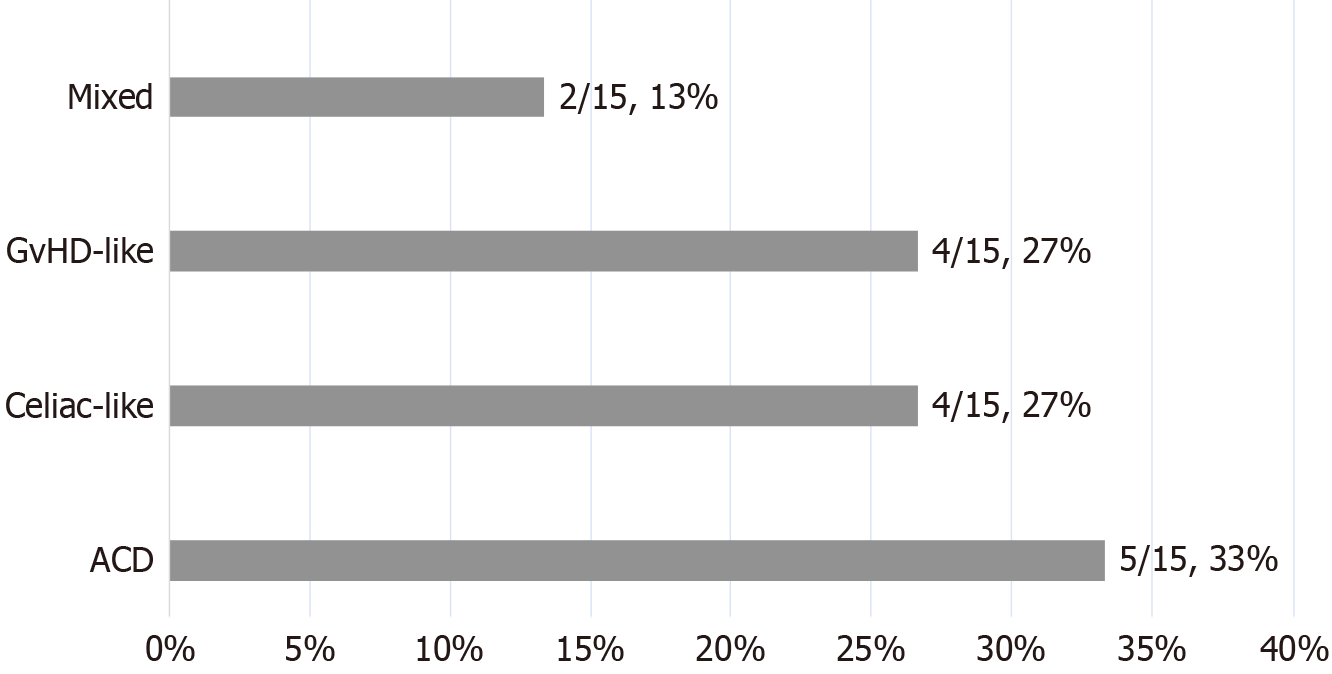
Figure 4 Histological classification of duodenal biopsies from autoimmune enteropathy patients.
ACD: Active chronic duodenitis; GvHD: Graft-versus-host disease.
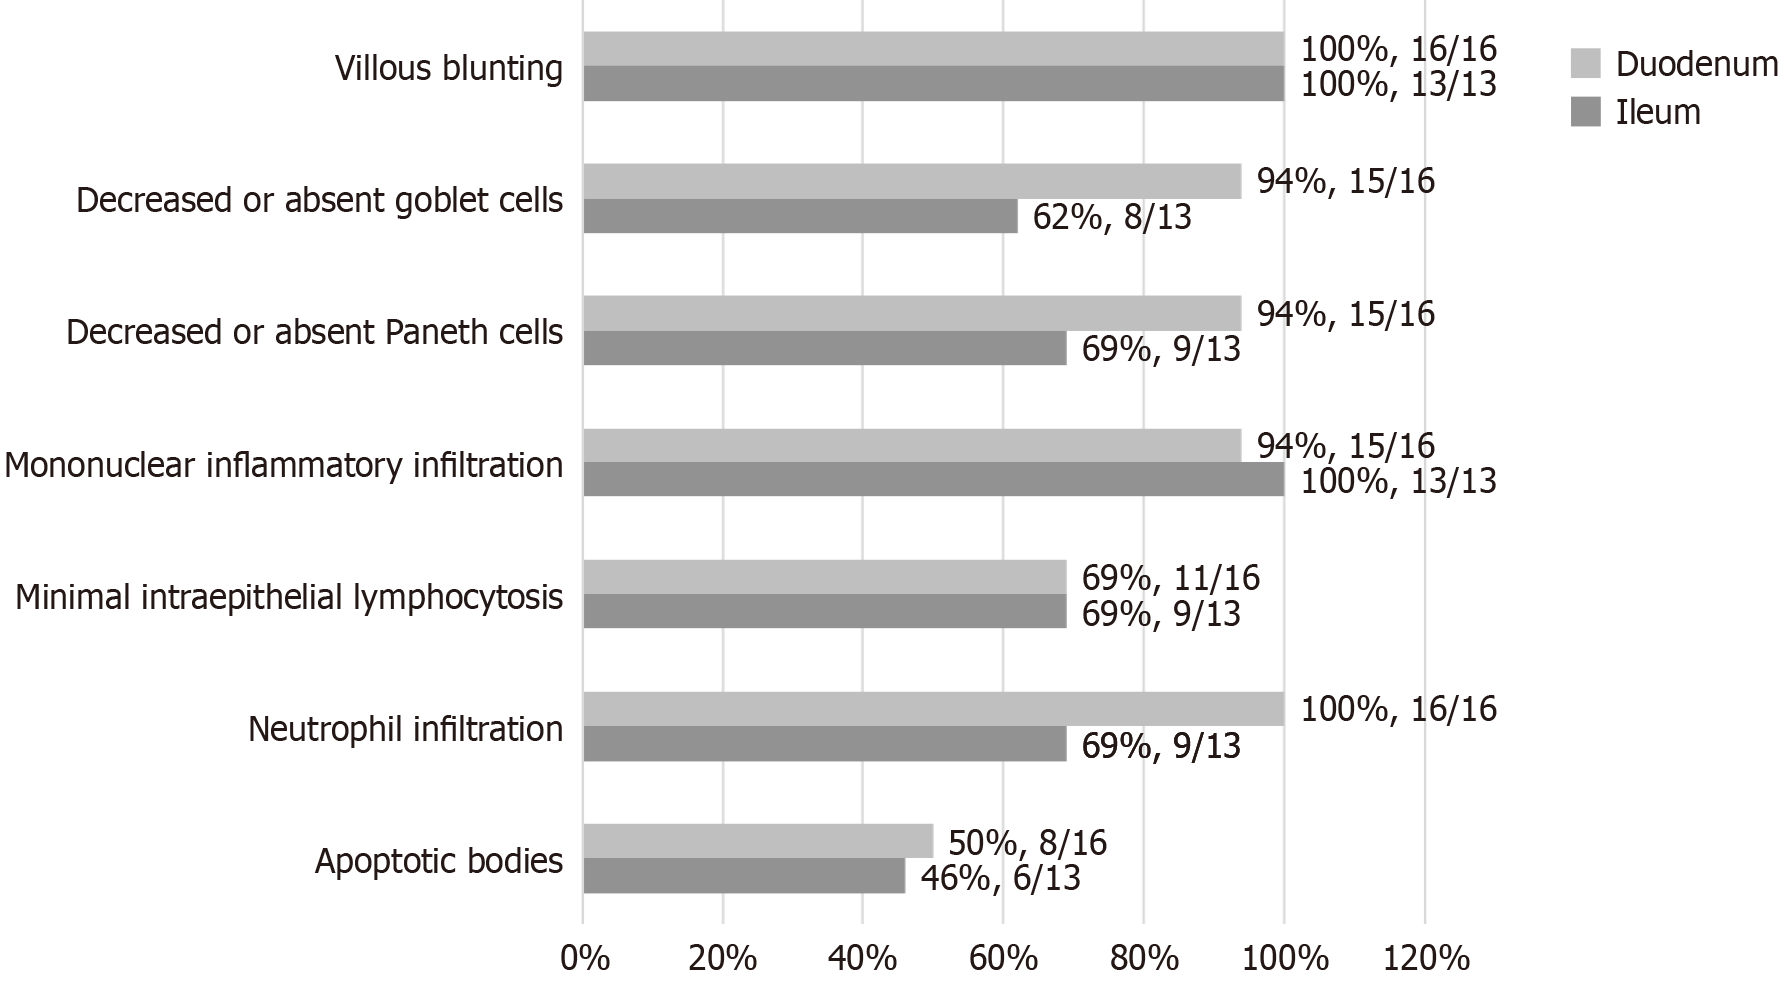
Figure 5 Histopathological manifestations of adult autoimmune enteropathy patients.
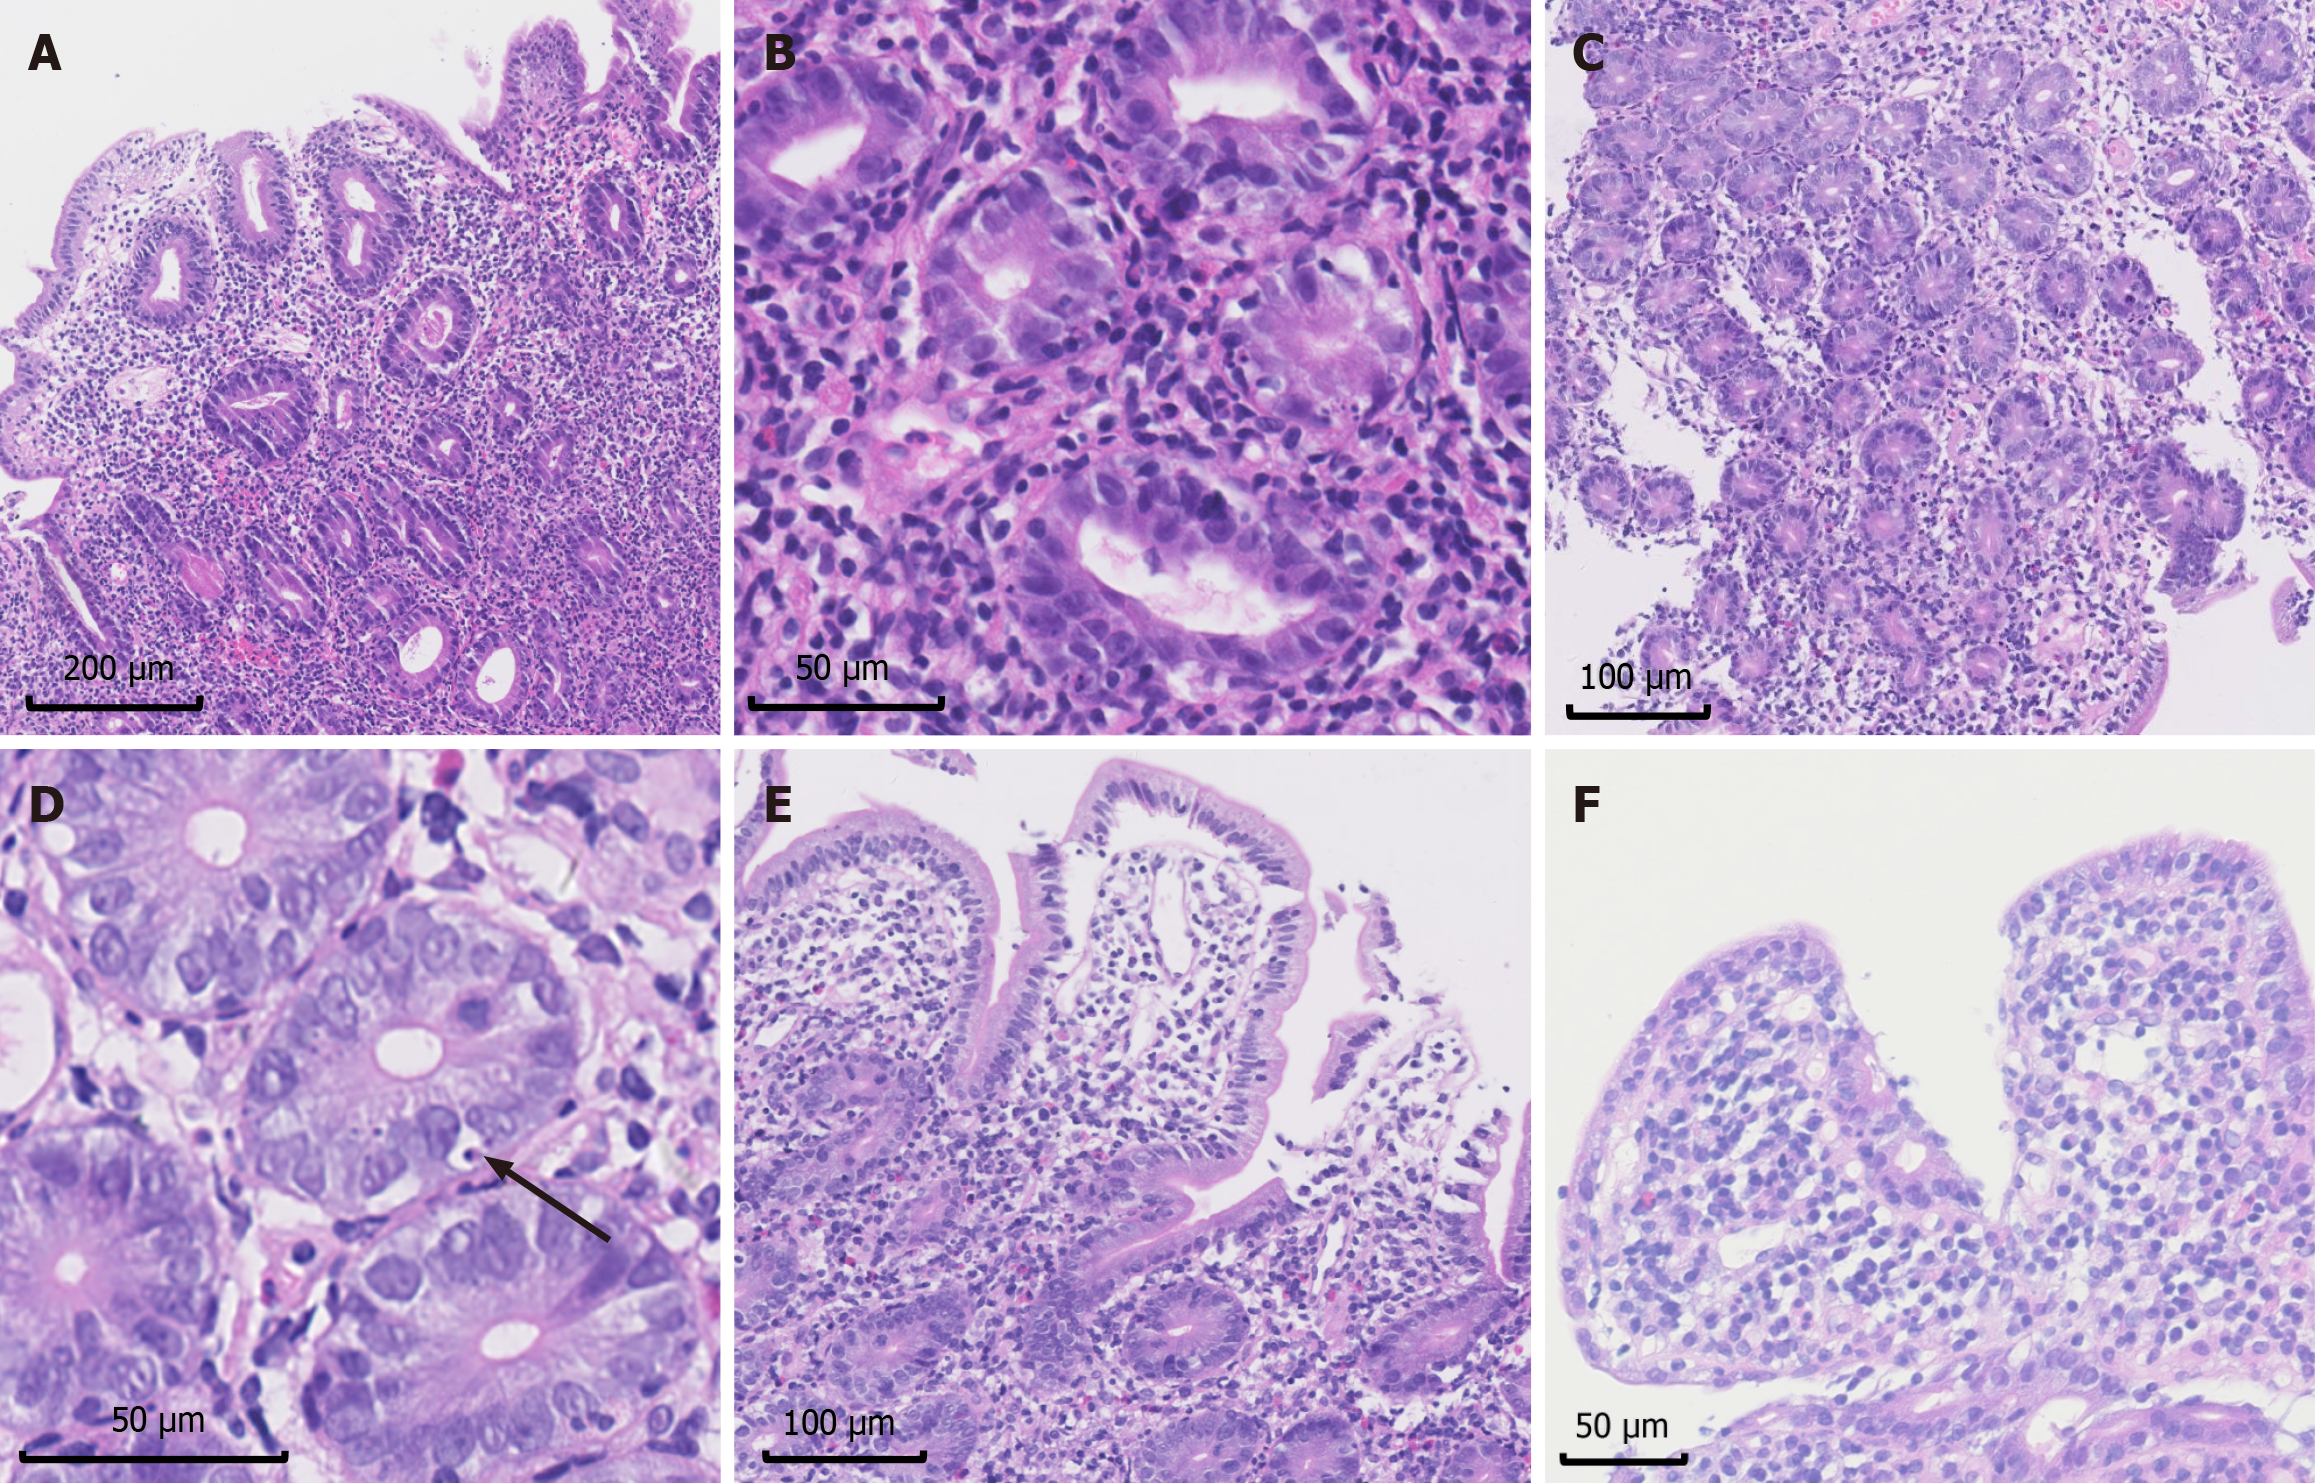
Figure 6 Images of characteristic histological manifestations in autoimmune enteropathy patients (hematoxylin and eosin staining).
A: Villous blunting (40 ×); B: Mononuclear inflammatory infiltration (200 ×); C: Absent goblet cells (40 ×); D: Increased apoptotic bodies (black arrow, 400 ×); E: Minimal intraepithelial lymphocytosis (200 ×); F: Intraepithelial lymphocytosis (200 ×).
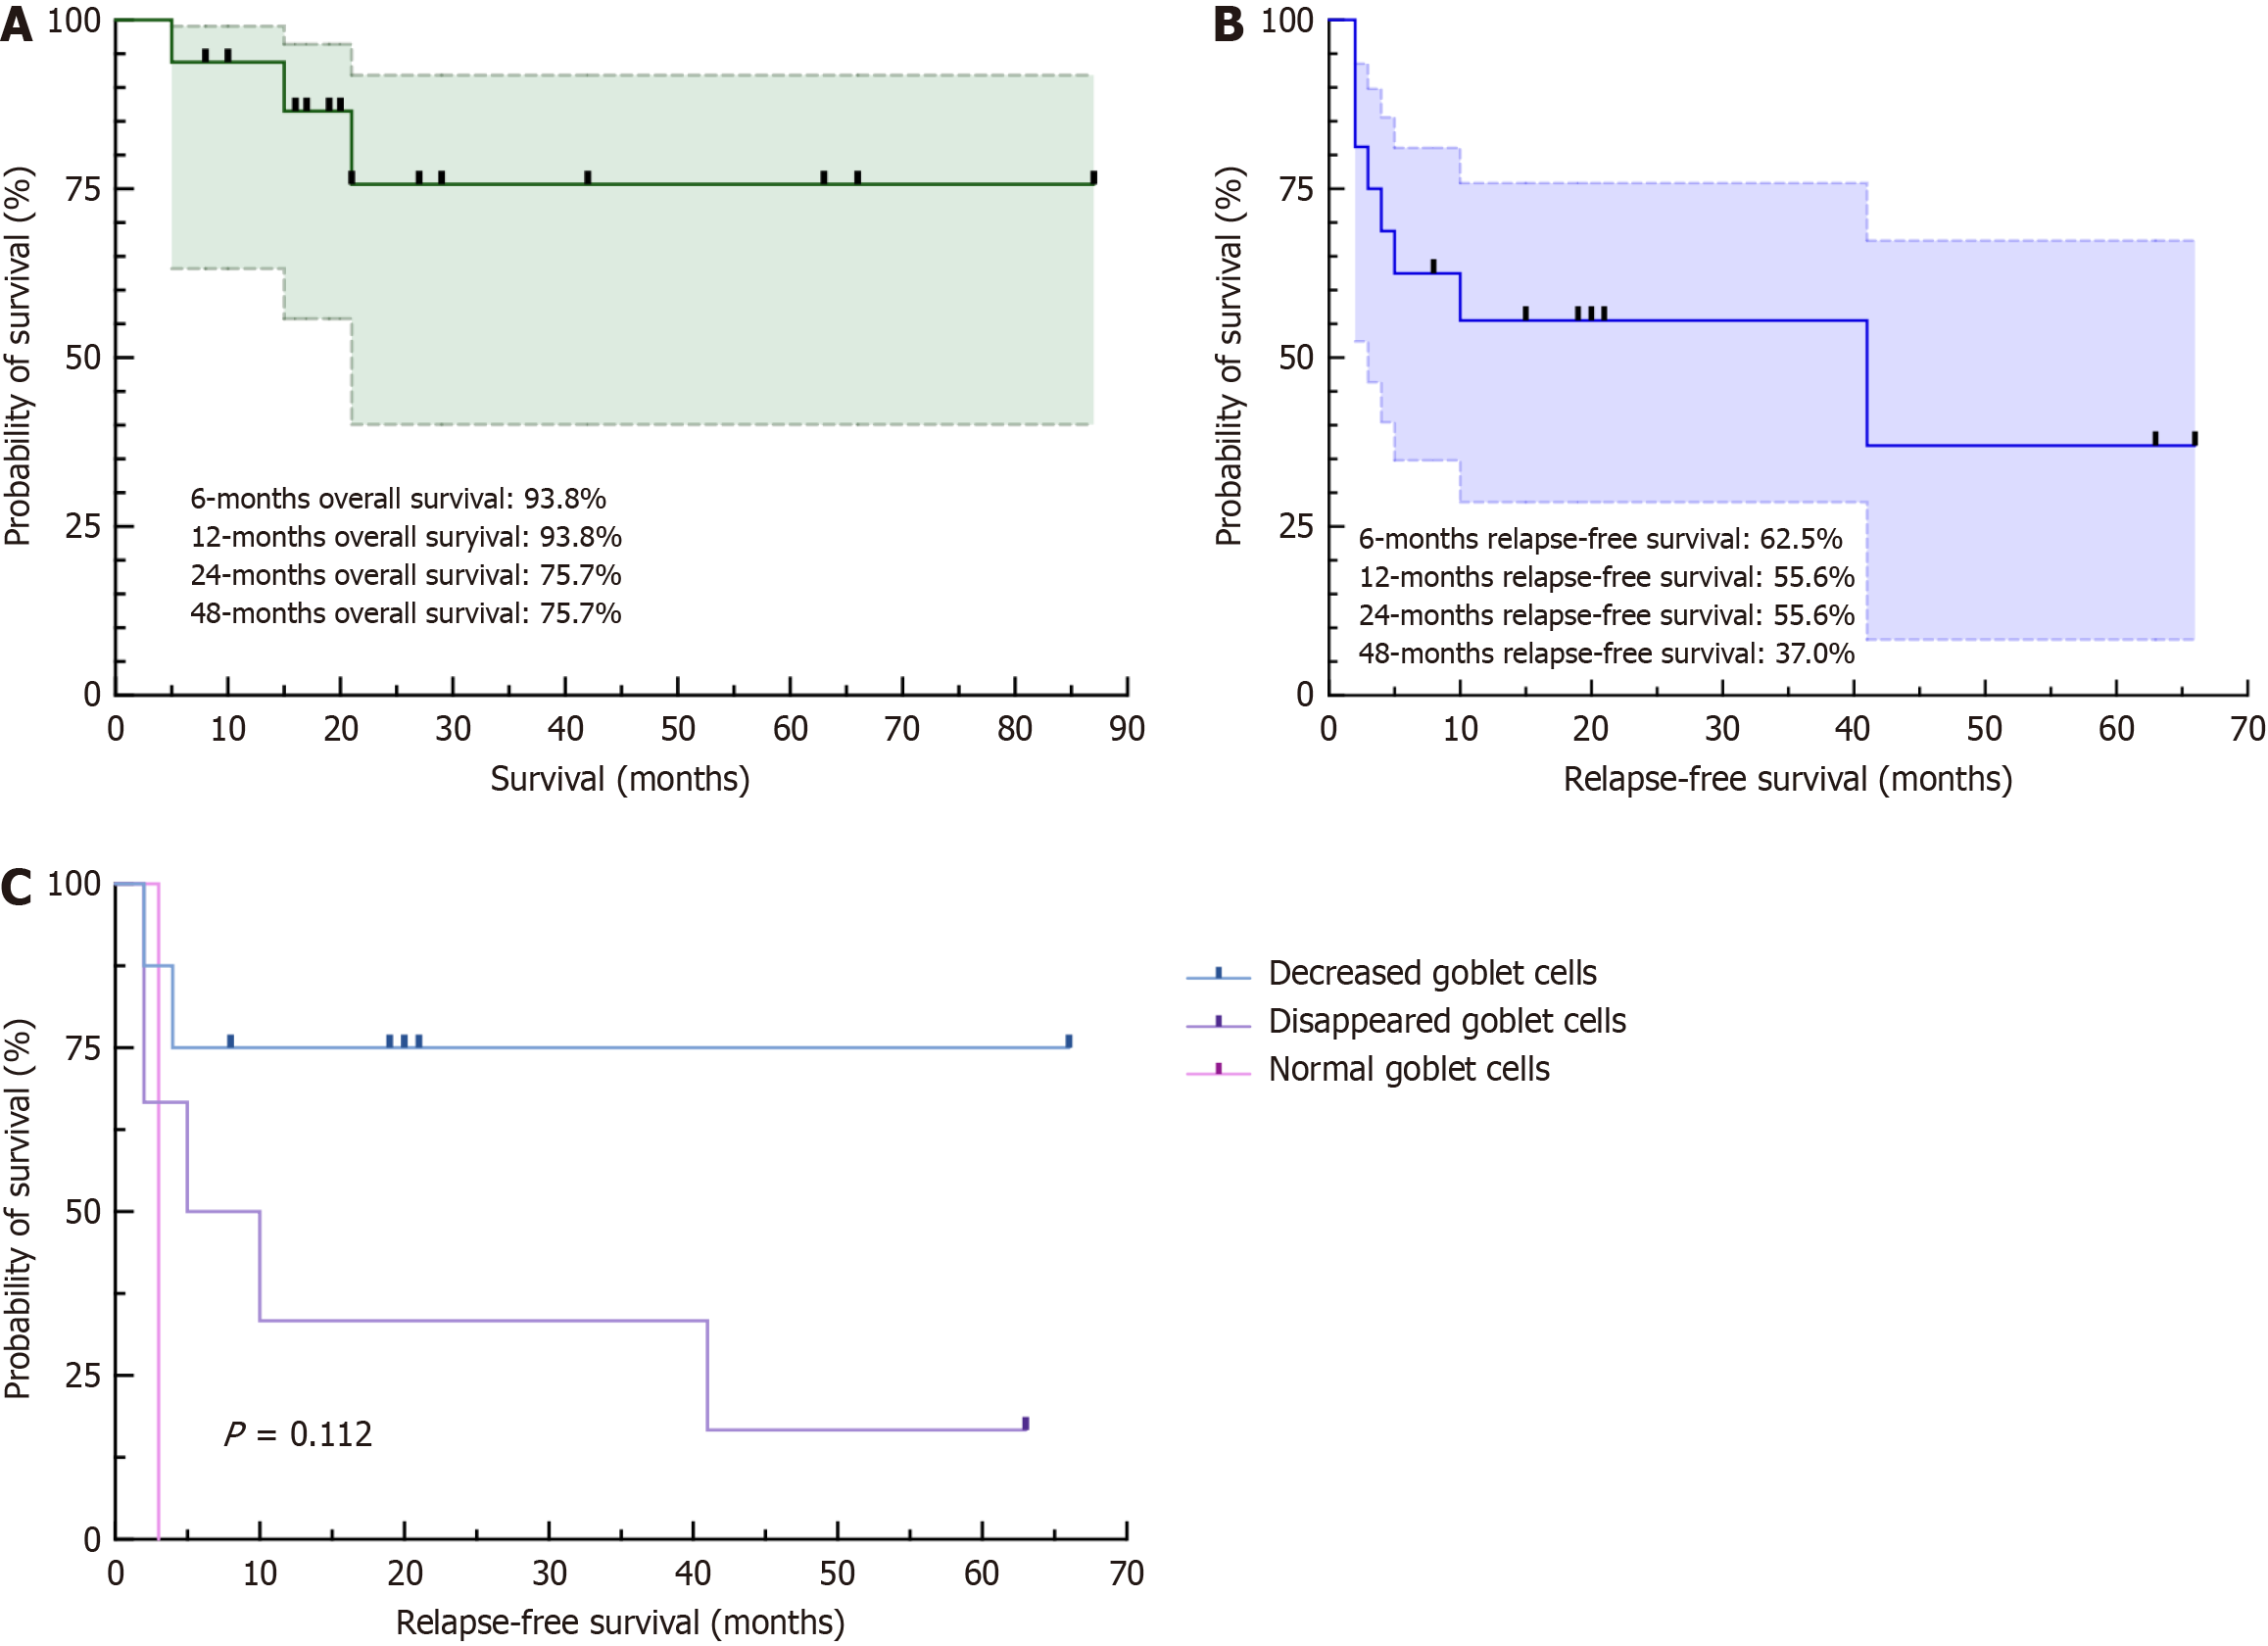
Figure 7 Kaplan-Meier survival curves of patients with autoimmune enteropathy.
A: Survival; B: Relapse-free survival; C: Prognostic factor of goblet cells.
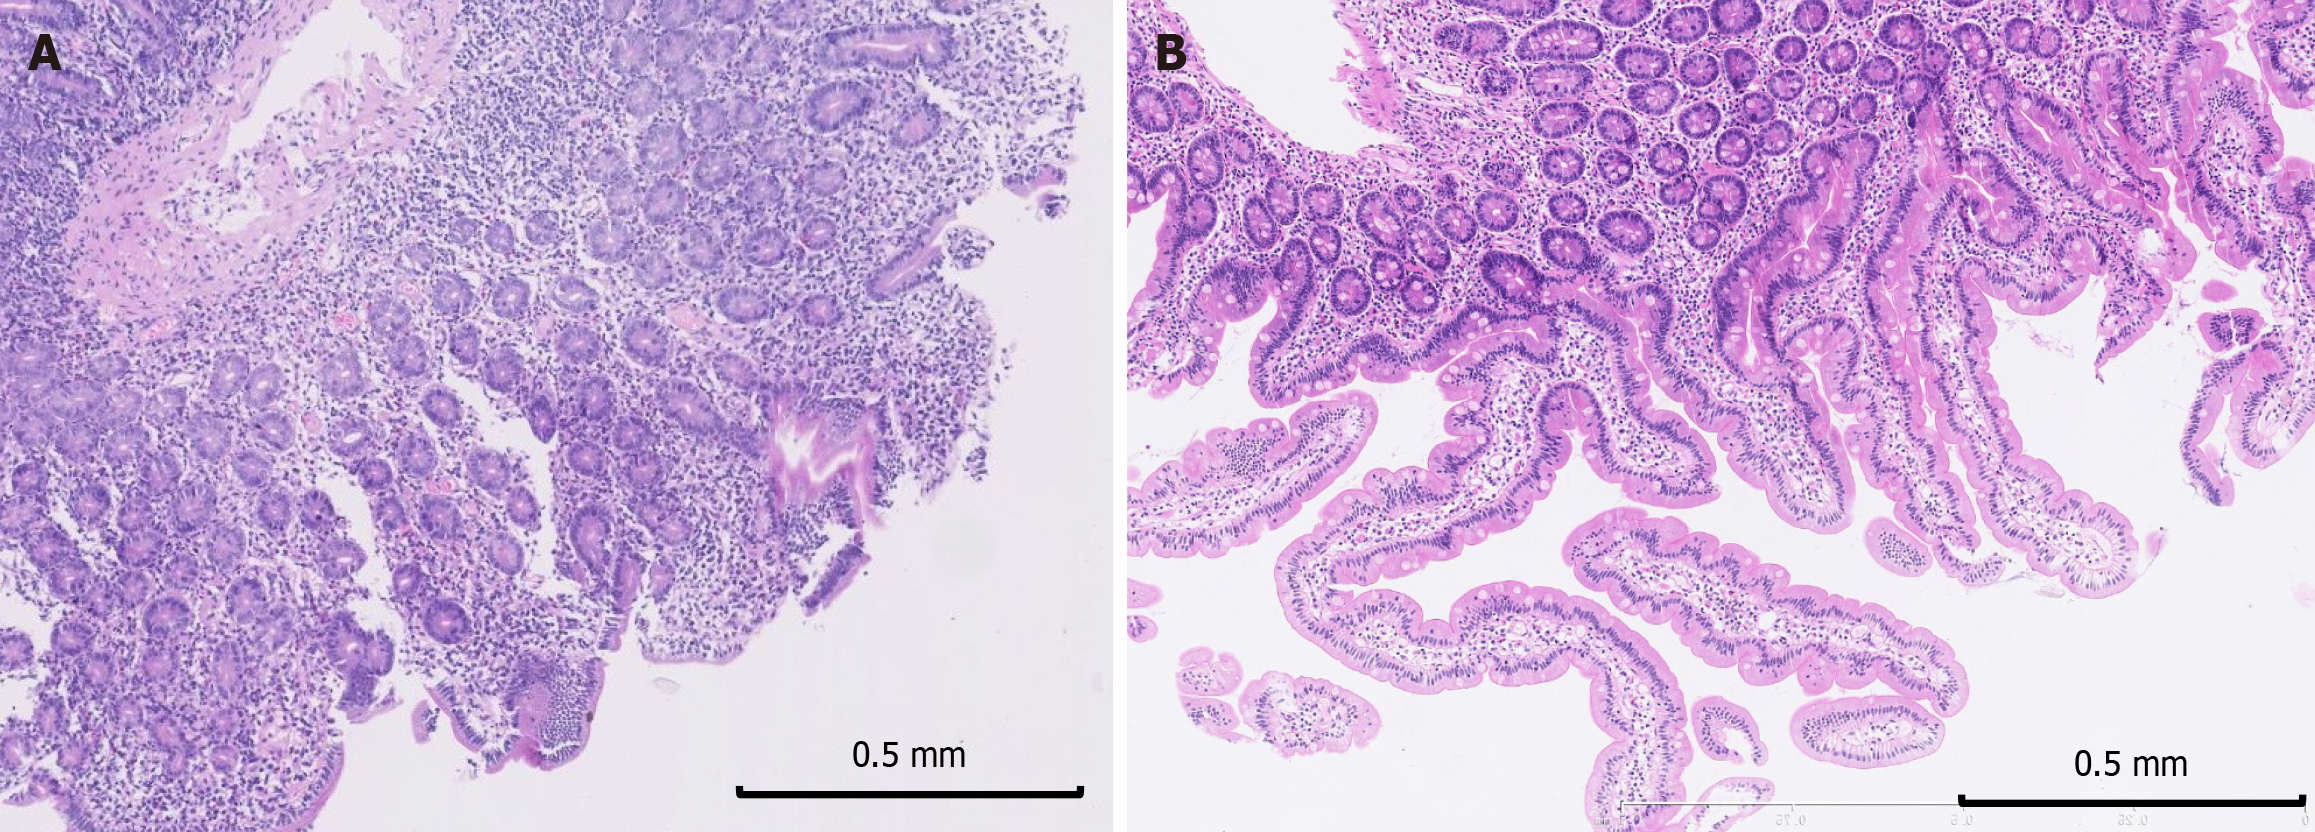
Figure 8 Prominent pathological improvement in one patient (P10) in long-term clinical remission (hematoxylin and eosin staining).
A: Before treatment (40 ×); B: After treatment (40 ×).
- Citation: Li MH, Ruan GC, Zhou WX, Li XQ, Zhang SY, Chen Y, Bai XY, Yang H, Zhang YJ, Zhao PY, Li J, Li JN. Clinical manifestations, diagnosis and long-term prognosis of adult autoimmune enteropathy: Experience from Peking Union Medical College Hospital. World J Gastroenterol 2024; 30(19): 2523-2537
- URL: https://www.wjgnet.com/1007-9327/full/v30/i19/2523.htm
- DOI: https://dx.doi.org/10.3748/wjg.v30.i19.2523


