Copyright
©The Author(s) 1997.
World J Gastroenterol. Mar 15, 1997; 3(1): 3-5
Published online Mar 15, 1997. doi: 10.3748/wjg.v3.i1.3
Published online Mar 15, 1997. doi: 10.3748/wjg.v3.i1.3
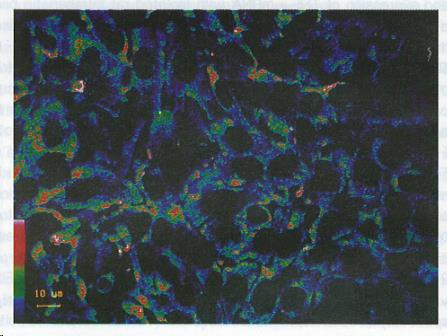
Figure 1 Fluorescent reactions to lipopolysaccharides in cultured intrahepatic bile duct epithelial cells.
Positive reactions were obvious in the cytoplasm. The color bar in the bottom on the left side shows the fluorescent intensities (the highest is red and the lowest green).
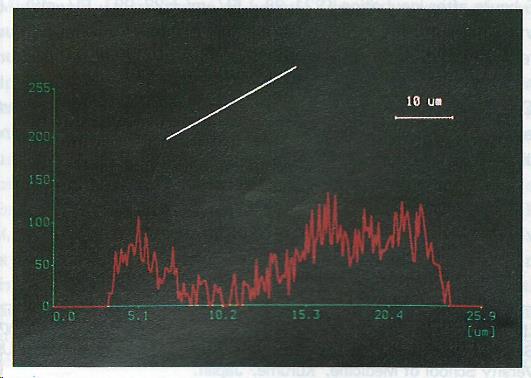
Figure 2 Fluorescent reactions to TNF-α-mRNA in cultured intrahepatic bile duct epithelial cells.
Positive reactions were found in the cytoplasm and nuclei of the cells. The chart shows the fluorescent intensities along the line through the cells as indicated.
- Citation: Chen XM, Han DW, Noguchi K, Tanikawa K. Uptake of bacterial lipopolysaccharide and expression of tumor necrosis factor-α-mRNA in isolated rat intrahepatic bile duct epithelial cells. World J Gastroenterol 1997; 3(1): 3-5
- URL: https://www.wjgnet.com/1007-9327/full/v3/i1/3.htm
- DOI: https://dx.doi.org/10.3748/wjg.v3.i1.3


