Copyright
©The Author(s) 2022.
World J Gastroenterol. Feb 7, 2022; 28(5): 532-546
Published online Feb 7, 2022. doi: 10.3748/wjg.v28.i5.532
Published online Feb 7, 2022. doi: 10.3748/wjg.v28.i5.532
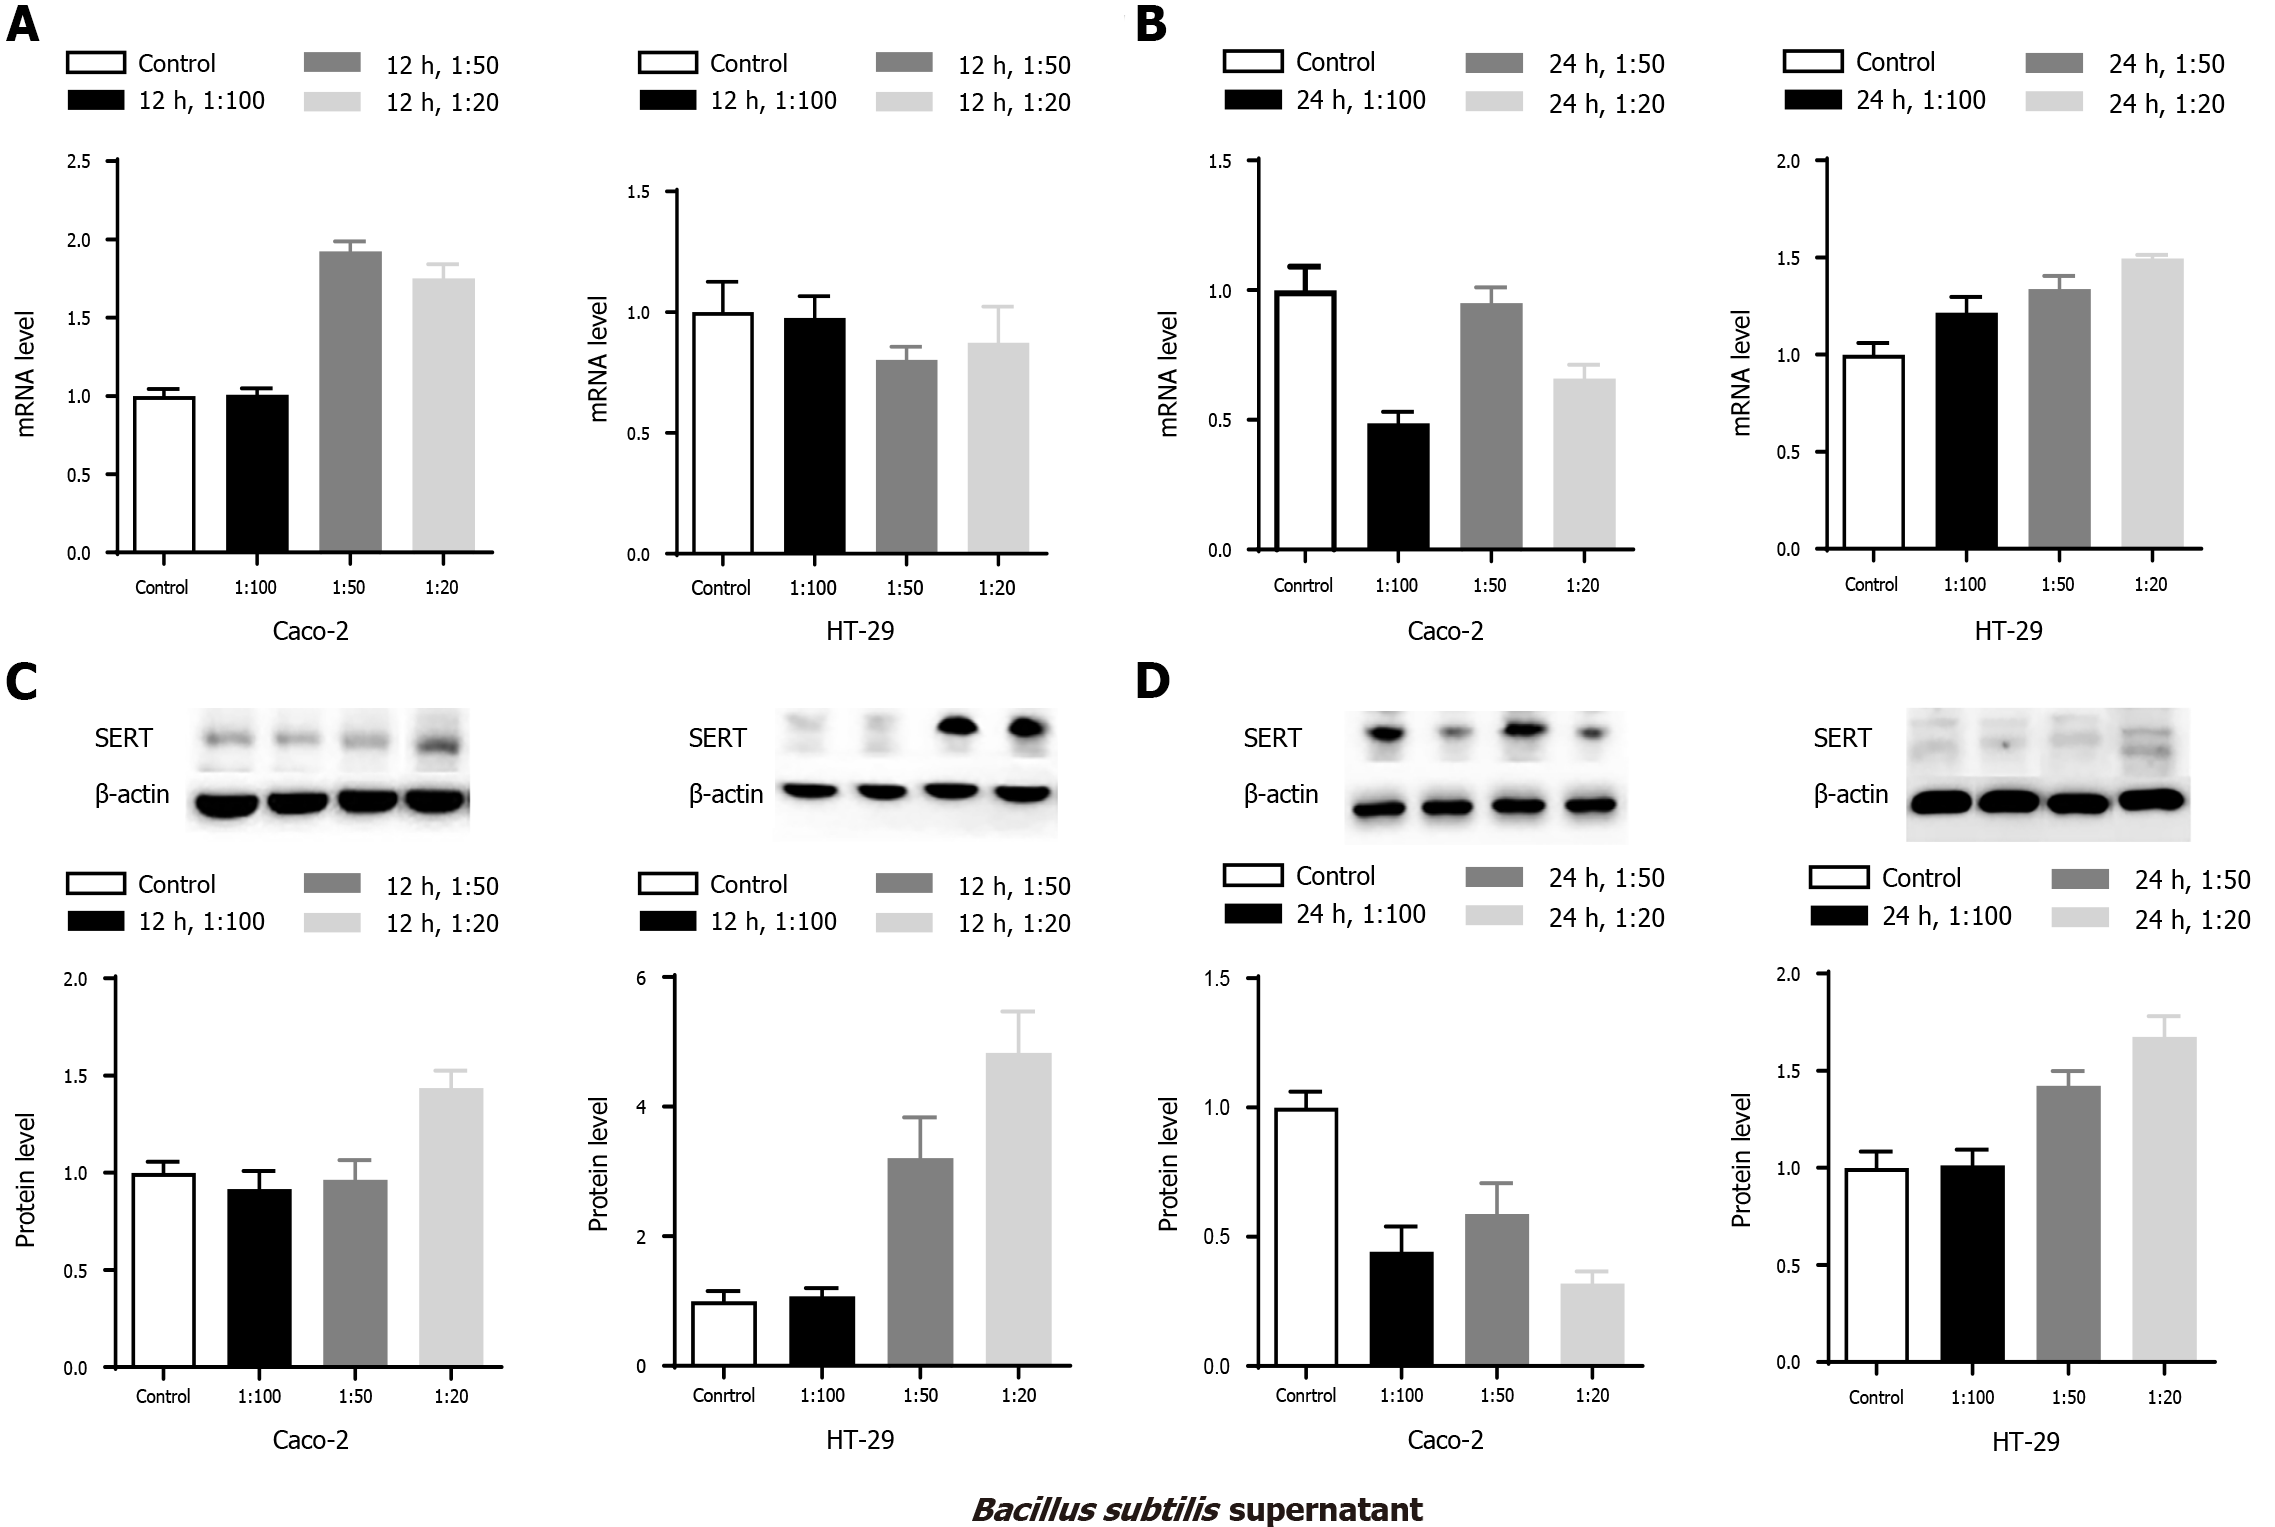
Figure 1 Effects of Bacillus subtilis supernatant on serotonin transporter mRNA and protein expression in Caco-2 and HT-29 cells.
A: Serotonin transporter (SERT) mRNA levels at 12 h; B: SERT mRNA levels at 24 h; C: Quantitative analysis of SERT protein levels at 12 h; D: Quantitative analysis of SERT protein levels at 24 h.
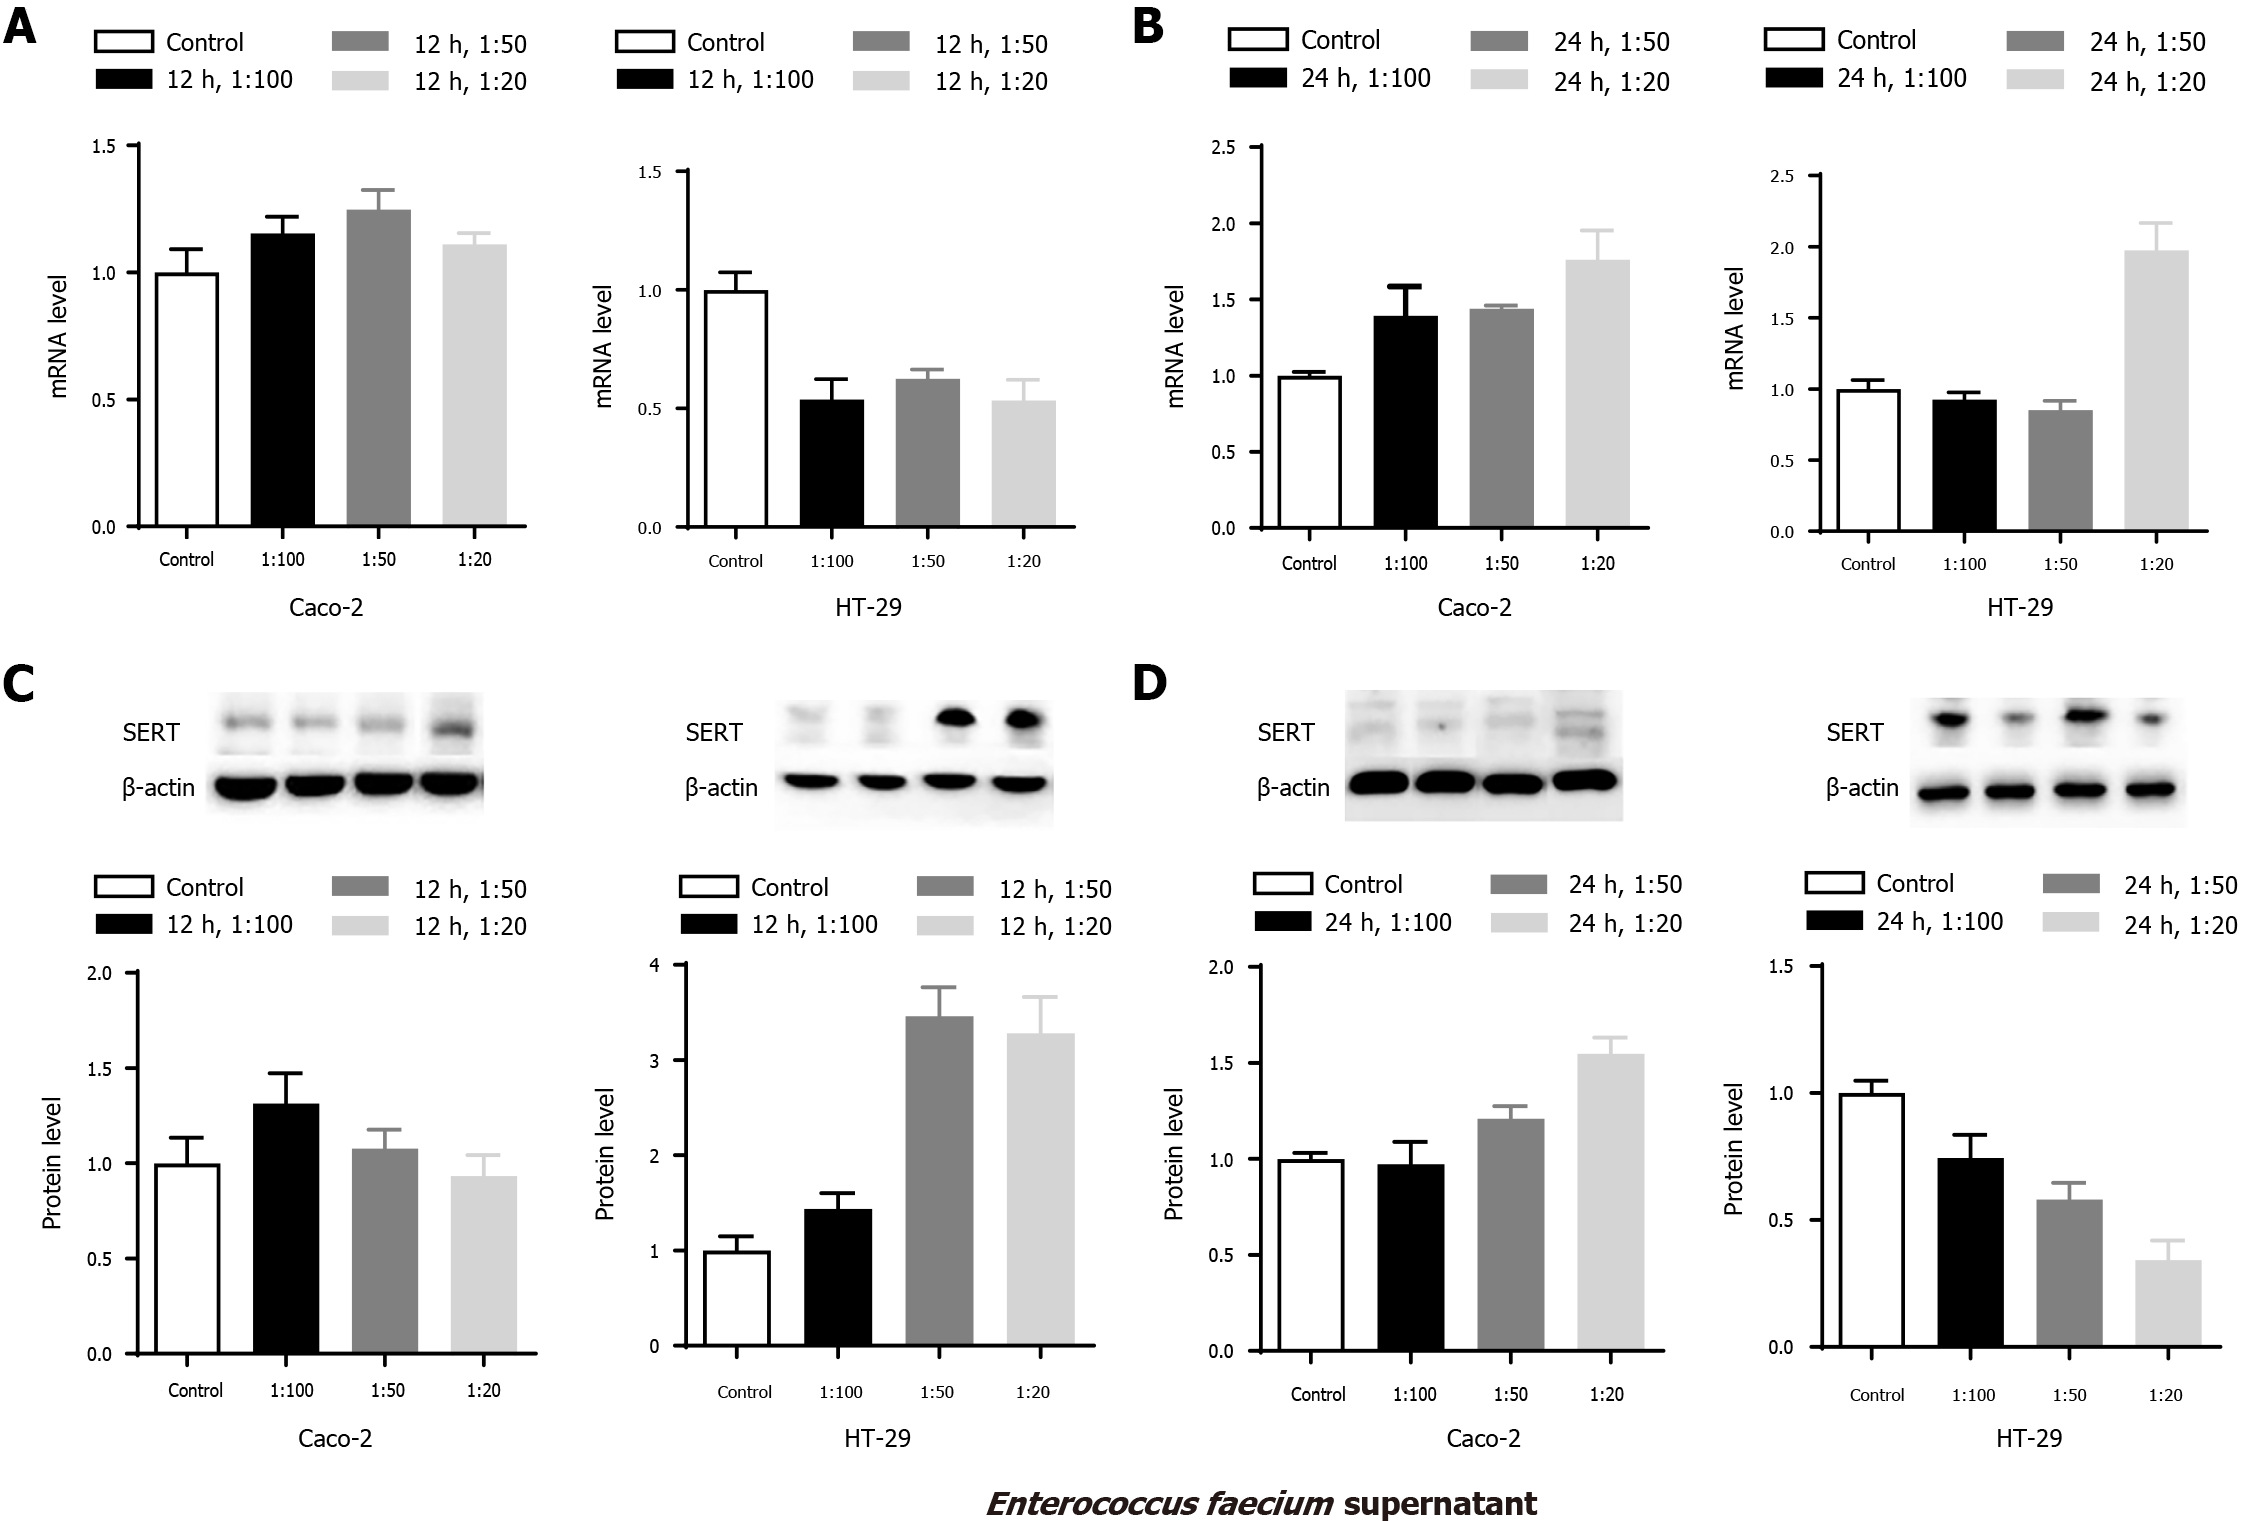
Figure 2 Effects of Enterococcus faecium supernatant on serotonin transporter mRNA and protein expression in Caco-2 and HT-29 cells.
A: Serotonin transporter (SERT) mRNA levels at 12 h; B: SERT mRNA levels at 24 h; C: Quantitative analysis of SERT protein levels at 12 h; D: Quantitative analysis of SERT protein levels at 24 h.
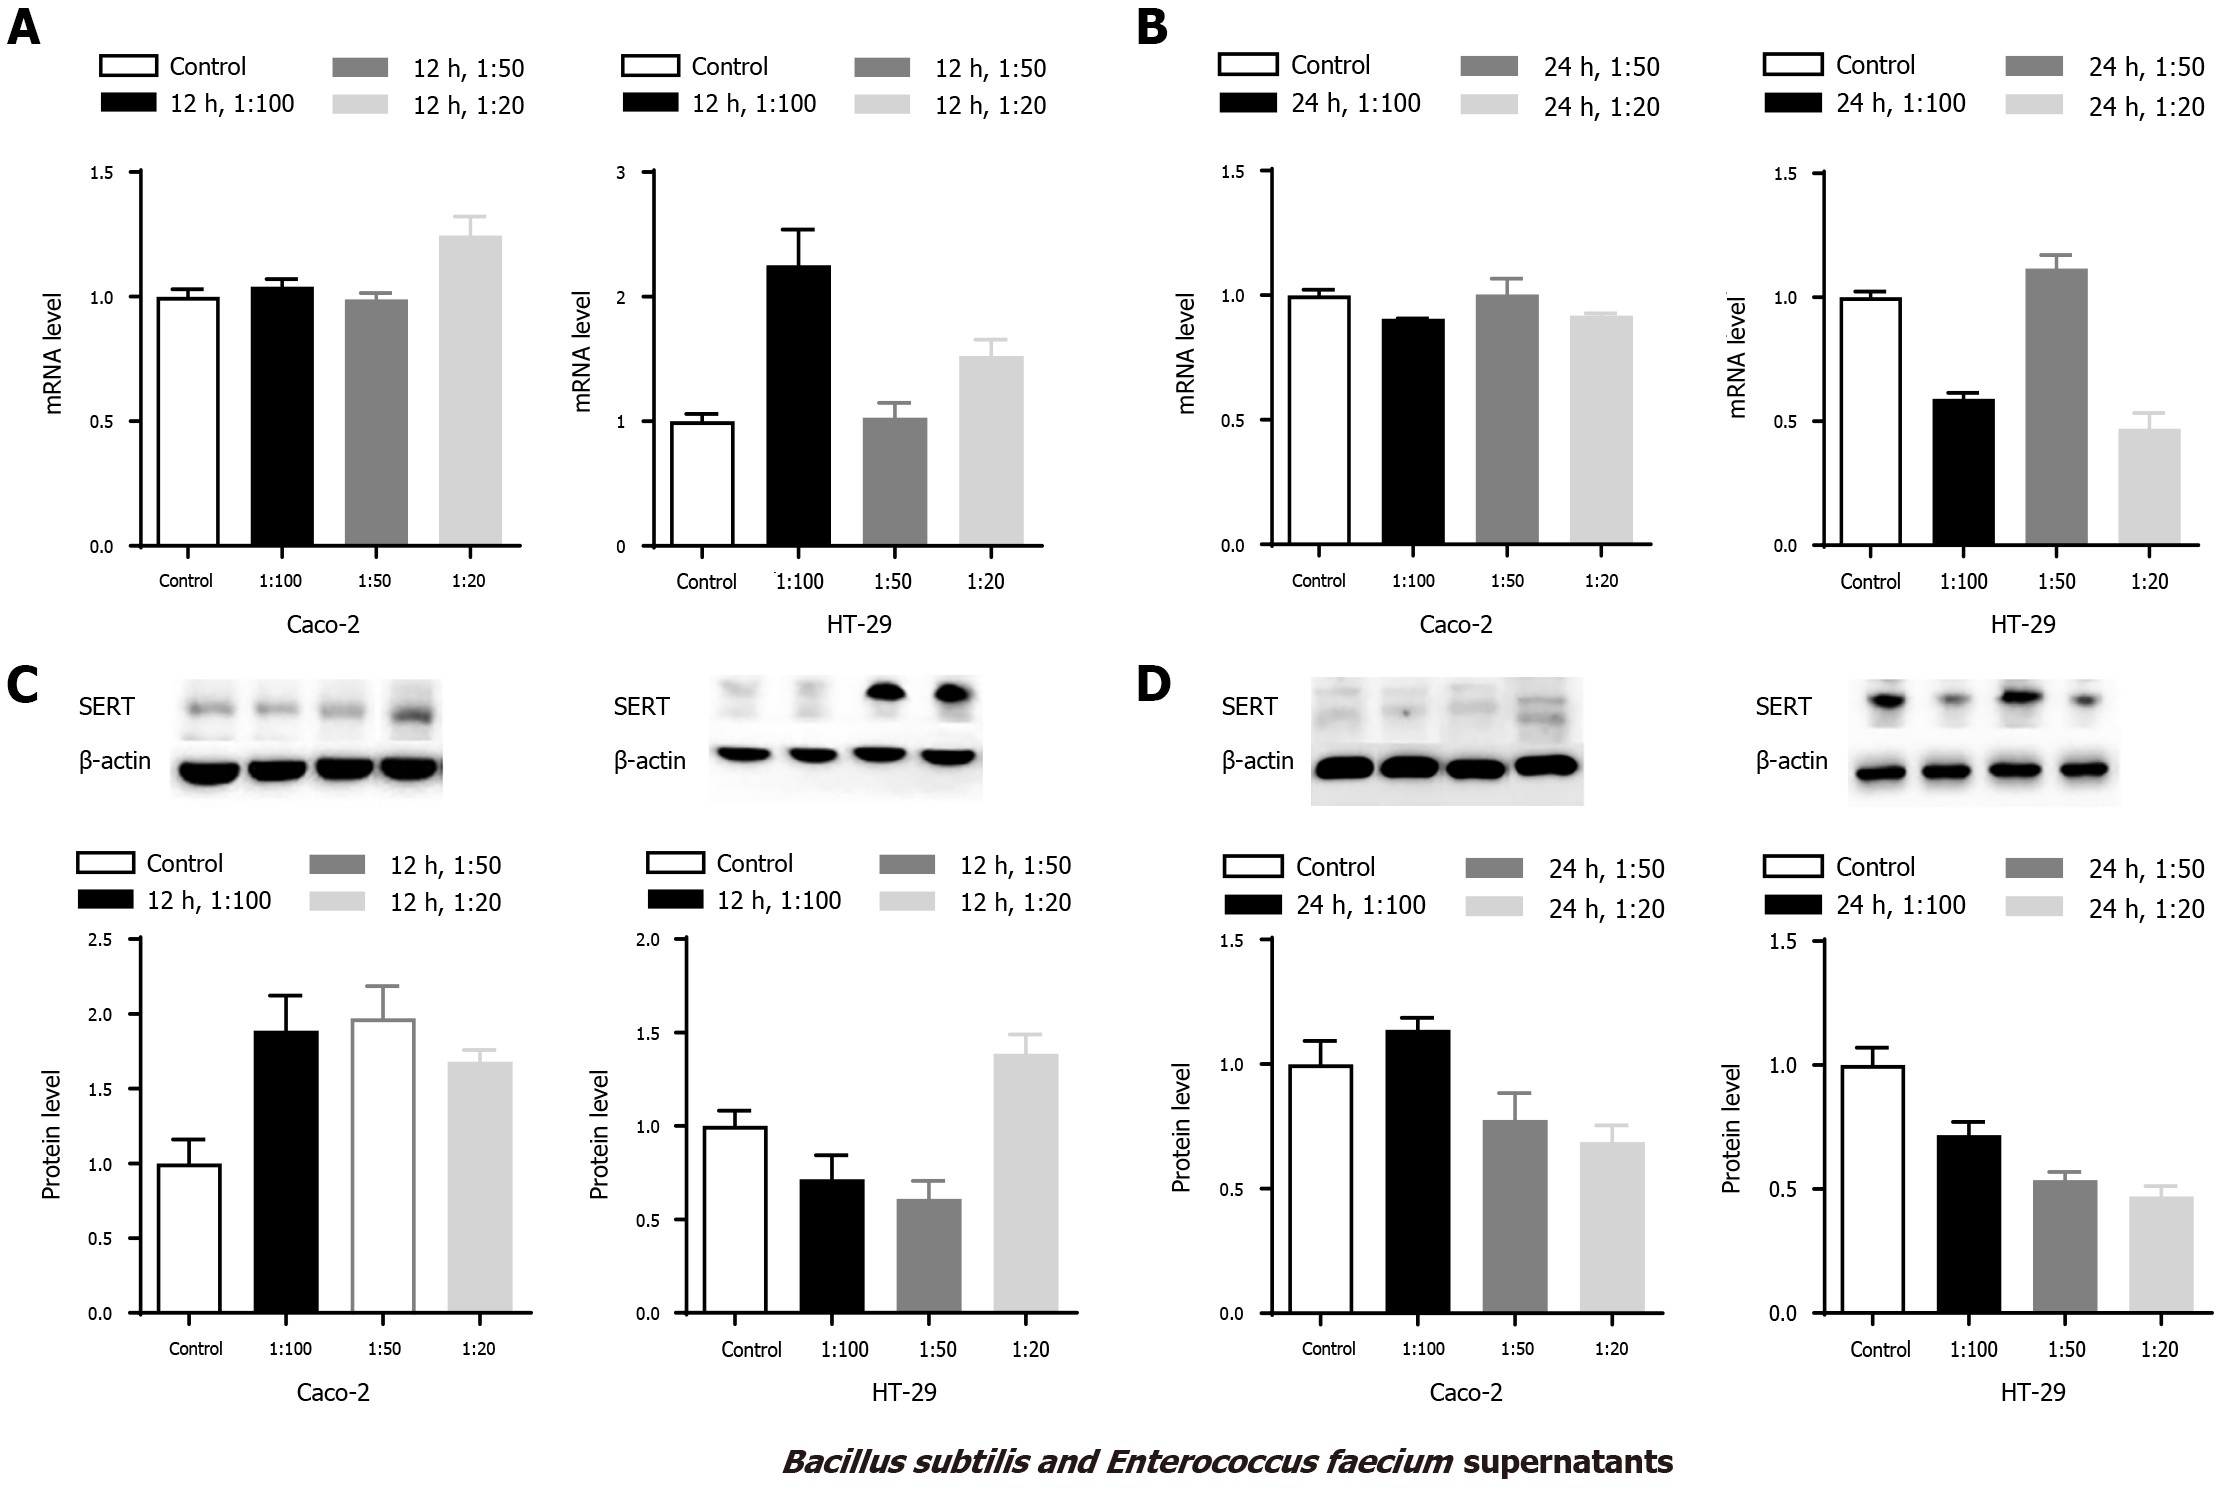
Figure 3 Effects of Bacillus subtilis and Enterococcus faecium supernatants on serotonin transporter mRNA and protein expression in Caco2 and HT-29 cells.
A: Serotonin transporter (SERT) mRNA levels at 12 h; B: SERT mRNA levels at 24 h; C: Quantitative analysis of SERT protein levels at 12 h; D: Quantitative analysis of SERT protein levels at 24 h.
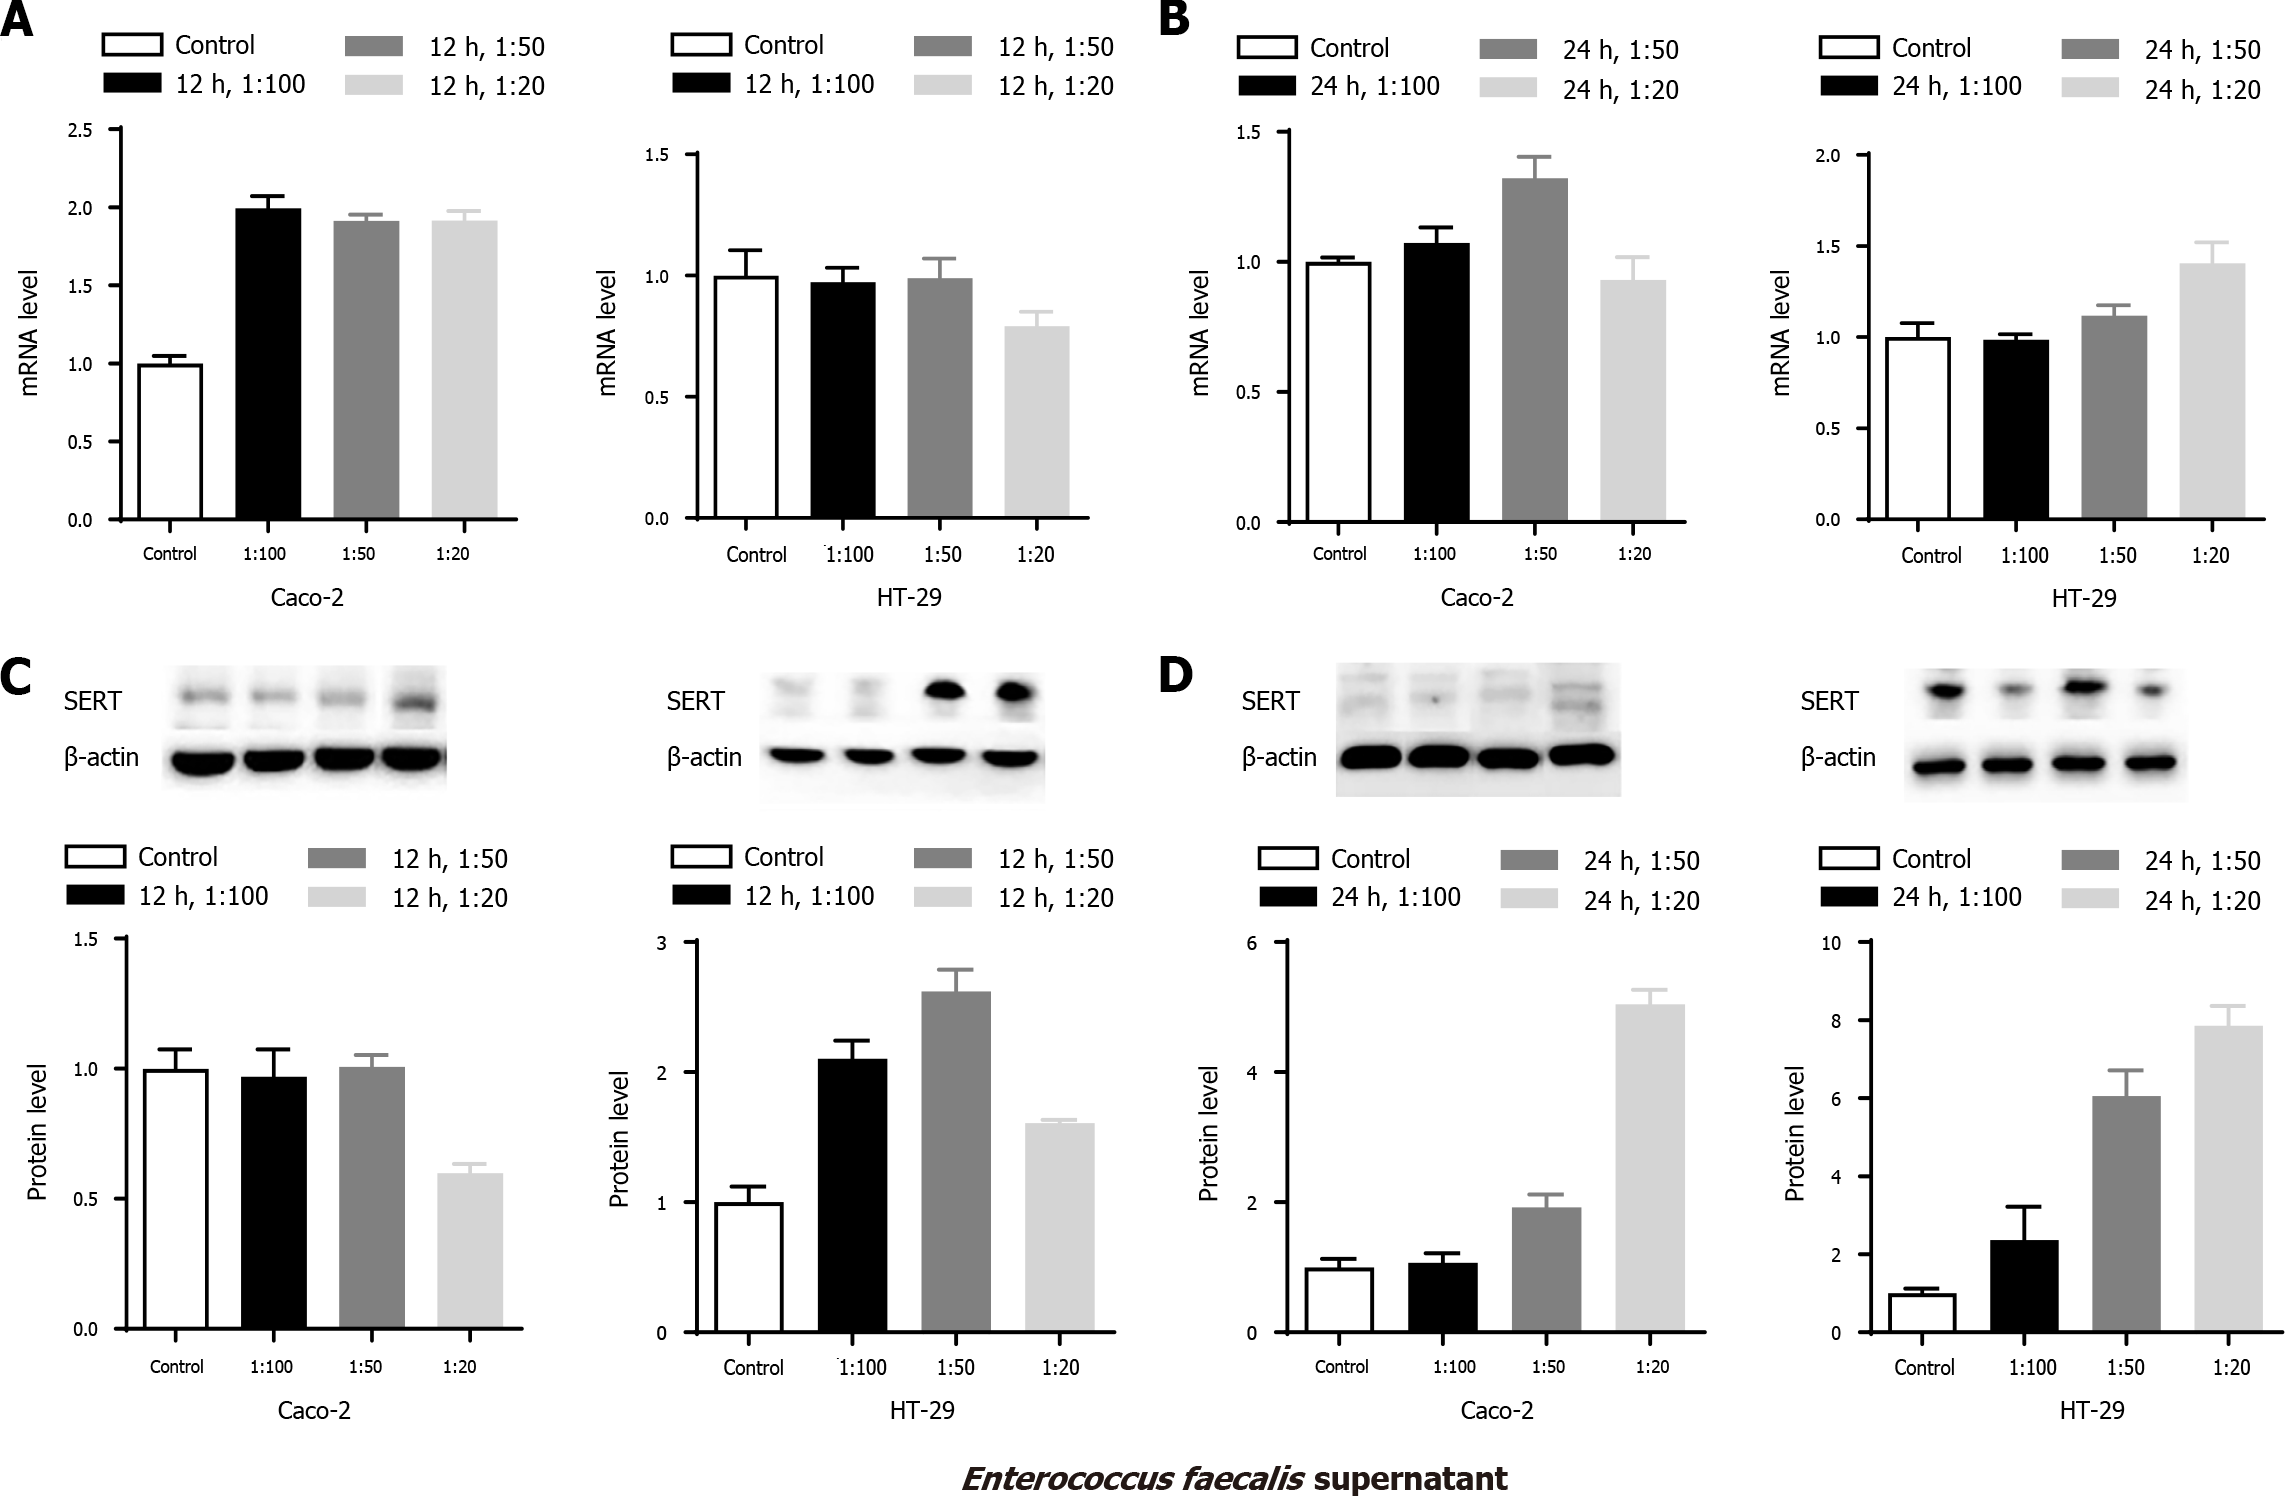
Figure 4 Effects of Enterococcus faecalis supernatant on serotonin transporter mRNA and protein expression in Caco-2 and HT-29 cells.
A: Serotonin transporter (SERT) mRNA levels at 12 h; B: SERT mRNA levels at 24 h; C: Quantitative analysis of SERT protein levels at 12 h; D: Quantitative analysis of SERT protein levels at 24 h.
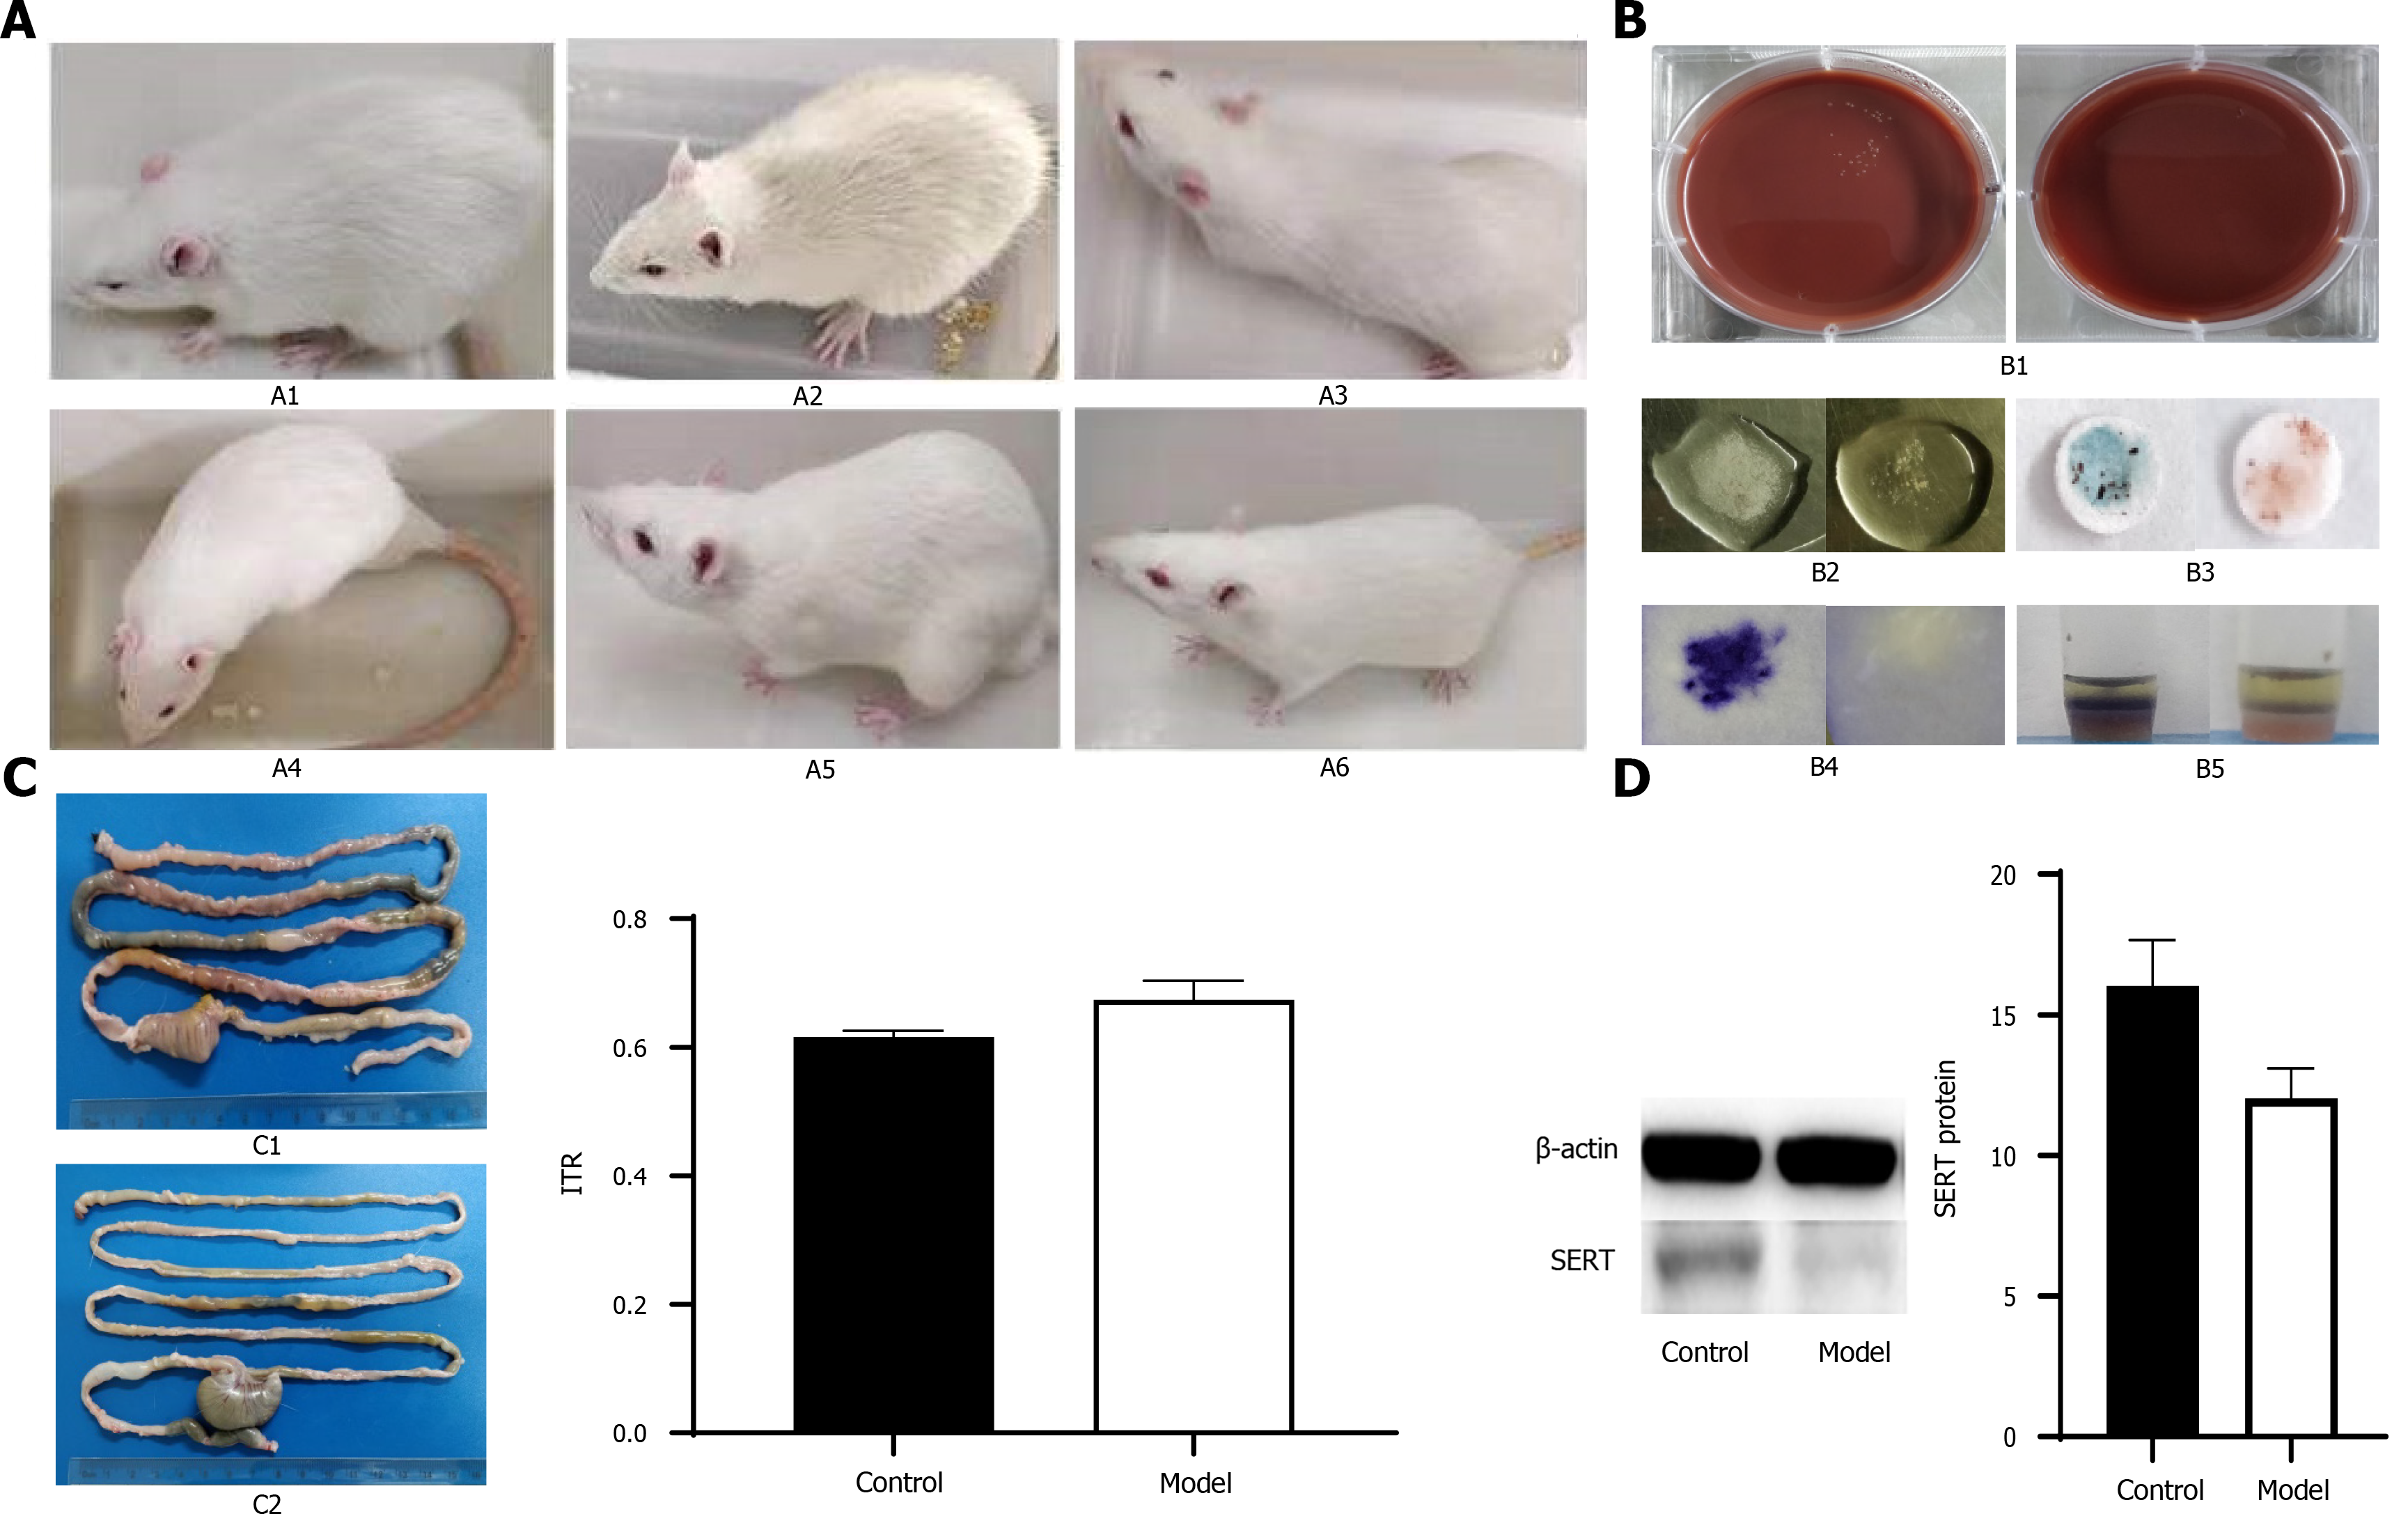
Figure 5 Rat model of post-infectious irritable bowel syndrome.
A: Appearance changes of experimental rats; A1: model rats on the 7th day after gavage; A2: the 14th day after gavage; A3: The 28th d after gavage; A4: the 42nd d after gavage; A5: the 56th day after gavage; A6: the normal control group; B: Fecal culture and biochemical detection of Campylobacter jejuni B1: Campylobacter jejuni culture; B2: catalase test; B3: indole acetate test; B4: oxidase test; e: sodium hippurate hydrolysis test (a-e pictures show that the left picture is positive, the right picture is negative); C: Intestinal transport (ITR) experiment C1: Pylorus to rectal segment in model group; C2: Pyloric to rectal segment in control group; C3: Comparison of ITR histogram (aP < 0.05); D: Expression of serotonin transporter (SERT) protein in the colon during the evaluation period after model evaluation and measurement of ITR experiment. Colon tissue was taken for western blotting to measure SERT level, and quantitative analysis of protein band gray level was used (aP < 0.05).
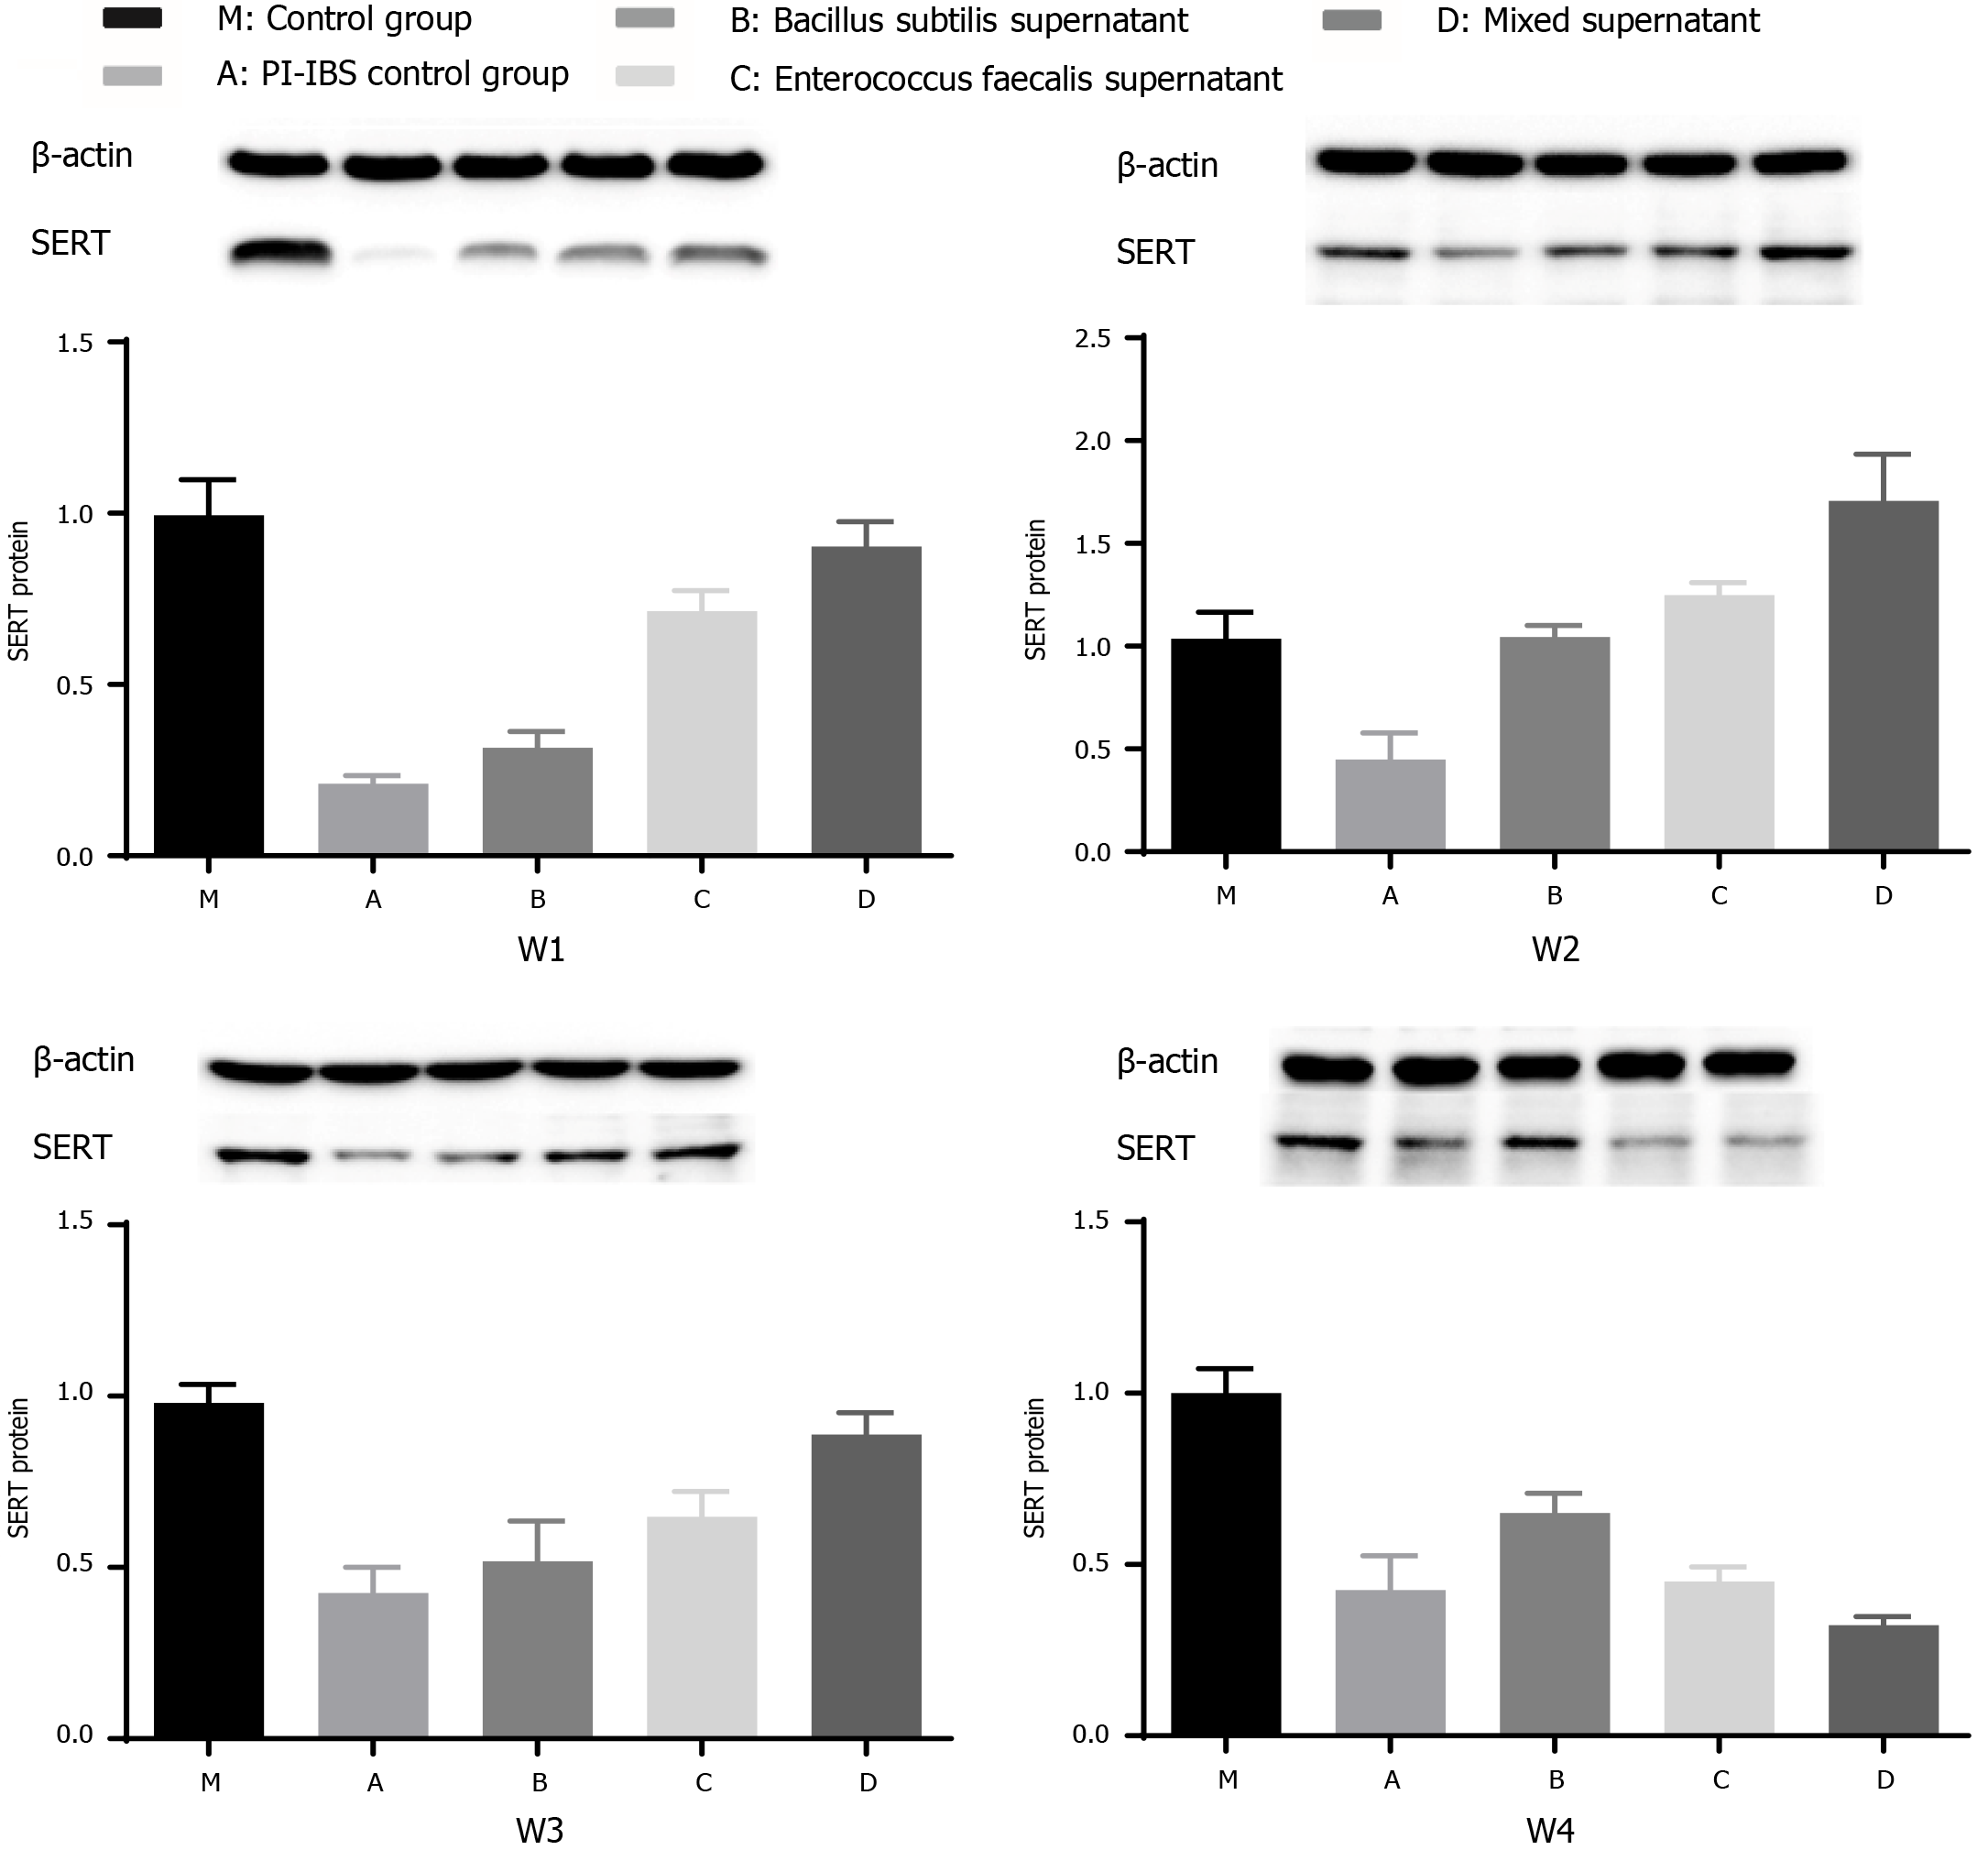
Figure 6 Effects of different supernatants of probiotics on serotonin transporter protein expression in rat intestinal tissues.
Quantitative analysis of serotonin transporter (SERT) protein levels in the 1st wk (W1), 2nd wk (W2), 3rd wk (W3), and 4th wk (W4) analyzed by western blotting.
- Citation: Chen YM, Li Y, Wang X, Wang ZL, Hou JJ, Su S, Zhong WL, Xu X, Zhang J, Wang BM, Wang YM. Effect of Bacillus subtilis, Enterococcus faecium, and Enterococcus faecalis supernatants on serotonin transporter expression in cells and tissues. World J Gastroenterol 2022; 28(5): 532-546
- URL: https://www.wjgnet.com/1007-9327/full/v28/i5/532.htm
- DOI: https://dx.doi.org/10.3748/wjg.v28.i5.532


