Copyright
©The Author(s) 2022.
World J Gastroenterol. Jul 28, 2022; 28(28): 3720-3731
Published online Jul 28, 2022. doi: 10.3748/wjg.v28.i28.3720
Published online Jul 28, 2022. doi: 10.3748/wjg.v28.i28.3720
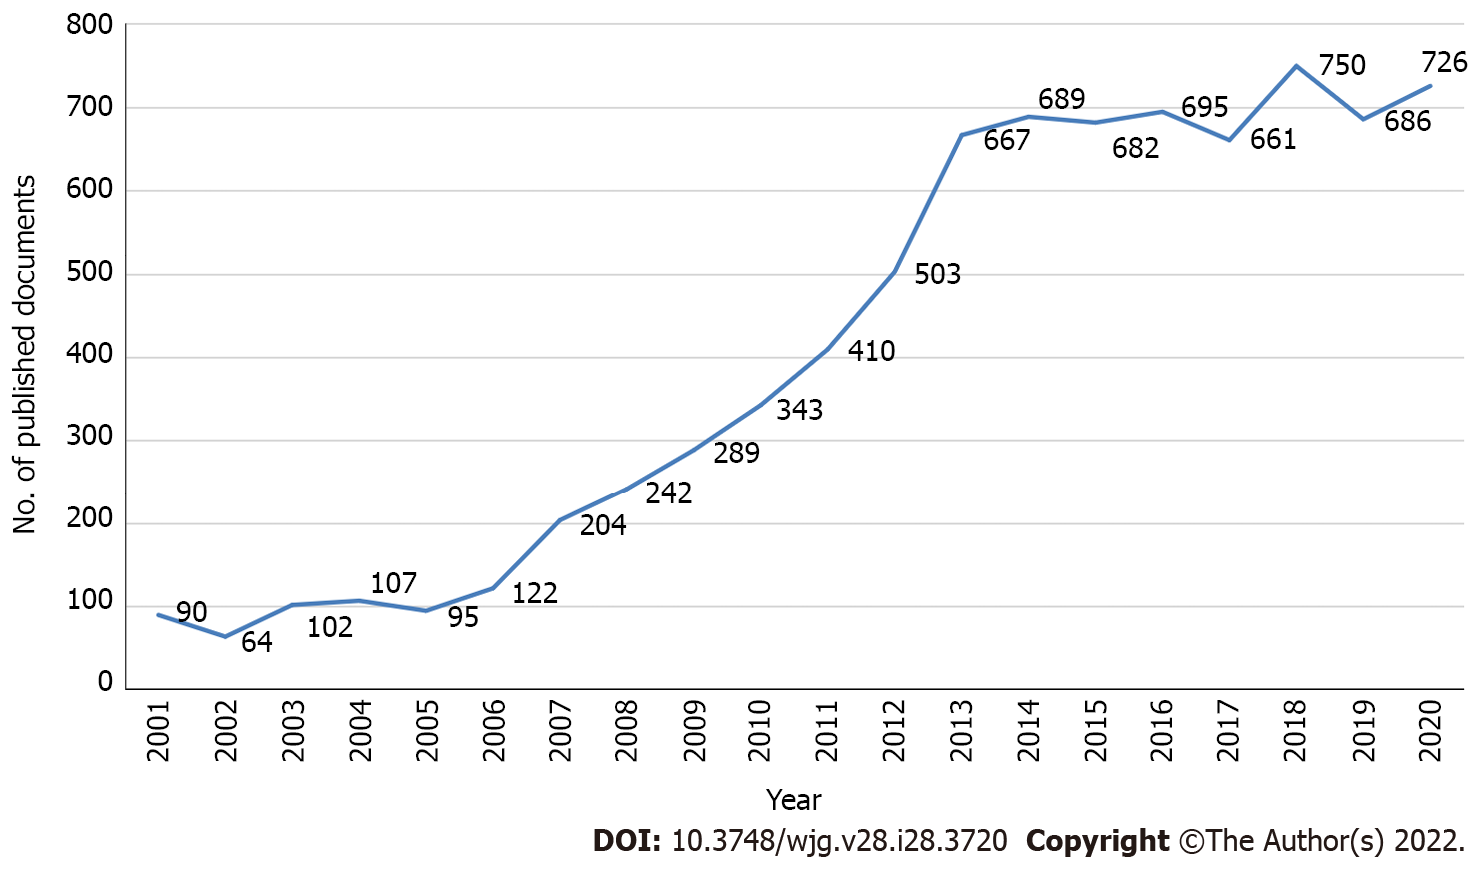
Figure 1 Annual number of publications on Clostridium difficile-associated diarrhea indexed in Scopus and published from 2001 to 2020.
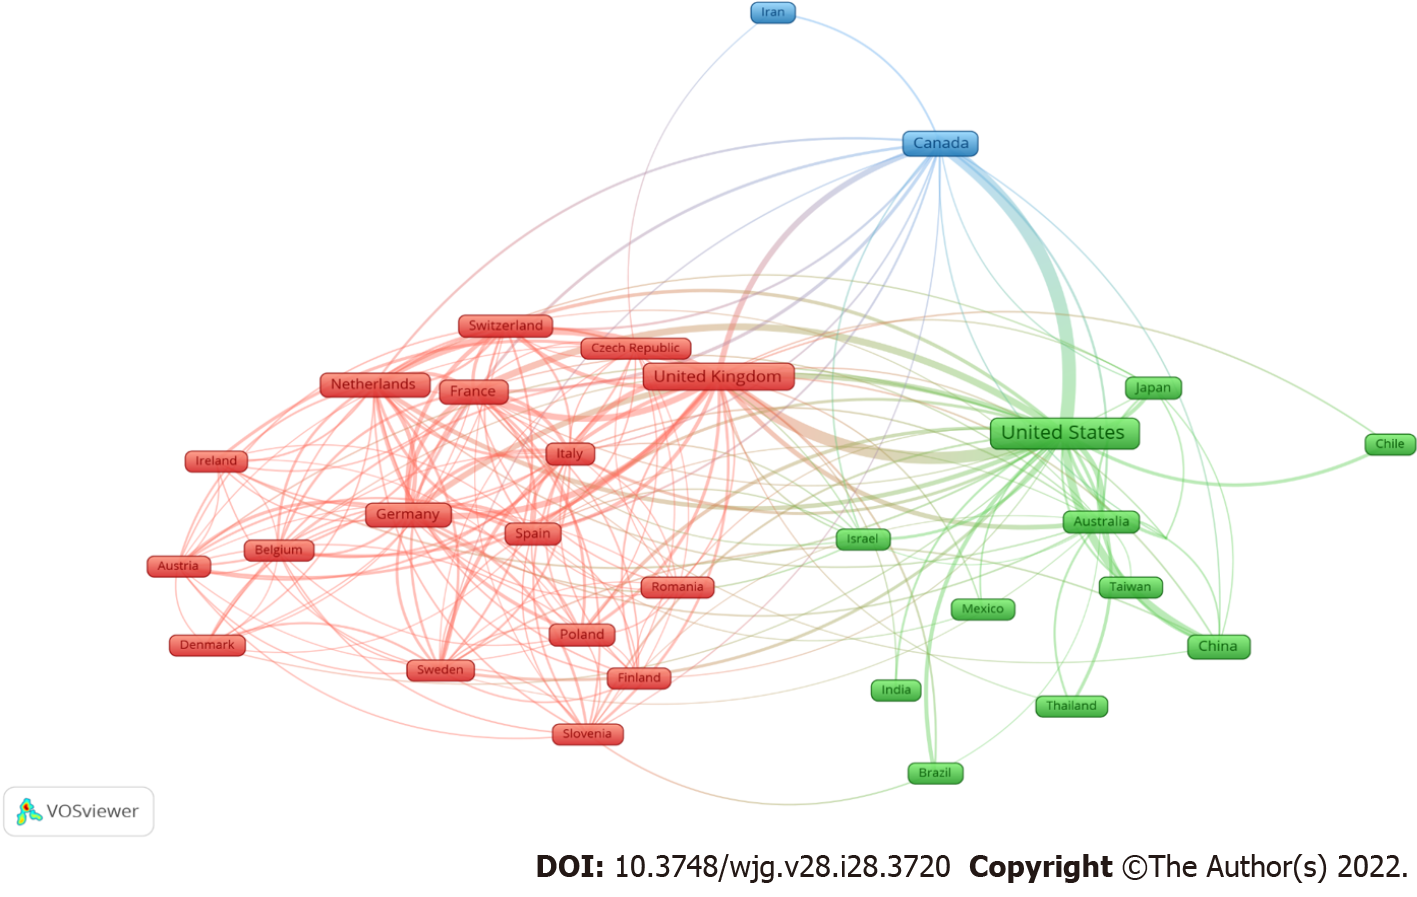
Figure 2 Network visualization map of country co-authorships.
Of the 103 countries, 31 had at least 50 publications.
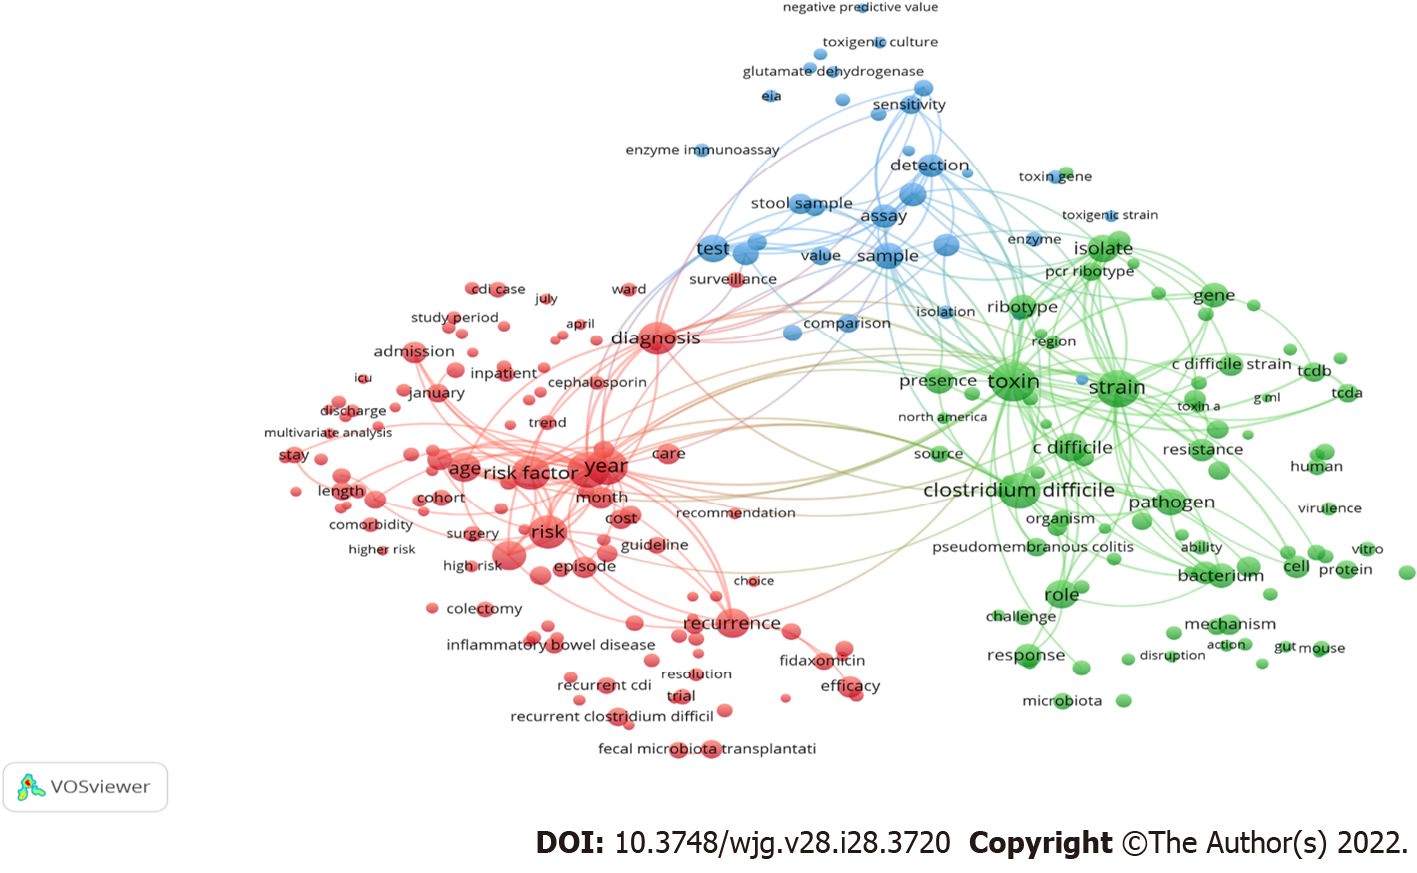
Figure 3 Network visualization map of the most frequent terms in the titles/abstracts of the retrieved documents.
Of the 84961 terms, 385 had at least 100 publications. Terms with the same color represent a separate cluster (research theme).
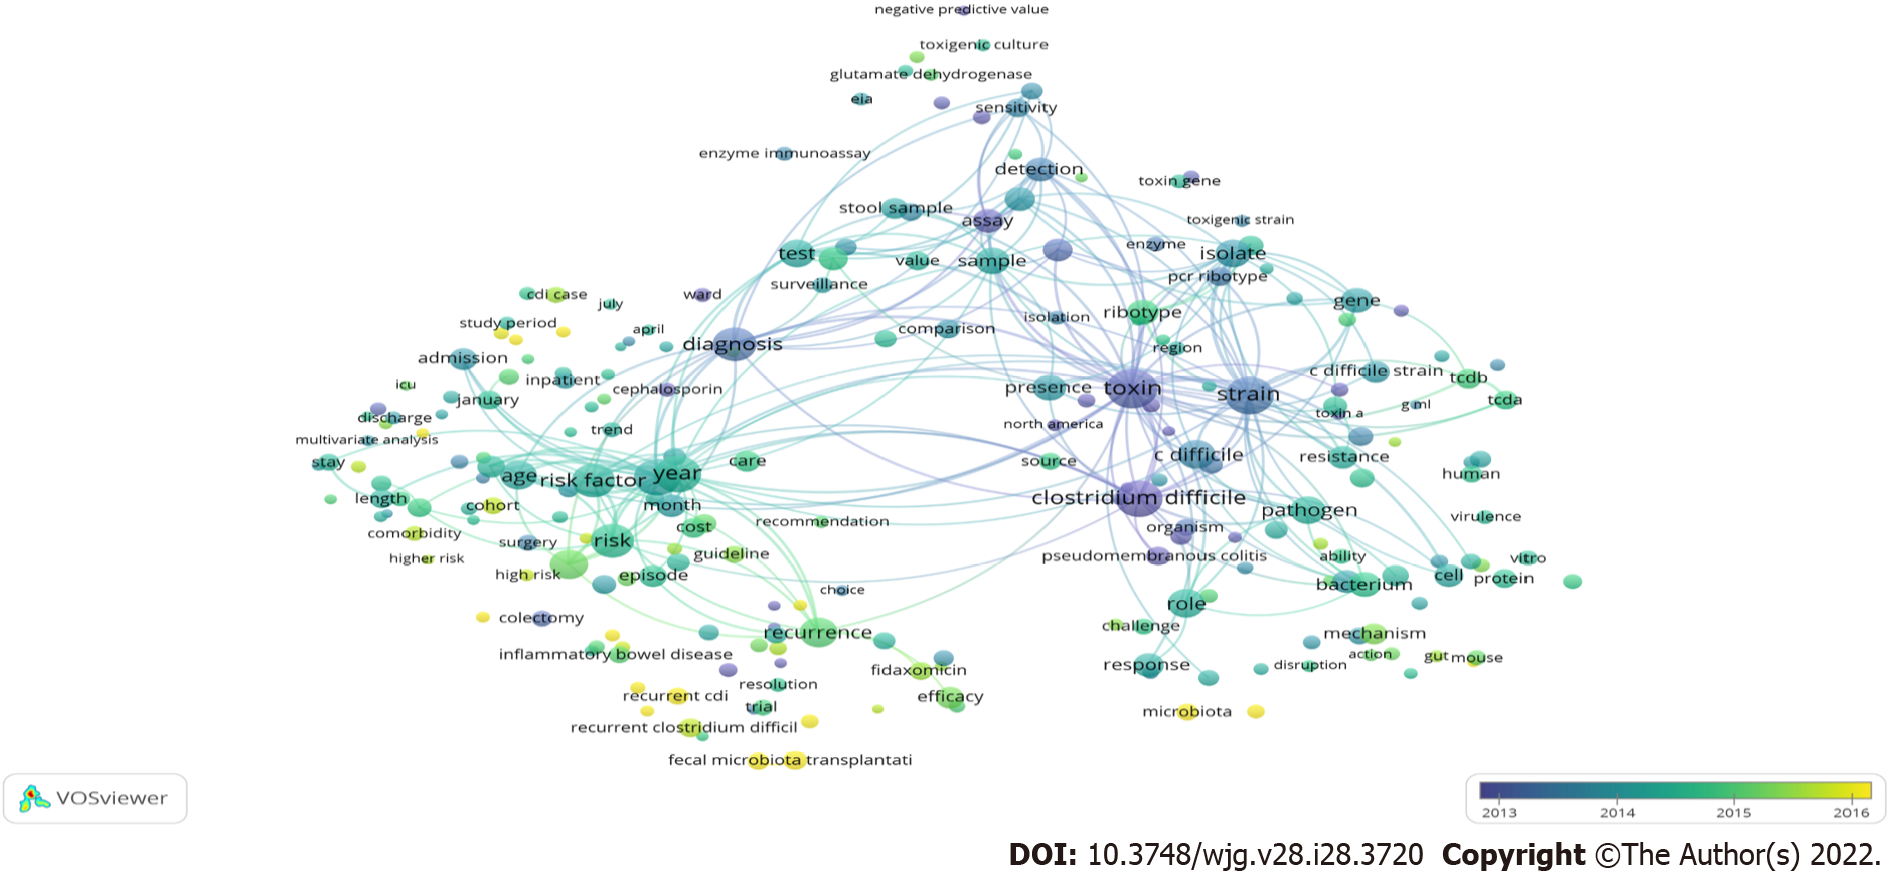
Figure 4 Overlay network visualization map of the most frequent terms in the titles/abstracts of the retrieved documents.
The colors on the map reflected the period of emergence in the literature, with yellow representing terms that were relatively recent in the literature.
- Citation: Zyoud SH. Global research on Clostridium difficile-associated diarrhoea: A visualized study. World J Gastroenterol 2022; 28(28): 3720-3731
- URL: https://www.wjgnet.com/1007-9327/full/v28/i28/3720.htm
- DOI: https://dx.doi.org/10.3748/wjg.v28.i28.3720


