Copyright
©The Author(s) 2021.
World J Gastroenterol. Feb 21, 2021; 27(7): 641-653
Published online Feb 21, 2021. doi: 10.3748/wjg.v27.i7.641
Published online Feb 21, 2021. doi: 10.3748/wjg.v27.i7.641
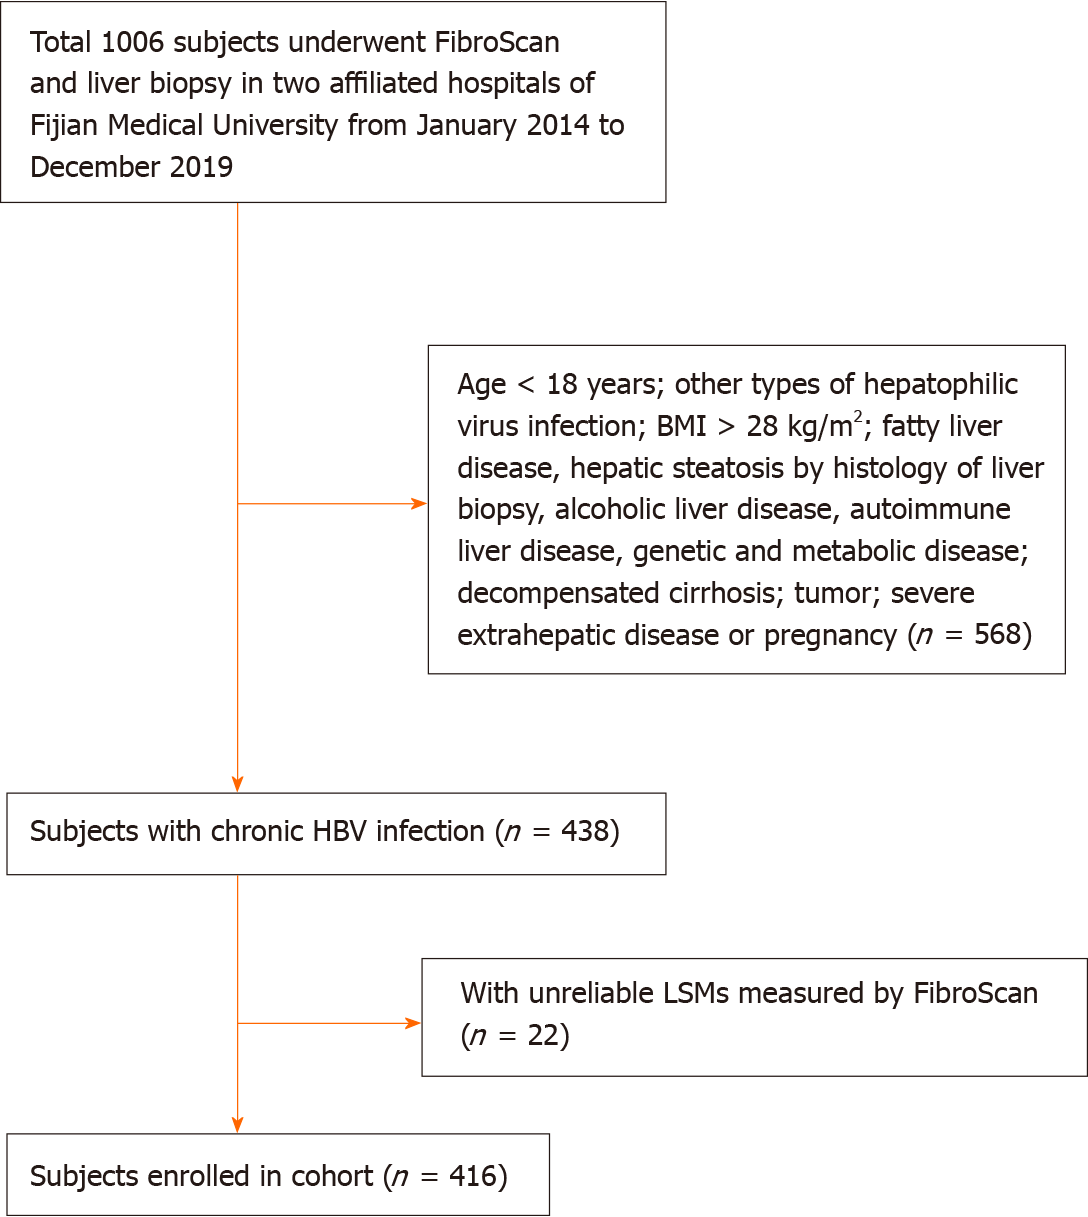
Figure 1 Flowchart of patient enrolment.
BMI: Body mass index; HBV: Hepatitis B virus; LSM: Liver stiffness measurements; FibroScan: Transient elastography.
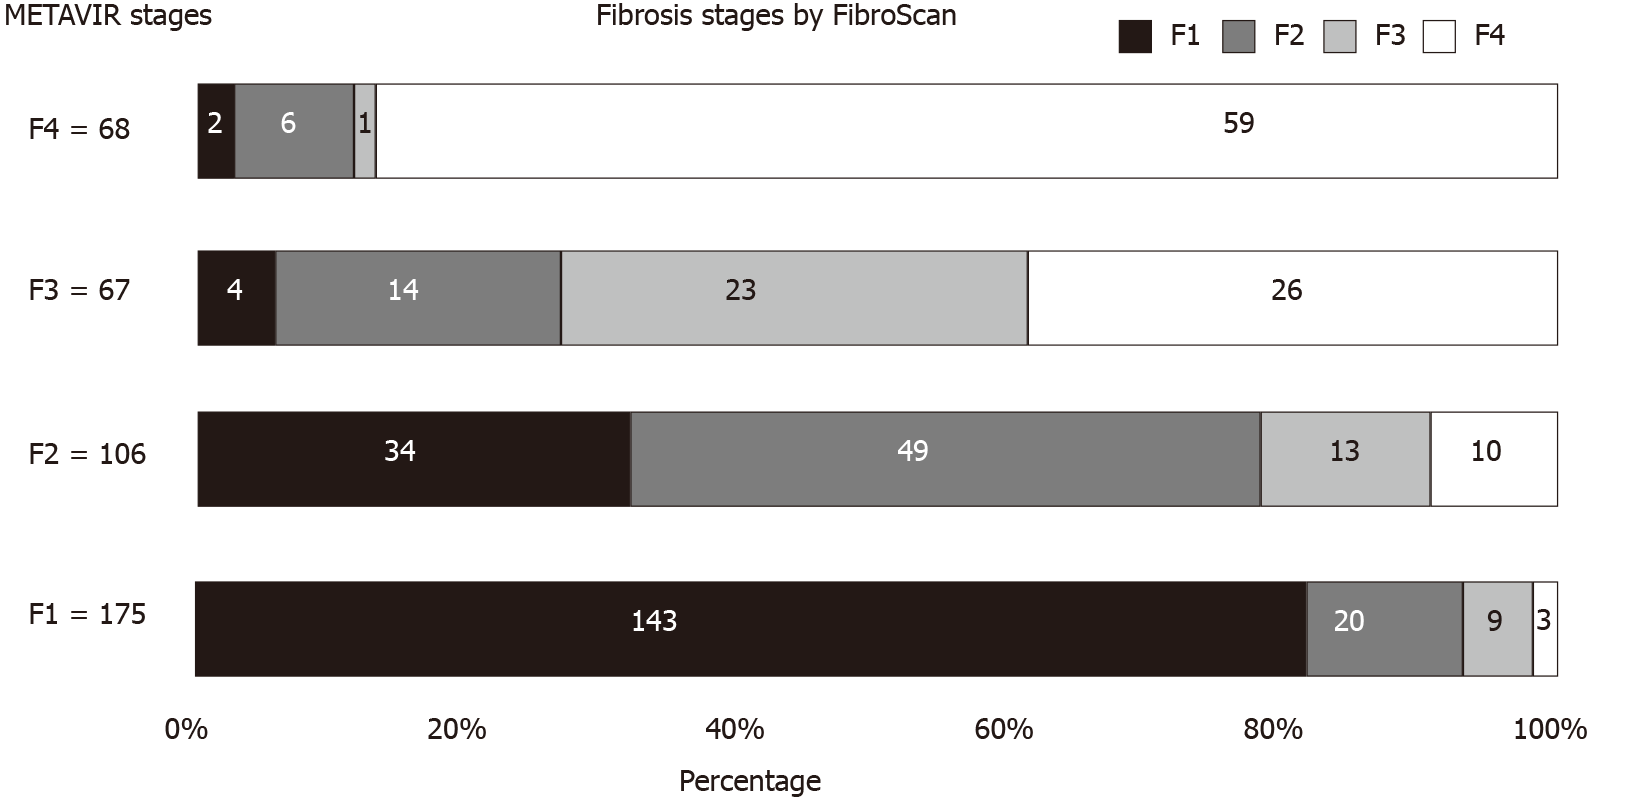
Figure 2 Distribution of predicted fibrosis stages by transient elastography according to different METAVIR liver fibrosis stages.
FibroScan: Transient elastography.
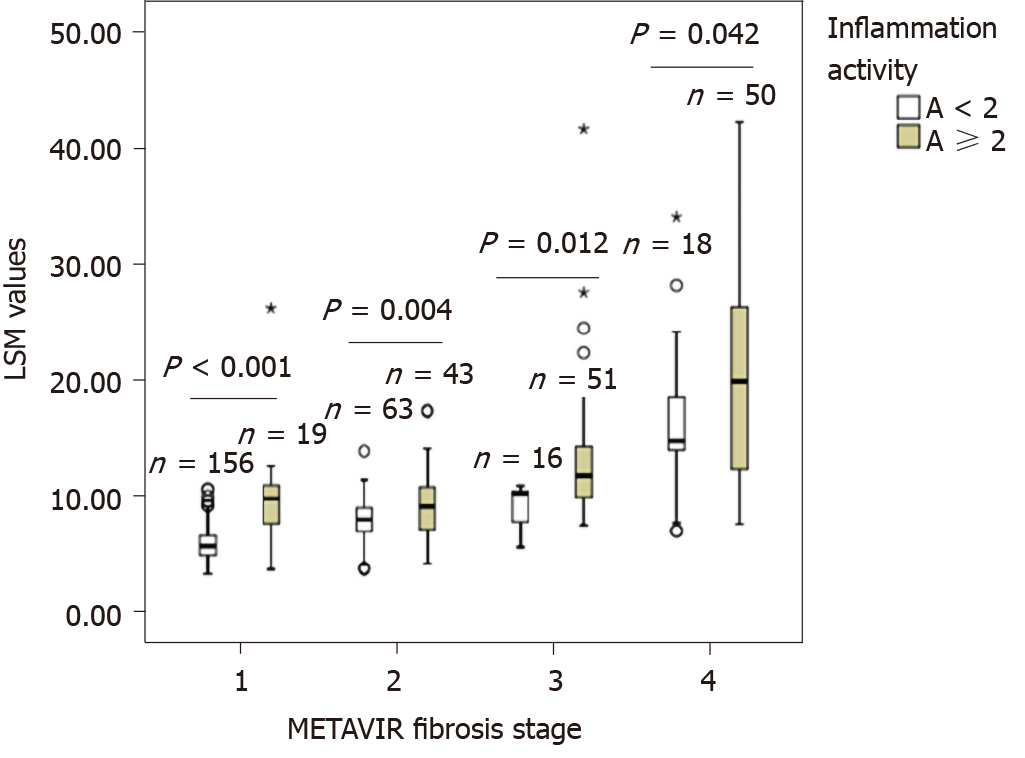
Figure 3 Comparison of liver stiffness measurement values by transient elastography in patients with different liver inflammation activities in different METAVIR fibrosis stages.
LSM: Liver stiffness measurements.
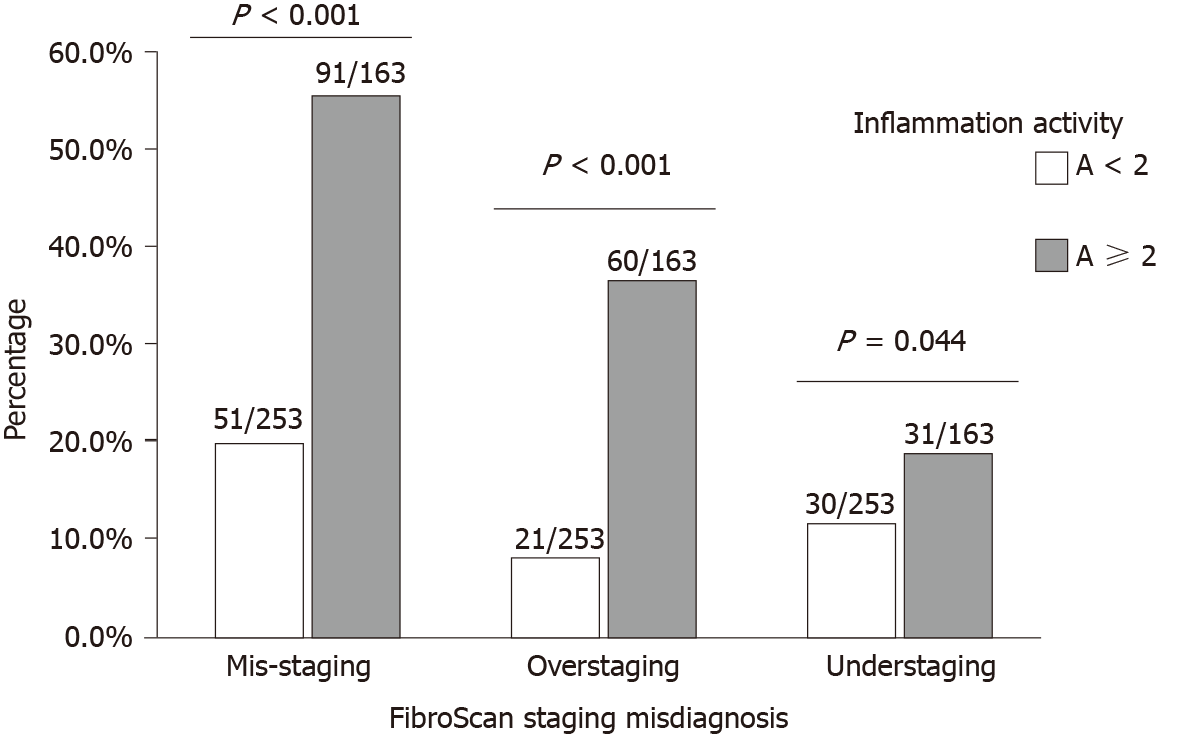
Figure 4 Prevalence of misdiagnosis of stage of liver fibrosis by transient elastography in patients with different inflammatory activities.
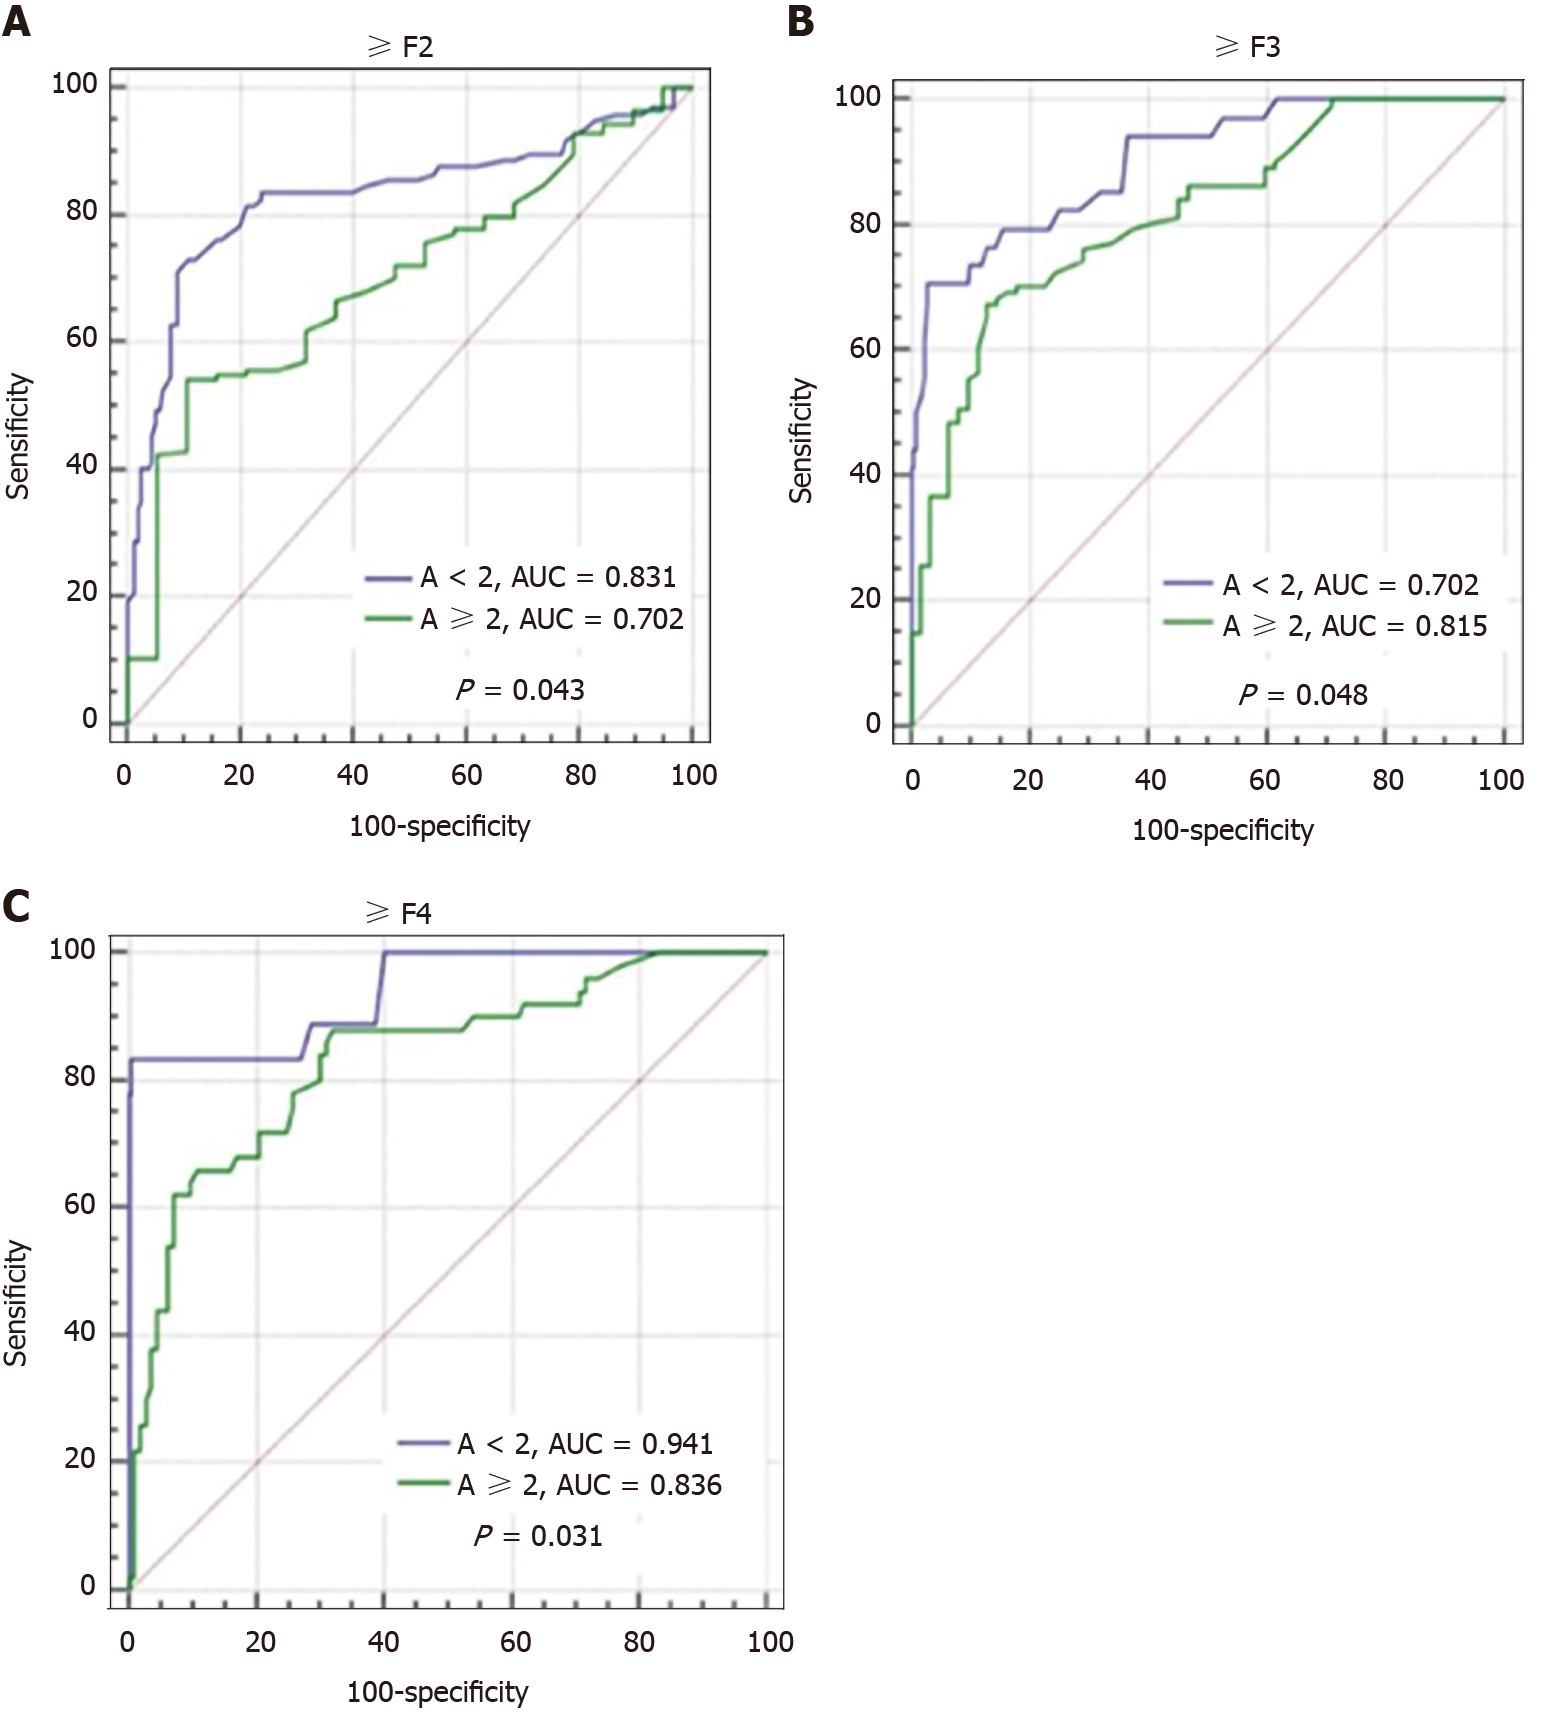
Figure 5 Comparison of effects of different liver inflammatory activities on diagnostic performance of transient elastography in assessing different fibrosis stages.
A: ≥ F2; B: ≥ F3; C: F4. AUC: Area under the curve; ≥ F2: Significant fibrosis; ≥ F3: Advanced fibrosis; F4: Cirrhosis.
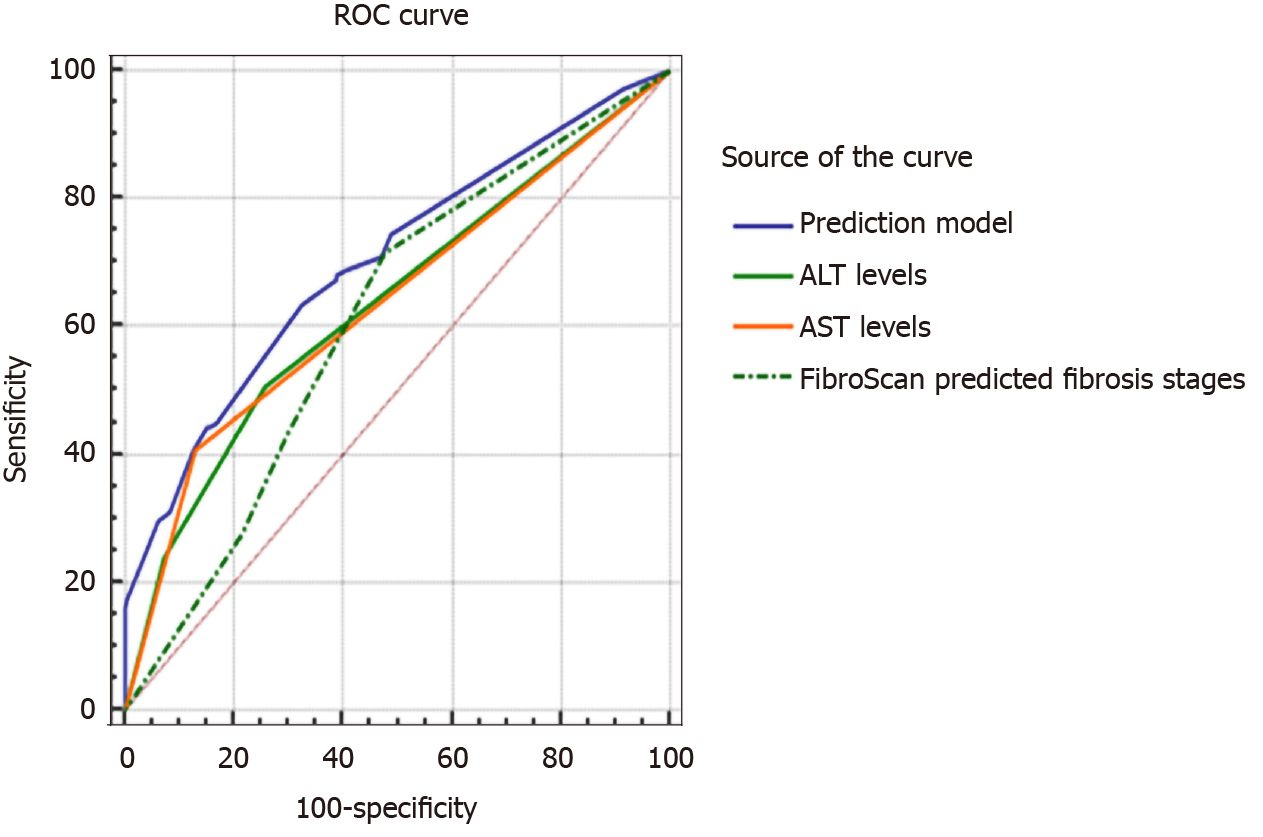
Figure 6 Comparison of receiver operating characteristic curves in prediction model and single related factors with regard to misdiagnosis of the stage of liver fibrosis using transient elastography.
ALT: Alanine aminotransferase; AST: Aspartate aminotransferase; ROC: Receiver operating characteristic; FibroScan: Transient elastography.
- Citation: Huang LL, Yu XP, Li JL, Lin HM, Kang NL, Jiang JJ, Zhu YY, Liu YR, Zeng DW. Effect of liver inflammation on accuracy of FibroScan device in assessing liver fibrosis stage in patients with chronic hepatitis B virus infection. World J Gastroenterol 2021; 27(7): 641-653
- URL: https://www.wjgnet.com/1007-9327/full/v27/i7/641.htm
- DOI: https://dx.doi.org/10.3748/wjg.v27.i7.641


