Copyright
©The Author(s) 2021.
World J Gastroenterol. Feb 21, 2021; 27(7): 641-653
Published online Feb 21, 2021. doi: 10.3748/wjg.v27.i7.641
Published online Feb 21, 2021. doi: 10.3748/wjg.v27.i7.641
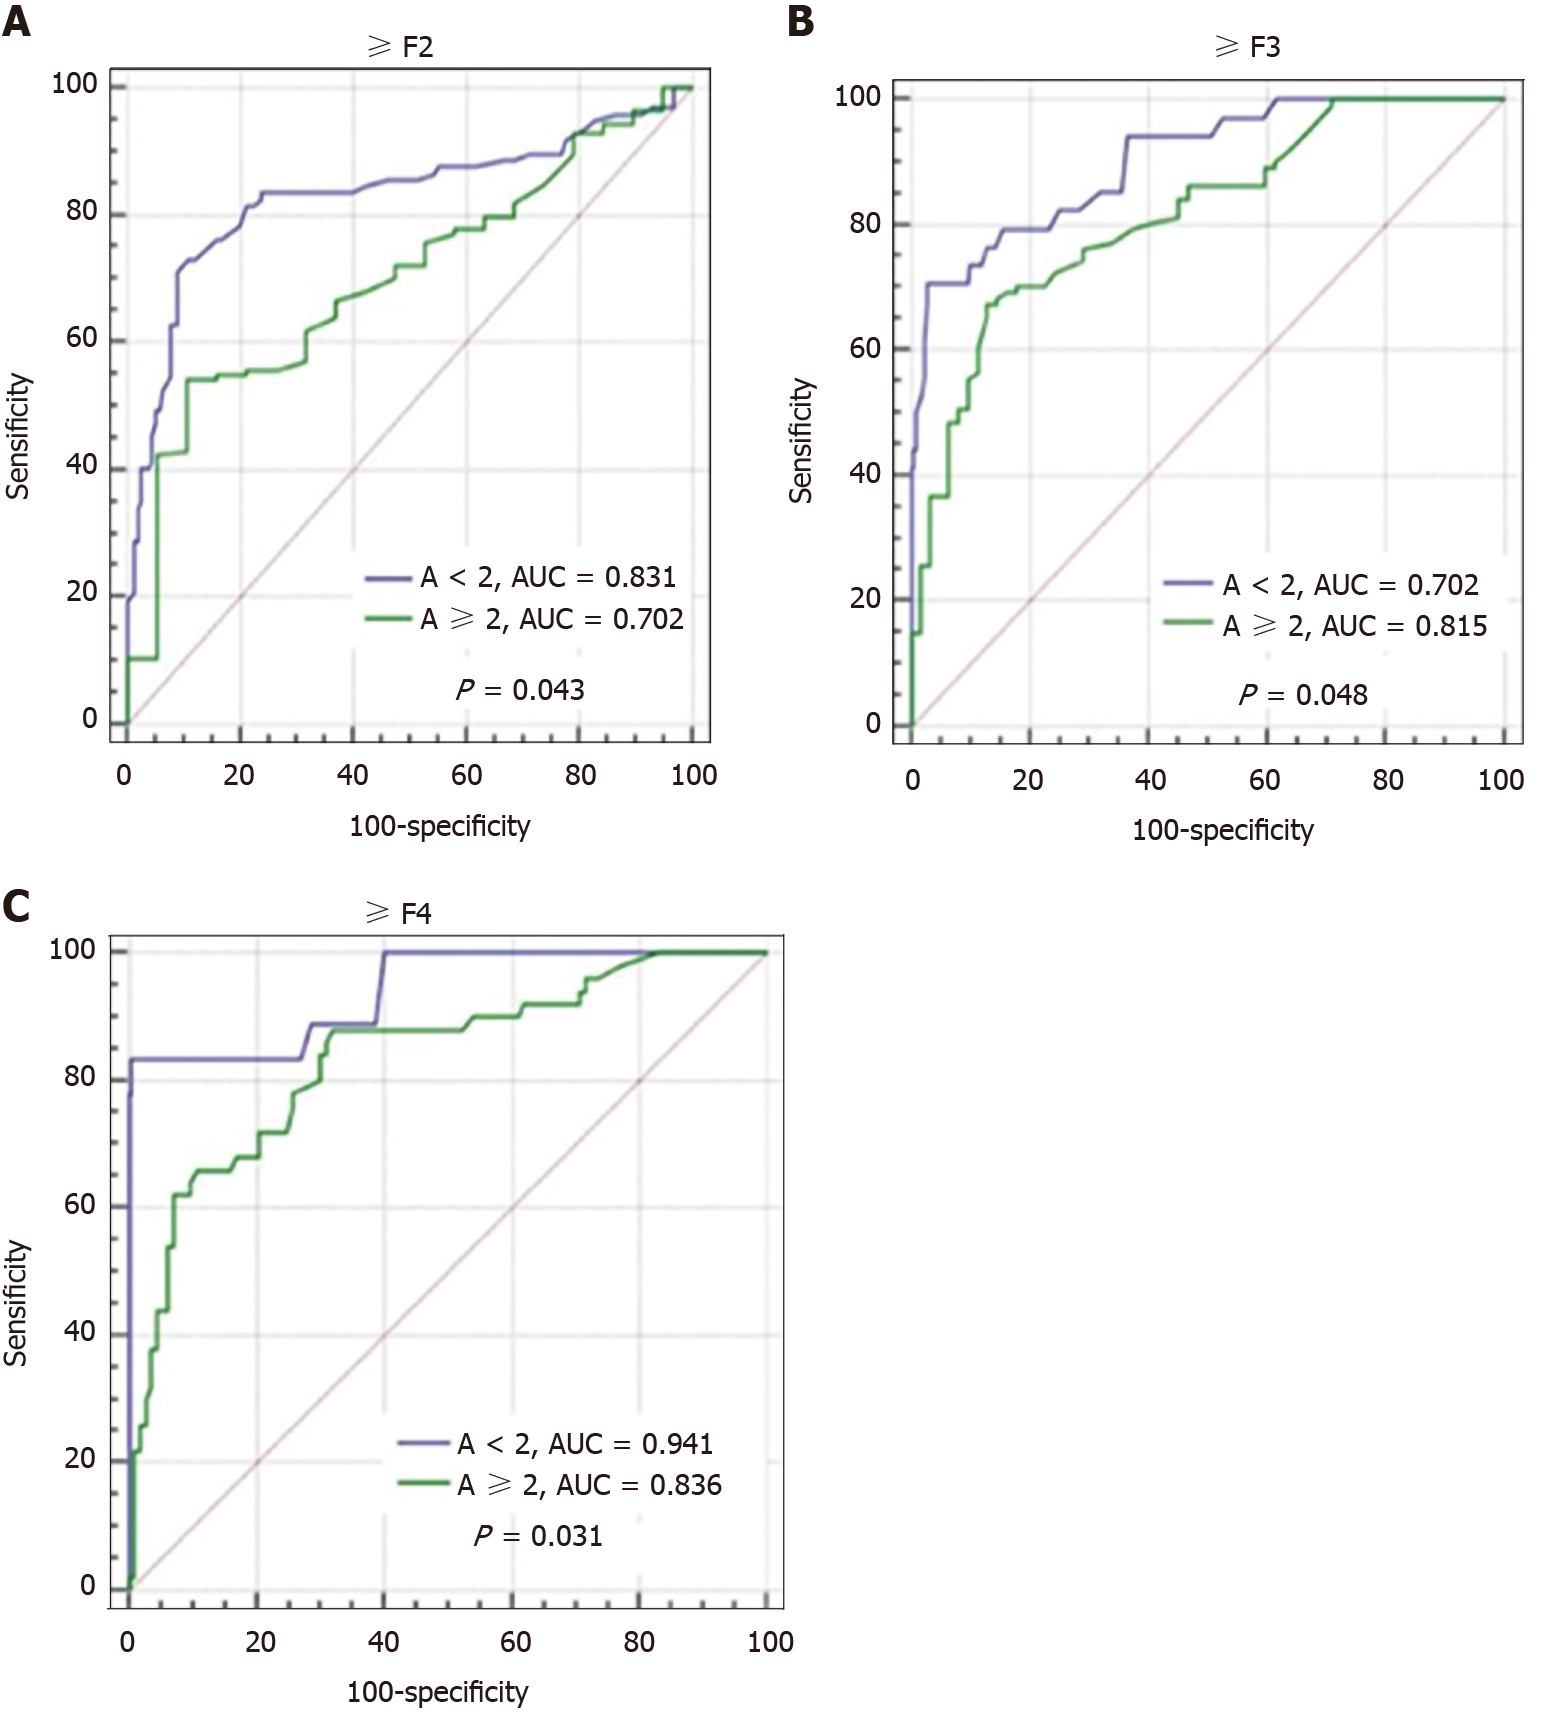
Figure 5 Comparison of effects of different liver inflammatory activities on diagnostic performance of transient elastography in assessing different fibrosis stages.
A: ≥ F2; B: ≥ F3; C: F4. AUC: Area under the curve; ≥ F2: Significant fibrosis; ≥ F3: Advanced fibrosis; F4: Cirrhosis.
- Citation: Huang LL, Yu XP, Li JL, Lin HM, Kang NL, Jiang JJ, Zhu YY, Liu YR, Zeng DW. Effect of liver inflammation on accuracy of FibroScan device in assessing liver fibrosis stage in patients with chronic hepatitis B virus infection. World J Gastroenterol 2021; 27(7): 641-653
- URL: https://www.wjgnet.com/1007-9327/full/v27/i7/641.htm
- DOI: https://dx.doi.org/10.3748/wjg.v27.i7.641


