Copyright
©The Author(s) 2021.
World J Gastroenterol. Aug 28, 2021; 27(32): 5392-5403
Published online Aug 28, 2021. doi: 10.3748/wjg.v27.i32.5392
Published online Aug 28, 2021. doi: 10.3748/wjg.v27.i32.5392
Figure 1 Colonic histopathological changes.
A: Normal group; B: Model group; C: Cistanche deserticola group; D: Blocker group. Magnification: × 40; Scale bar: 20 μm.
Figure 2 Expression of stem cell factor and relative optical density ratio in colonic tissue by immunohistochemical detection.
A: Normal group; B: Model group; C: Cistanche deserticola group; D: Blocker group. Magnification: × 40; Scale bar: 20 μm. aP < 0.05, the expressions of stem cell factor and C-kit in colon tissue of the model group were both significantly decreased compared with the normal group; bP < 0.05, the expression of stem cell factor and C-kit in the colon tissue of rats in the Cistanche deserticola group was significantly increased compared with model group. There was no difference in the expression of stem cell factor and C-kit in the colon tissue of rats between the blocker group and the model group.
Figure 3 Expression of C-kit and relative optical density ratio in colonic tissue by immunohistochemical detection.
A: Normal group; B: Model group; C: Cistanche deserticola group; D: Blocker group. Magnification: × 40; Scale bar: 20 μm. aP < 0.05, compared with normal group; bP < 0.05, compared with model group; cP > 0.05, compared with model group.
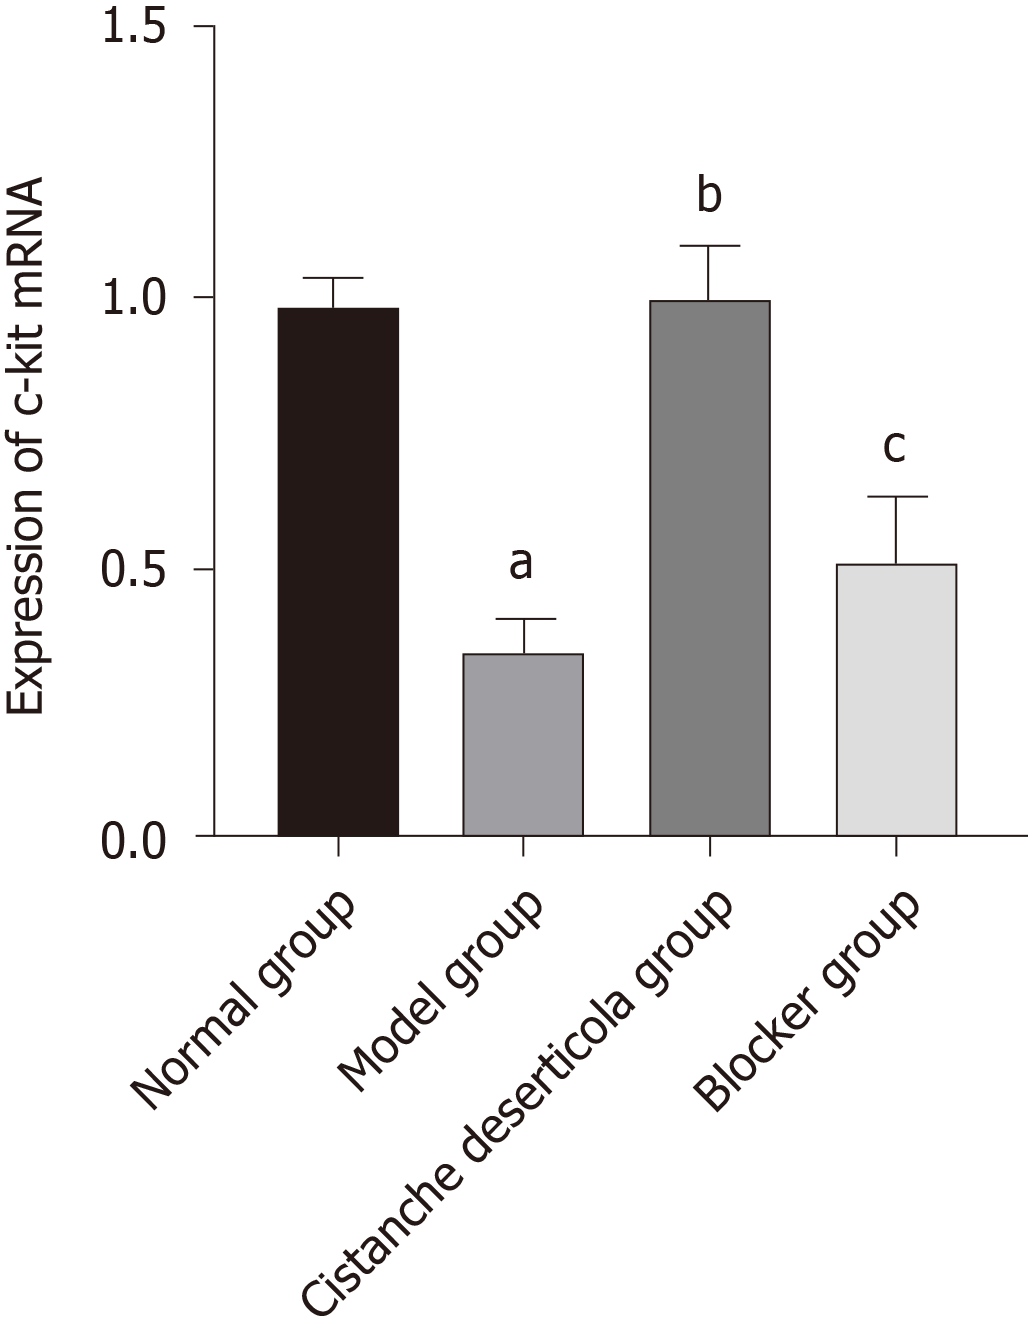
Figure 4 Expression of C-kit mRNA in colon tissue of rats in each group.
aP < 0.05, compared with normal group; bP < 0.05, compared with model group; cP > 0.05, compared with model group.
Figure 5 Connexin 43 and aquaporin 3 protein expression detected by western blotting.
AQP3: Aquaporin 3; Cx43: Connexin 43.
Figure 6 Relative expression of connexin 43 protein.
aP < 0.05, compared with normal group; bP < 0.05, compared with model group; cP > 0.05, compared with model group. Cx43: Connexin 43.
Figure 7 Relative expression of aquaporin 3 protein.
aP < 0.05, compared with normal group; bP < 0.05, compared with model group; cP > 0.05, compared with model group. AQP3: Aquaporin 3.
Figure 8 Observation of colonic villi, mitochondria of colonic epithelial cells and goblet cells by transmission electron microscopy.
A: Normal group; B: Model group; C: Cistanche deserticola group; D: Blocker group.
- Citation: Zhang X, Zheng FJ, Zhang Z. Therapeutic effect of Cistanche deserticola on defecation in senile constipation rat model through stem cell factor/C-kit signaling pathway. World J Gastroenterol 2021; 27(32): 5392-5403
- URL: https://www.wjgnet.com/1007-9327/full/v27/i32/5392.htm
- DOI: https://dx.doi.org/10.3748/wjg.v27.i32.5392


