Copyright
©The Author(s) 2021.
World J Gastroenterol. Jun 28, 2021; 27(24): 3609-3629
Published online Jun 28, 2021. doi: 10.3748/wjg.v27.i24.3609
Published online Jun 28, 2021. doi: 10.3748/wjg.v27.i24.3609
Figure 1 Structural characteristics of intestinal microbes in the ulcerative colitis and control groups.
A: Among the 594 operational taxonomic units (OTUs) detected, a total of 317 OTUs were identified in the two groups, including 86 unique OTUs in the UC group and 191 unique OTUs in the control group. B: The dilution curve analysis based on the Chao1 index for community richness and the Shannon index for community diversity showed that the sequencing volume had covered all the microorganisms in the samples. C: The species accumulation curve shows that the sequencing sample size was sufficient, which reflected most of the microbial information in the sample. D: Principal coordinate analysis clearly differentiated the intestinal flora of the ulcerative colitis (UC) group from the control group. E: Chao community richness index or the Shannon and Simpson community α diversity indexes of the UC group were significantly lower than those of the control group. F: The community compositions of the intestinal microbes in the UC group and the control group were analyzed at the phylum and genus levels. UC: Ulcerative colitis; OTUs: Operational taxonomic units; PCoA: Principal coordinate analysis.
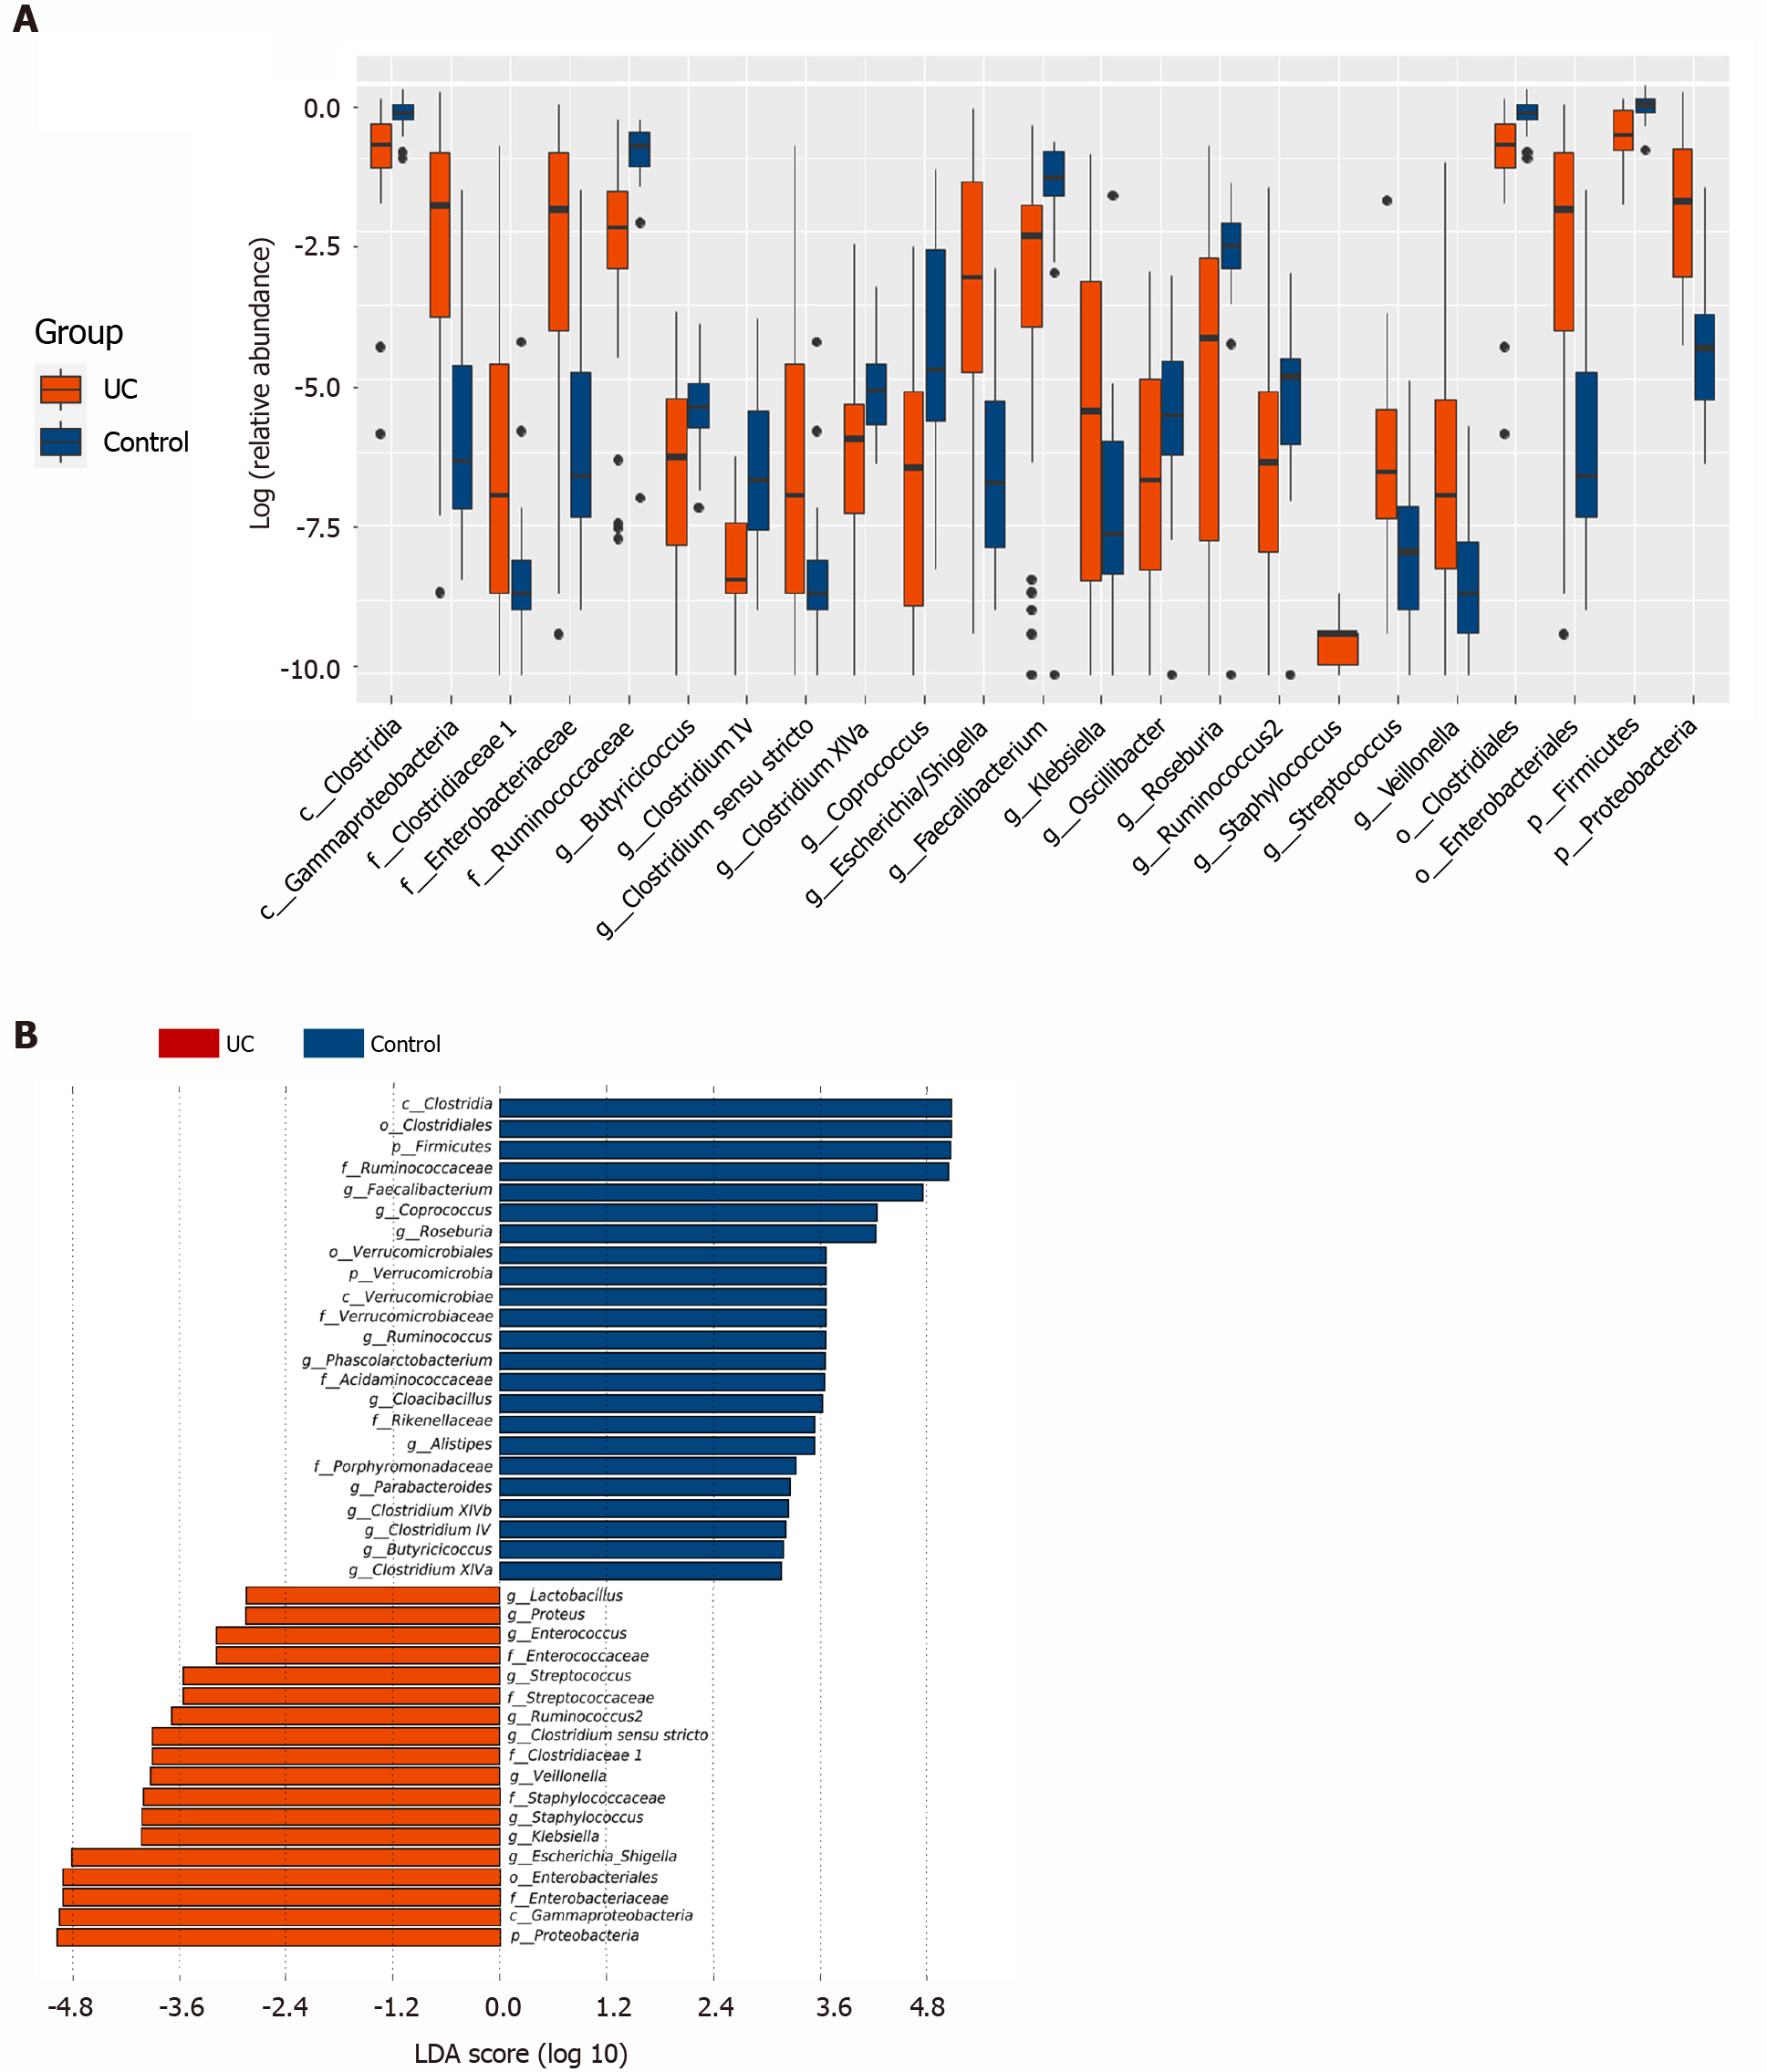
Figure 2 Screening of different key microorganisms between the ulcerative colitis and control groups.
A: The Wilcoxon rank sum test of differential species between the two groups showed significant changes in the intestinal microbes between the ulcerative colitis and control groups; B: LEfSe analysis identified (threshold 2) the differential intestinal microbial communities between the two groups. UC: Ulcerative colitis; LDA: Linear discriminant analysis.
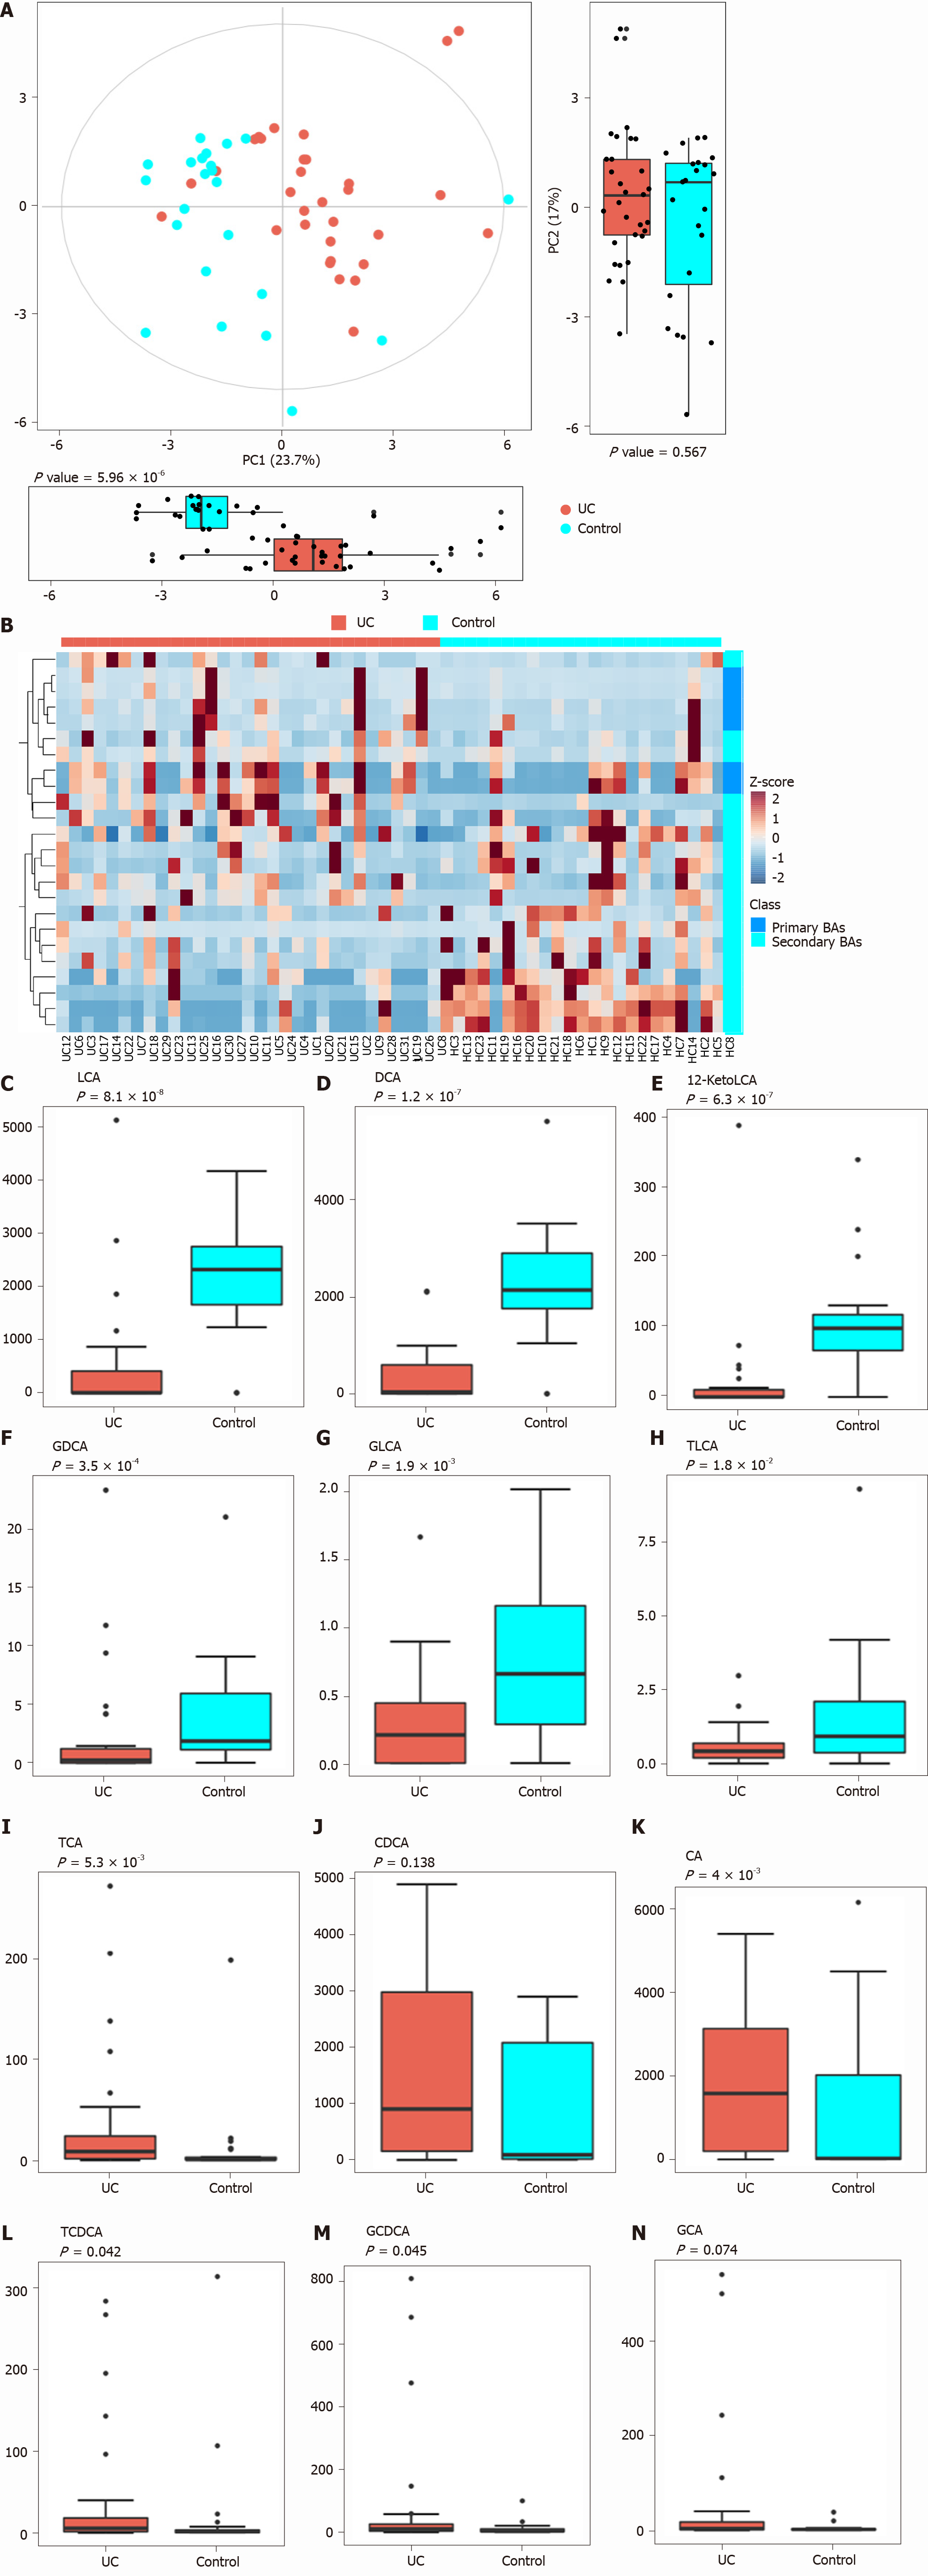
Figure 3 Analysis of difference in fecal bile acids between the ulcerative colitis and control groups.
A: Principal component analysis was performed to evaluate the similarity of the fecal BAs of the two groups. Twenty-four BAs clearly distinguished the ulcerative colitis (UC) group from the control group; B: Heatmap showing the individual BA concentrations in the samples (log-transformed). Shades of red and blue represent high and low BA concentrations, respectively (see color scale); C-H: Fecal secondary BAs in UC patients, such as lithocholic acid, deoxycholic acid, glyco-deoxycholic acid, glyco-lithocholic acid, and tauro-lithocholate, were significantly lower than those in healthy controls; I and K-M: The primary BAs such as tauro-cholic acid, cholic acid, tauro-chenodeoxycholic acid, and glyco-chenodeoxycholic acid were significantly higher than those in healthy controls; J and N: The concentrations of chenodeoxycholic acid and glyco-cholic acid showed a tendency to increase in UC patients but the increases were not significant. UC: Ulcerative colitis; PCA: Principal component analysis; BAs: Bile acids; LCA: Lithocholic acid; DCA: Deoxycholic acid; GDCA: Glyco-deoxycholic acid; GLCA: Glyco-lithocholic acid; TLCA: Tauro-lithocholate; TCA: Tauro-cholic acid; CA: Cholic acid; TCDCA: Tauro-chenodeoxycholic acid; GCDCA: Glyco-chenodeoxycholic acid; CDCA: Chenodeoxycholic acid; GCA: Glyco-cholic acid.
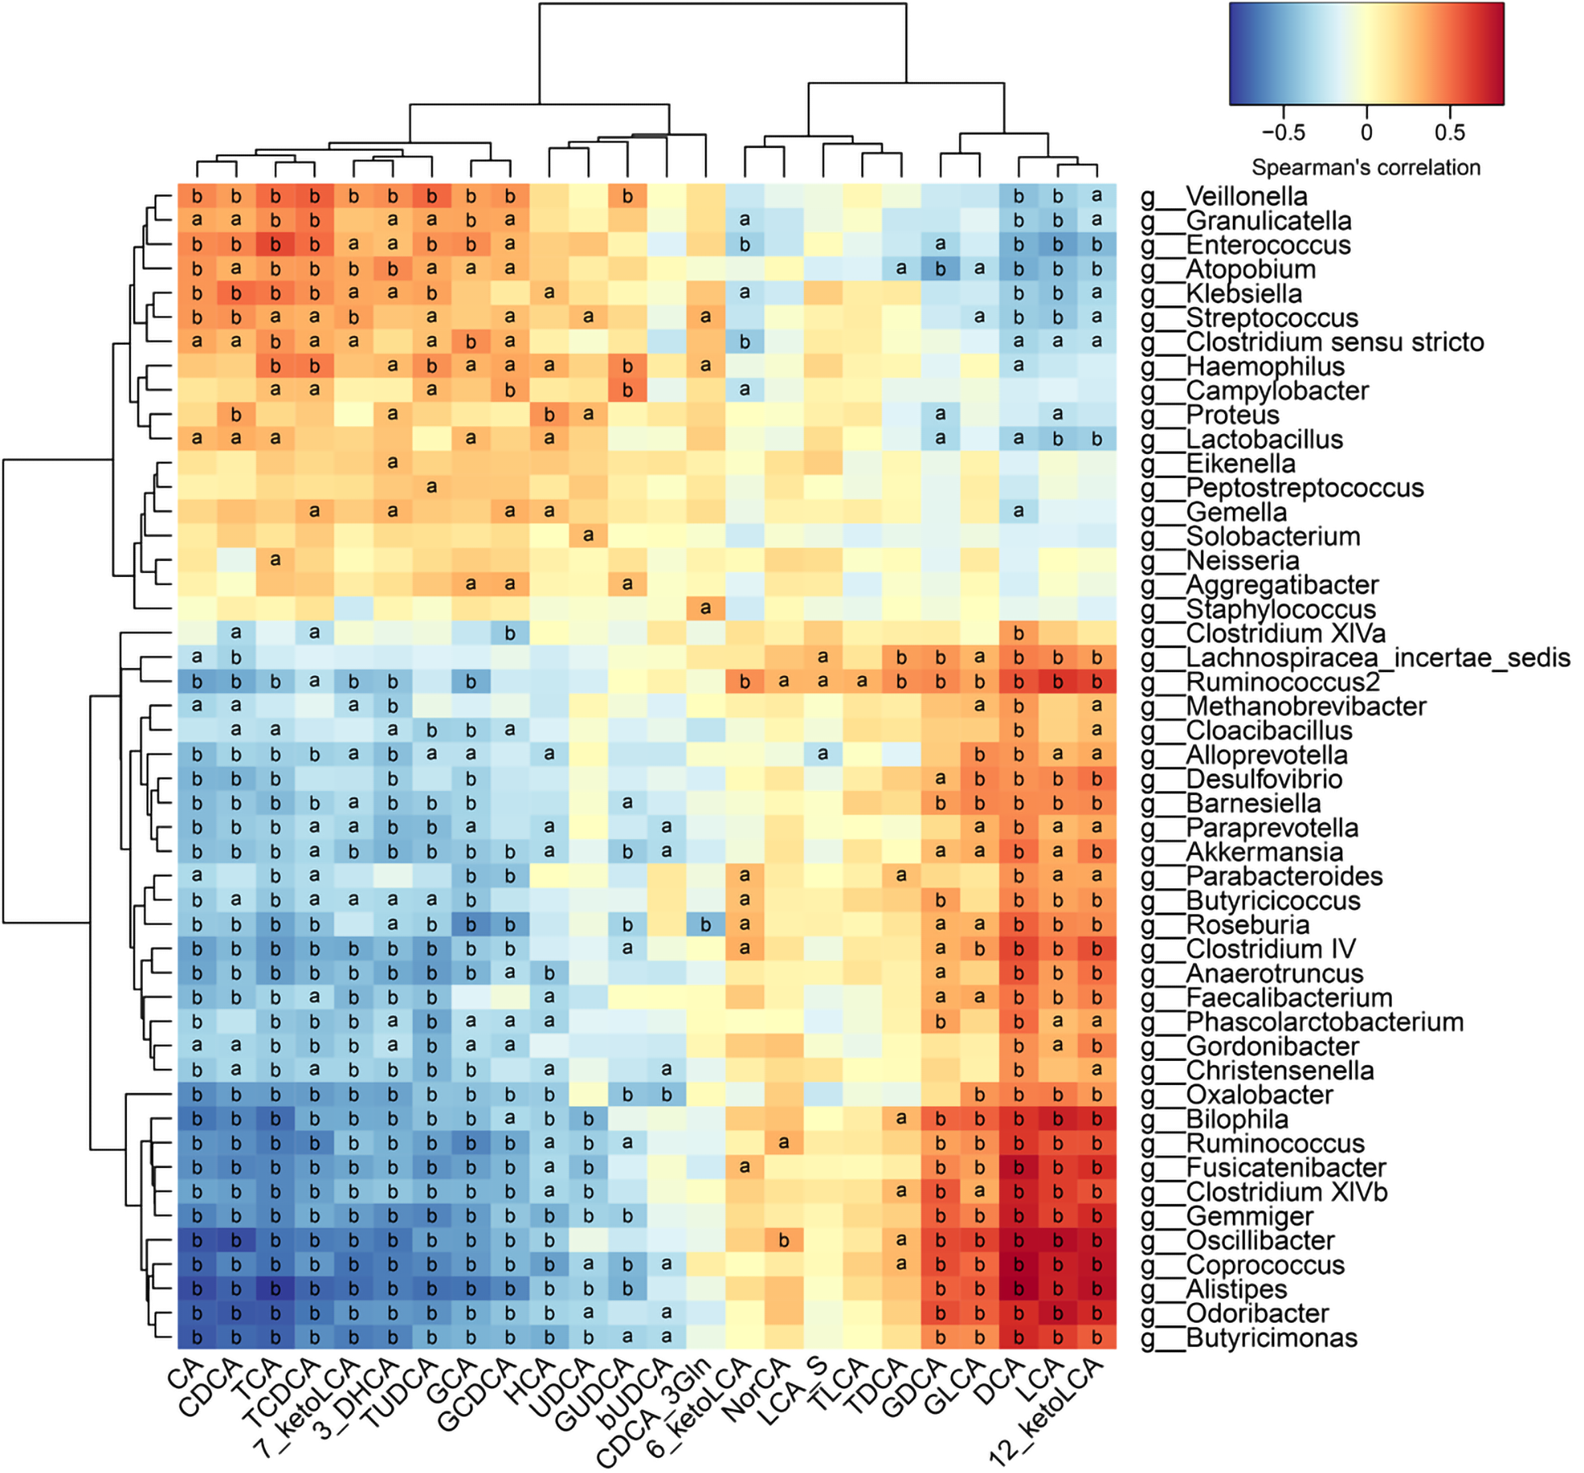
Figure 4 Correlations between fecal bile acids and intestinal microbes.
A heatmap of correlative assessments was made on the fecal bile acid metabolites and intestinal microbes (aP < 0.05, bP < 0.01). LCA: Lithocholic acid; DCA: Deoxycholic acid; GDCA: Glyco-deoxycholic acid; GLCA: Glyco-lithocholic acid; TLCA: Tauro-lithocholate; TDCA: Tauro-deoxycholic acid; UDCA: Ursodeoxycholic acid; TUDCA: Tauro-ursodeoxycholic acid; GUDCA: Glyco-ursodeoxycholic acid; TCA: Tauro-cholic acid; CA: Cholic acid; TCDCA: Tauro-chenodeoxycholic acid; GCDCA: Glyco-chenodeoxycholic acid; CDCA: Chenodeoxycholic acid; GCA: Glyco-cholic acid.
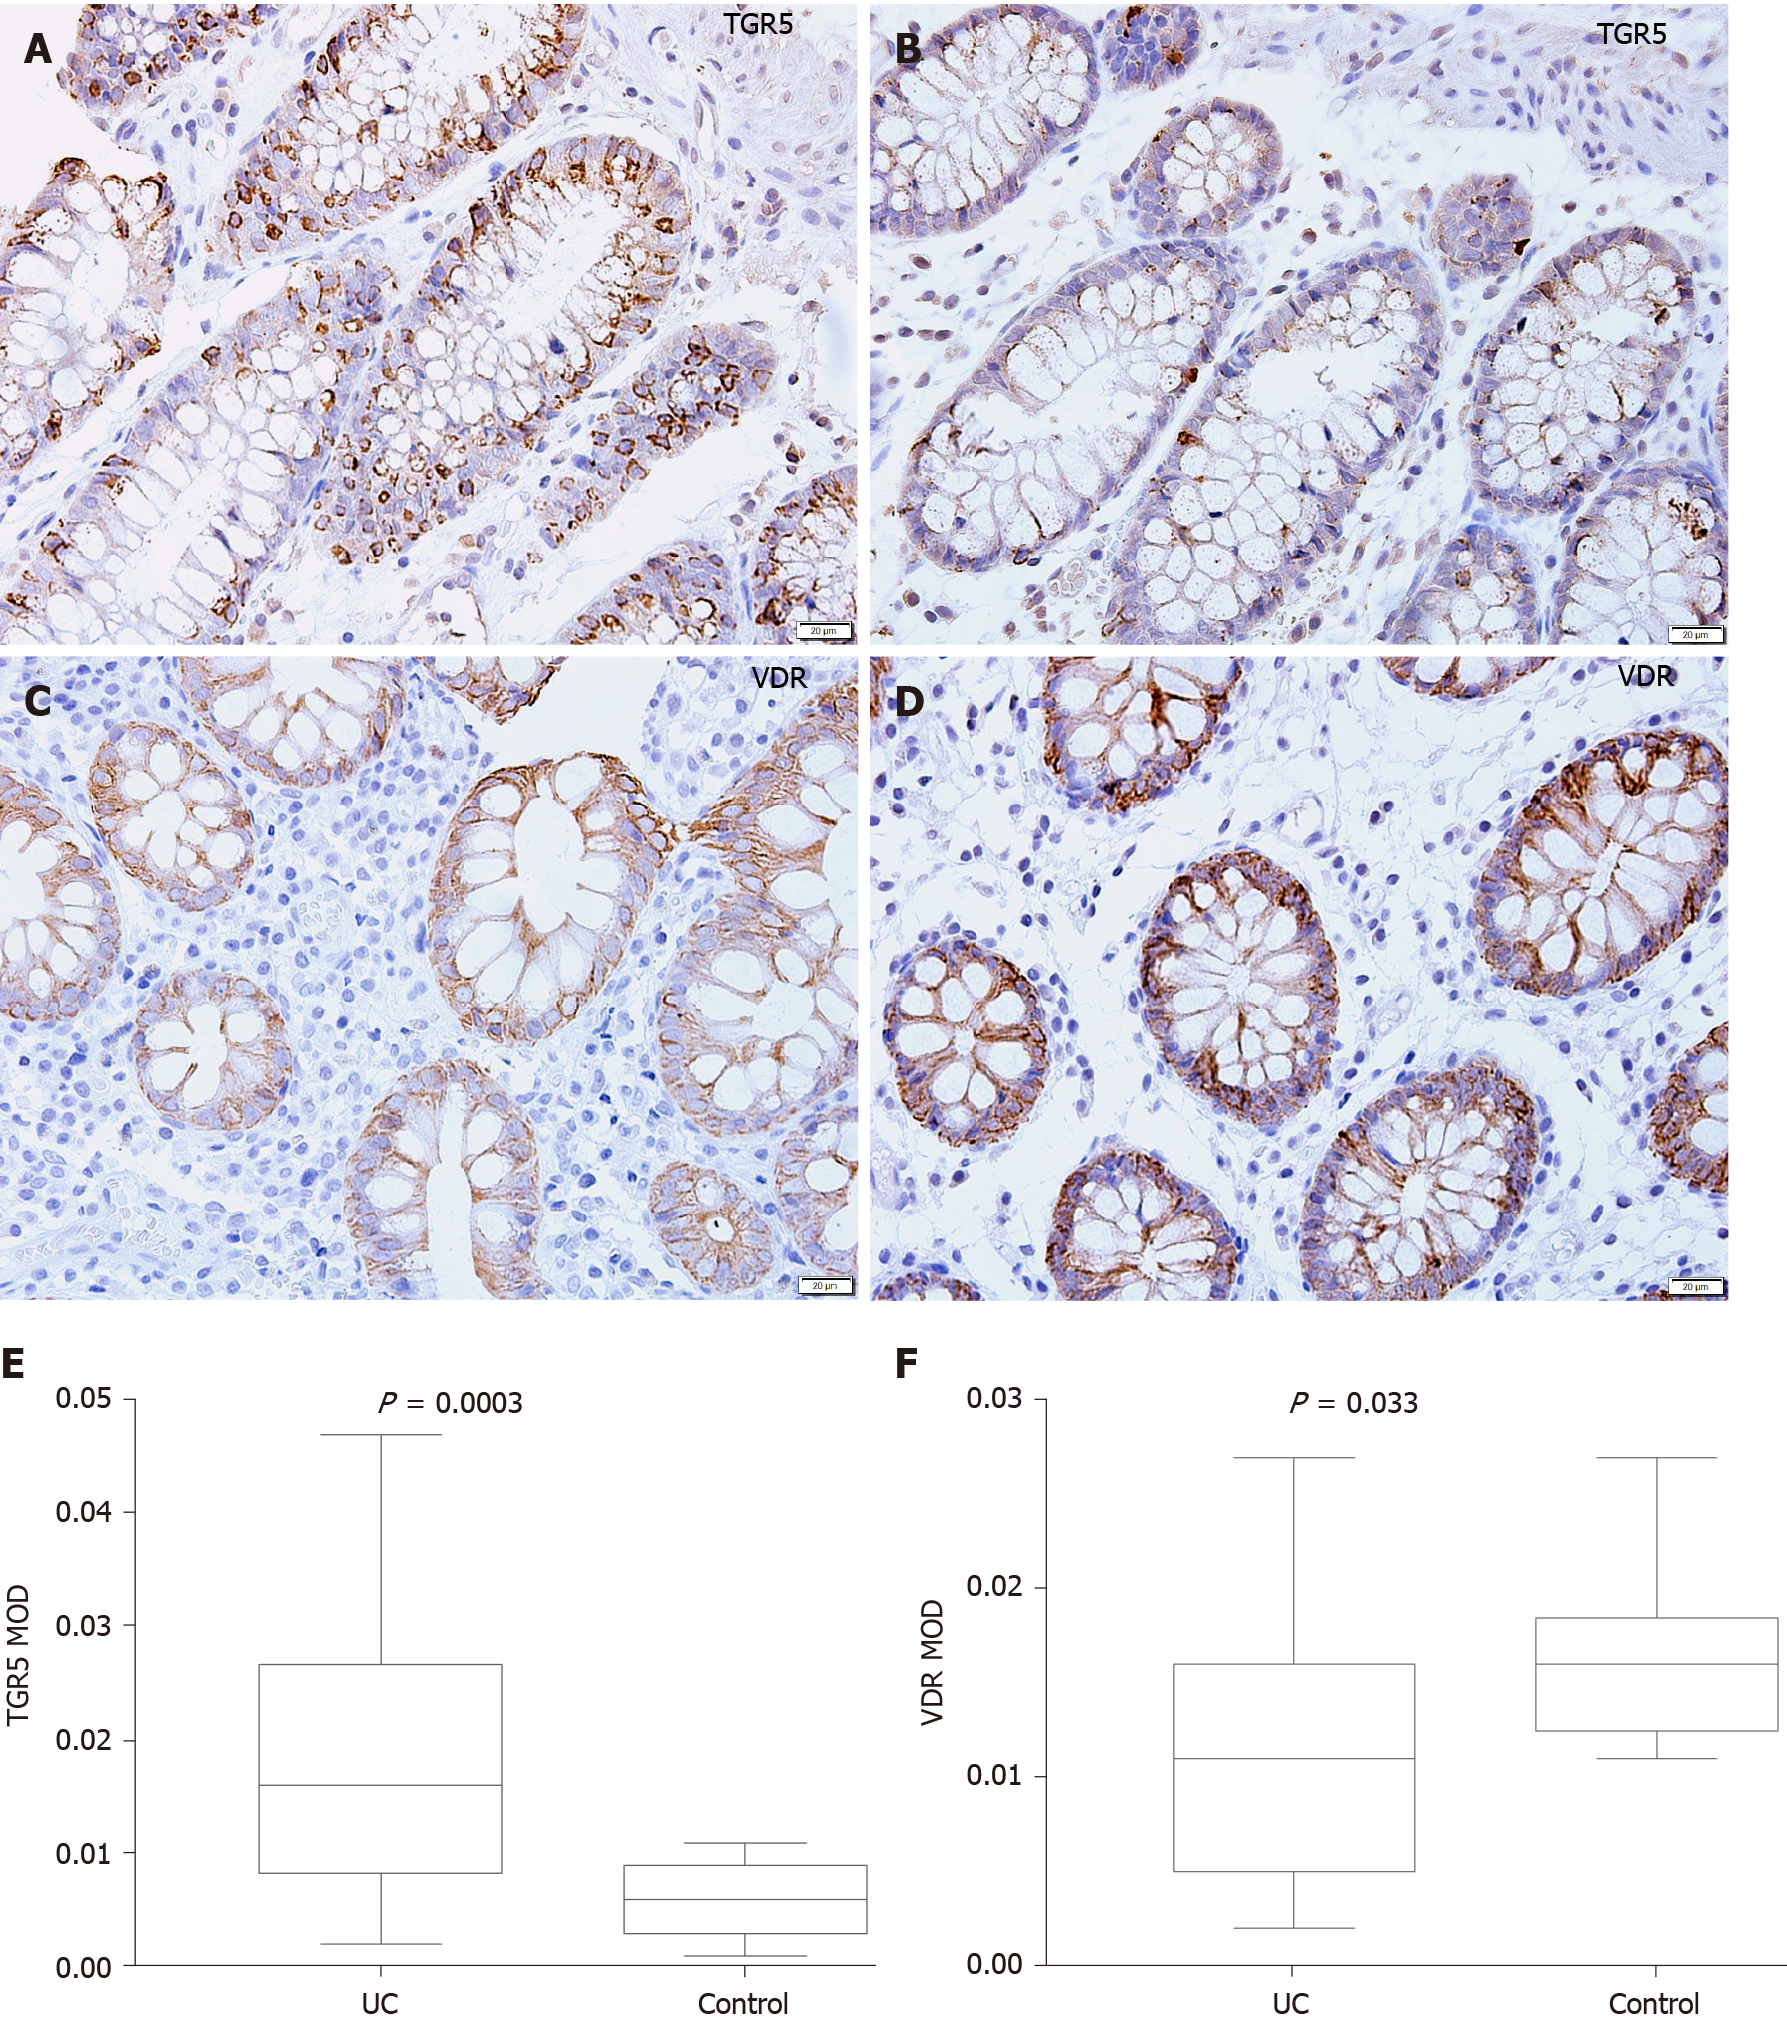
Figure 5 Mucosal immunohistochemistry in patients with ulcerative colitis and healthy controls.
A and B: Takeda G protein-coupled receptor 5 (TGR5) immunoreactivity was mainly scattered in the epithelium in ulcerative colitis (UC) patients (scale bar = 20 μm); C and D: Vitamin D receptor (VDR) immunoreactivity was distributed in the epithelium and lamina propria in UC patients and healthy controls (Scale bar = 20 μm); E: The mean optical density of TGR5 in the colonic mucosa in UC patients was significantly higher than that in healthy controls (P = 0.0003); F: The mean optical density of VDR in the colonic mucosa decreased significantly in patients (P = 0.033). UC: Ulcerative colitis; TGR5: Takeda G protein-coupled receptor 5; VDR: Vitamin D receptor; MOD: Mean optical density.
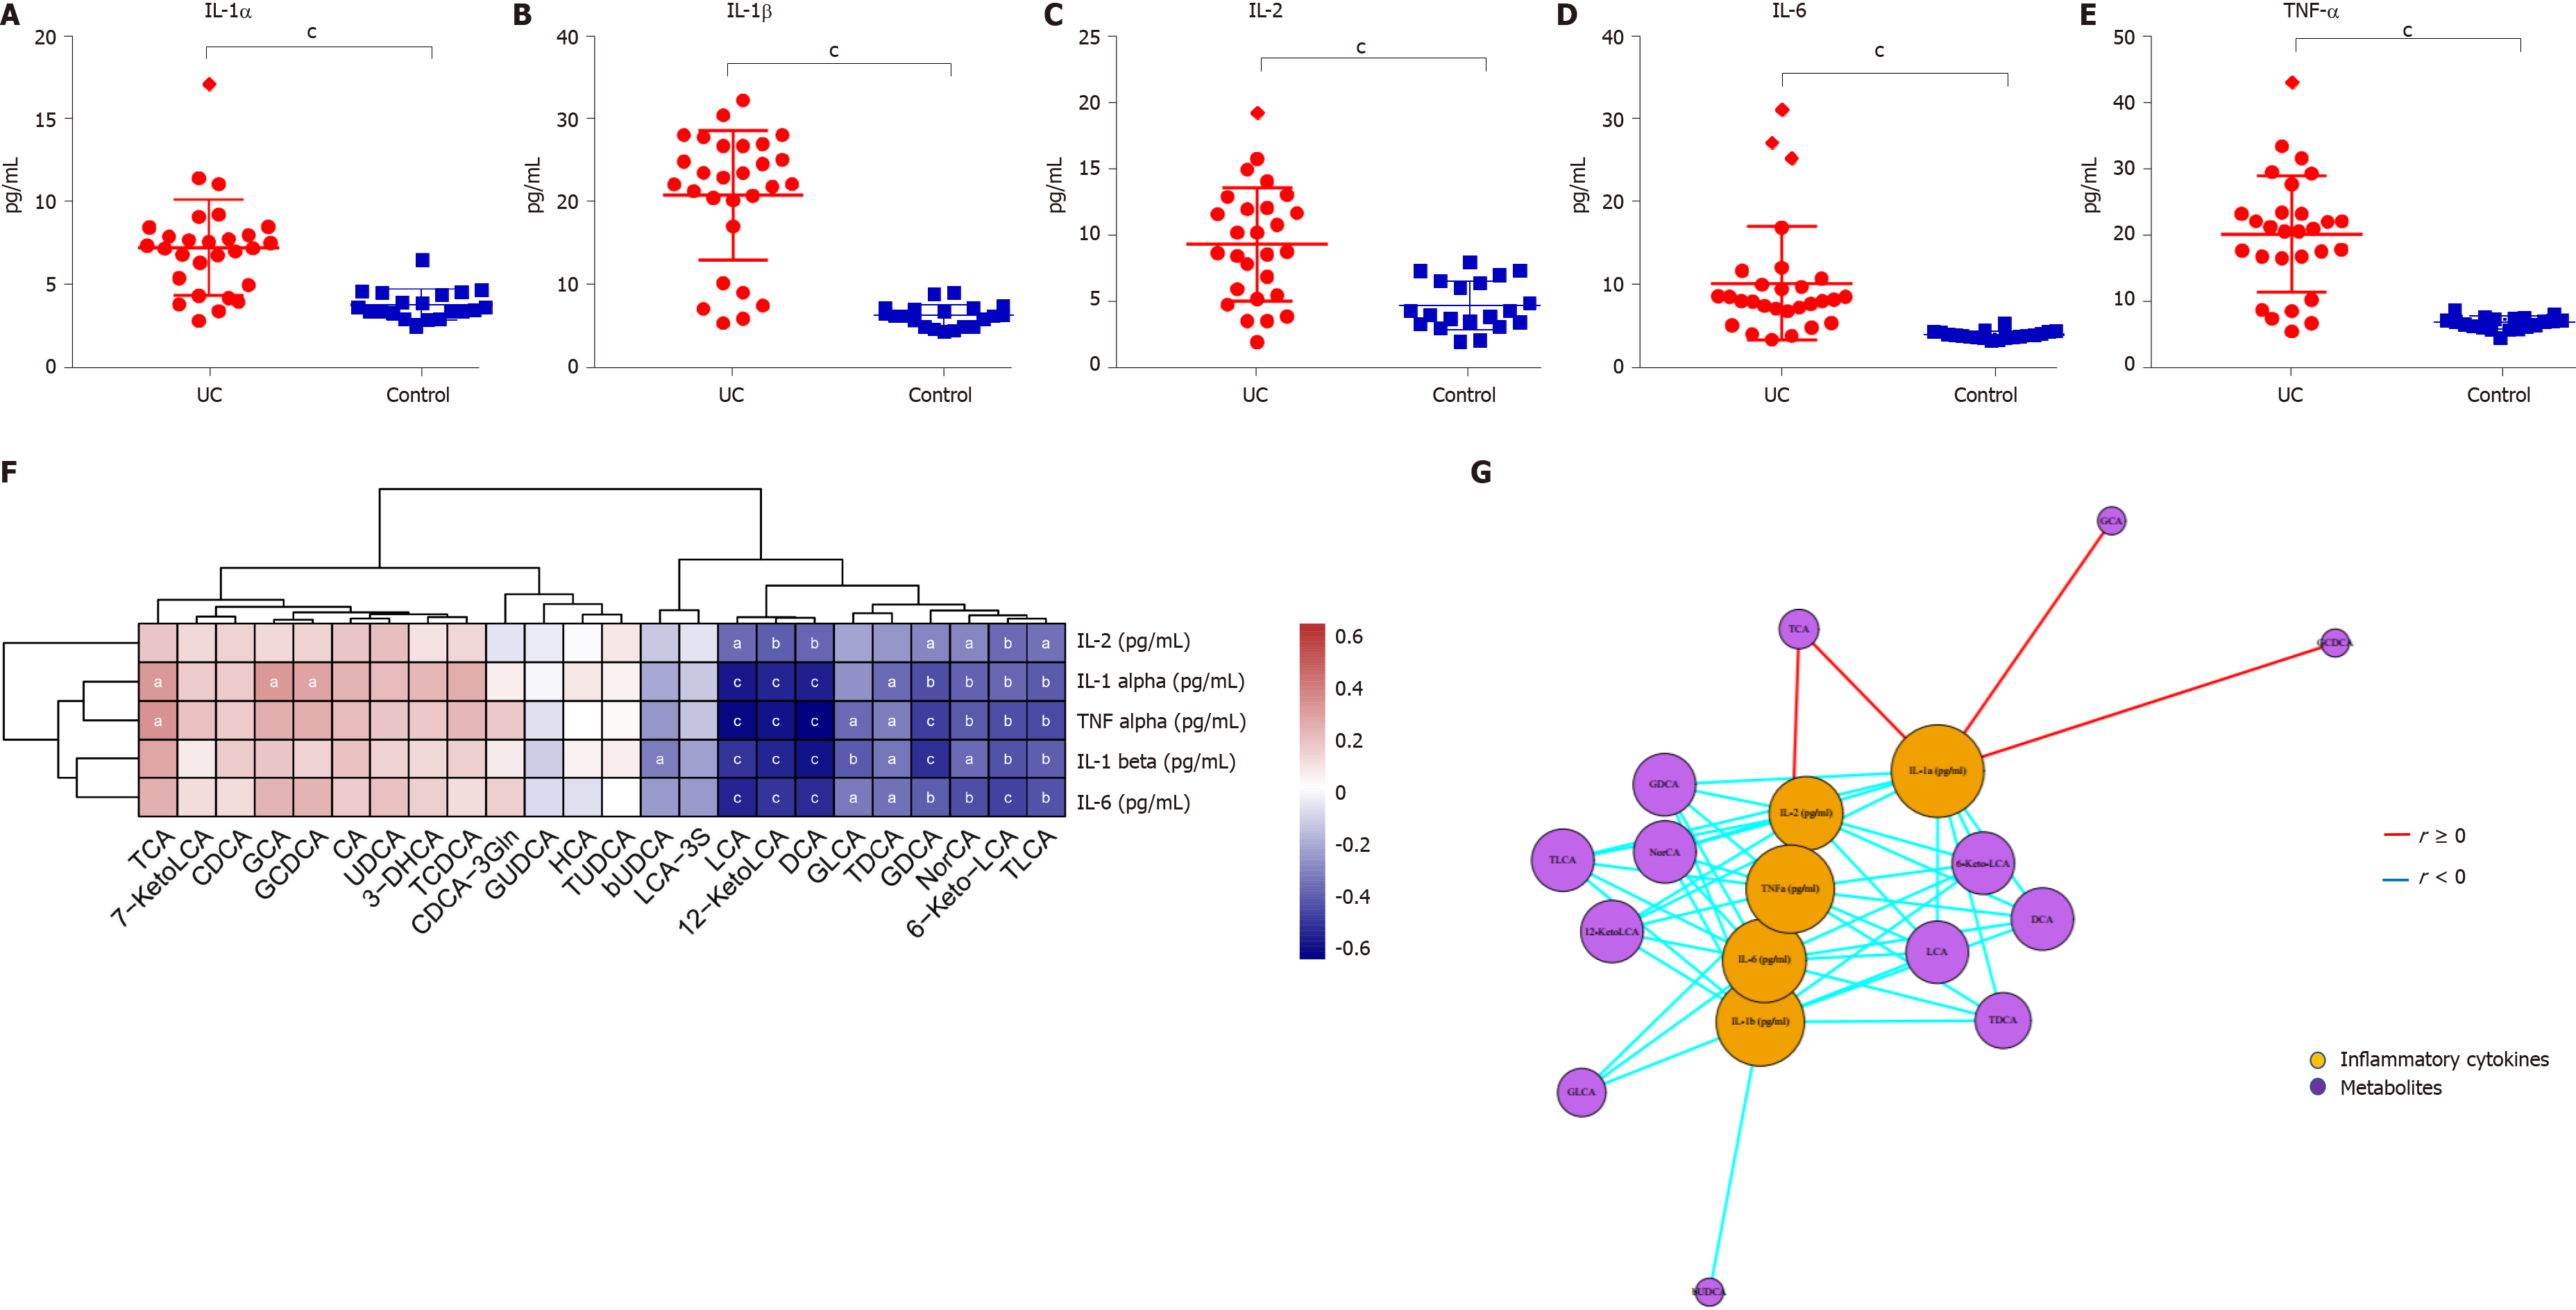
Figure 6 Serum inflammatory cytokine levels and correlations between fecal bile acids and serum inflammatory cytokines in all subjects.
A-E: The levels of IL-1α, IL-1β, TNF-α, IL-2, and IL-6 were significantly higher in UC patients (P < 0.0001); F: A heatmap of correlative assessments was made of the fecal bile acids and serum inflammatory cytokines ( aP < 0.05, bP < 0.01, cP < 0.001); G: A network diagram of correlative assessments was made on the fecal bile acid metabolites and serum inflammatory cytokines (purple nodes represent bile acid metabolites and orange nodes represent inflammatory cytokines; red lines represent positive correlations and blue lines represent negative correlations). aP < 0.05, bP < 0.01, cP < 0.001. LCA: Lithocholic acid; DCA: Deoxycholic acid; GDCA: Glyco-deoxycholic acid; GLCA: Glyco-lithocholic acid; TLCA: Tauro-lithocholate; TDCA: Tauro-deoxycholic acid; UDCA: Ursodeoxycholic acid; TUDCA: Tauro-ursodeoxycholic acid; GUDCA: Glyco-ursodeoxycholic acid; TCA: Tauro-cholic acid; CA: Cholic acid; TCDCA: Tauro-chenodeoxycholic acid; GCDCA: Glyco-chenodeoxycholic acid; CDCA: Chenodeoxycholic acid; GCA: Glyco-cholic acid.
- Citation: Yang ZH, Liu F, Zhu XR, Suo FY, Jia ZJ, Yao SK. Altered profiles of fecal bile acids correlate with gut microbiota and inflammatory responses in patients with ulcerative colitis. World J Gastroenterol 2021; 27(24): 3609-3629
- URL: https://www.wjgnet.com/1007-9327/full/v27/i24/3609.htm
- DOI: https://dx.doi.org/10.3748/wjg.v27.i24.3609


