Copyright
©The Author(s) 2021.
World J Gastroenterol. Jun 28, 2021; 27(24): 3581-3594
Published online Jun 28, 2021. doi: 10.3748/wjg.v27.i24.3581
Published online Jun 28, 2021. doi: 10.3748/wjg.v27.i24.3581
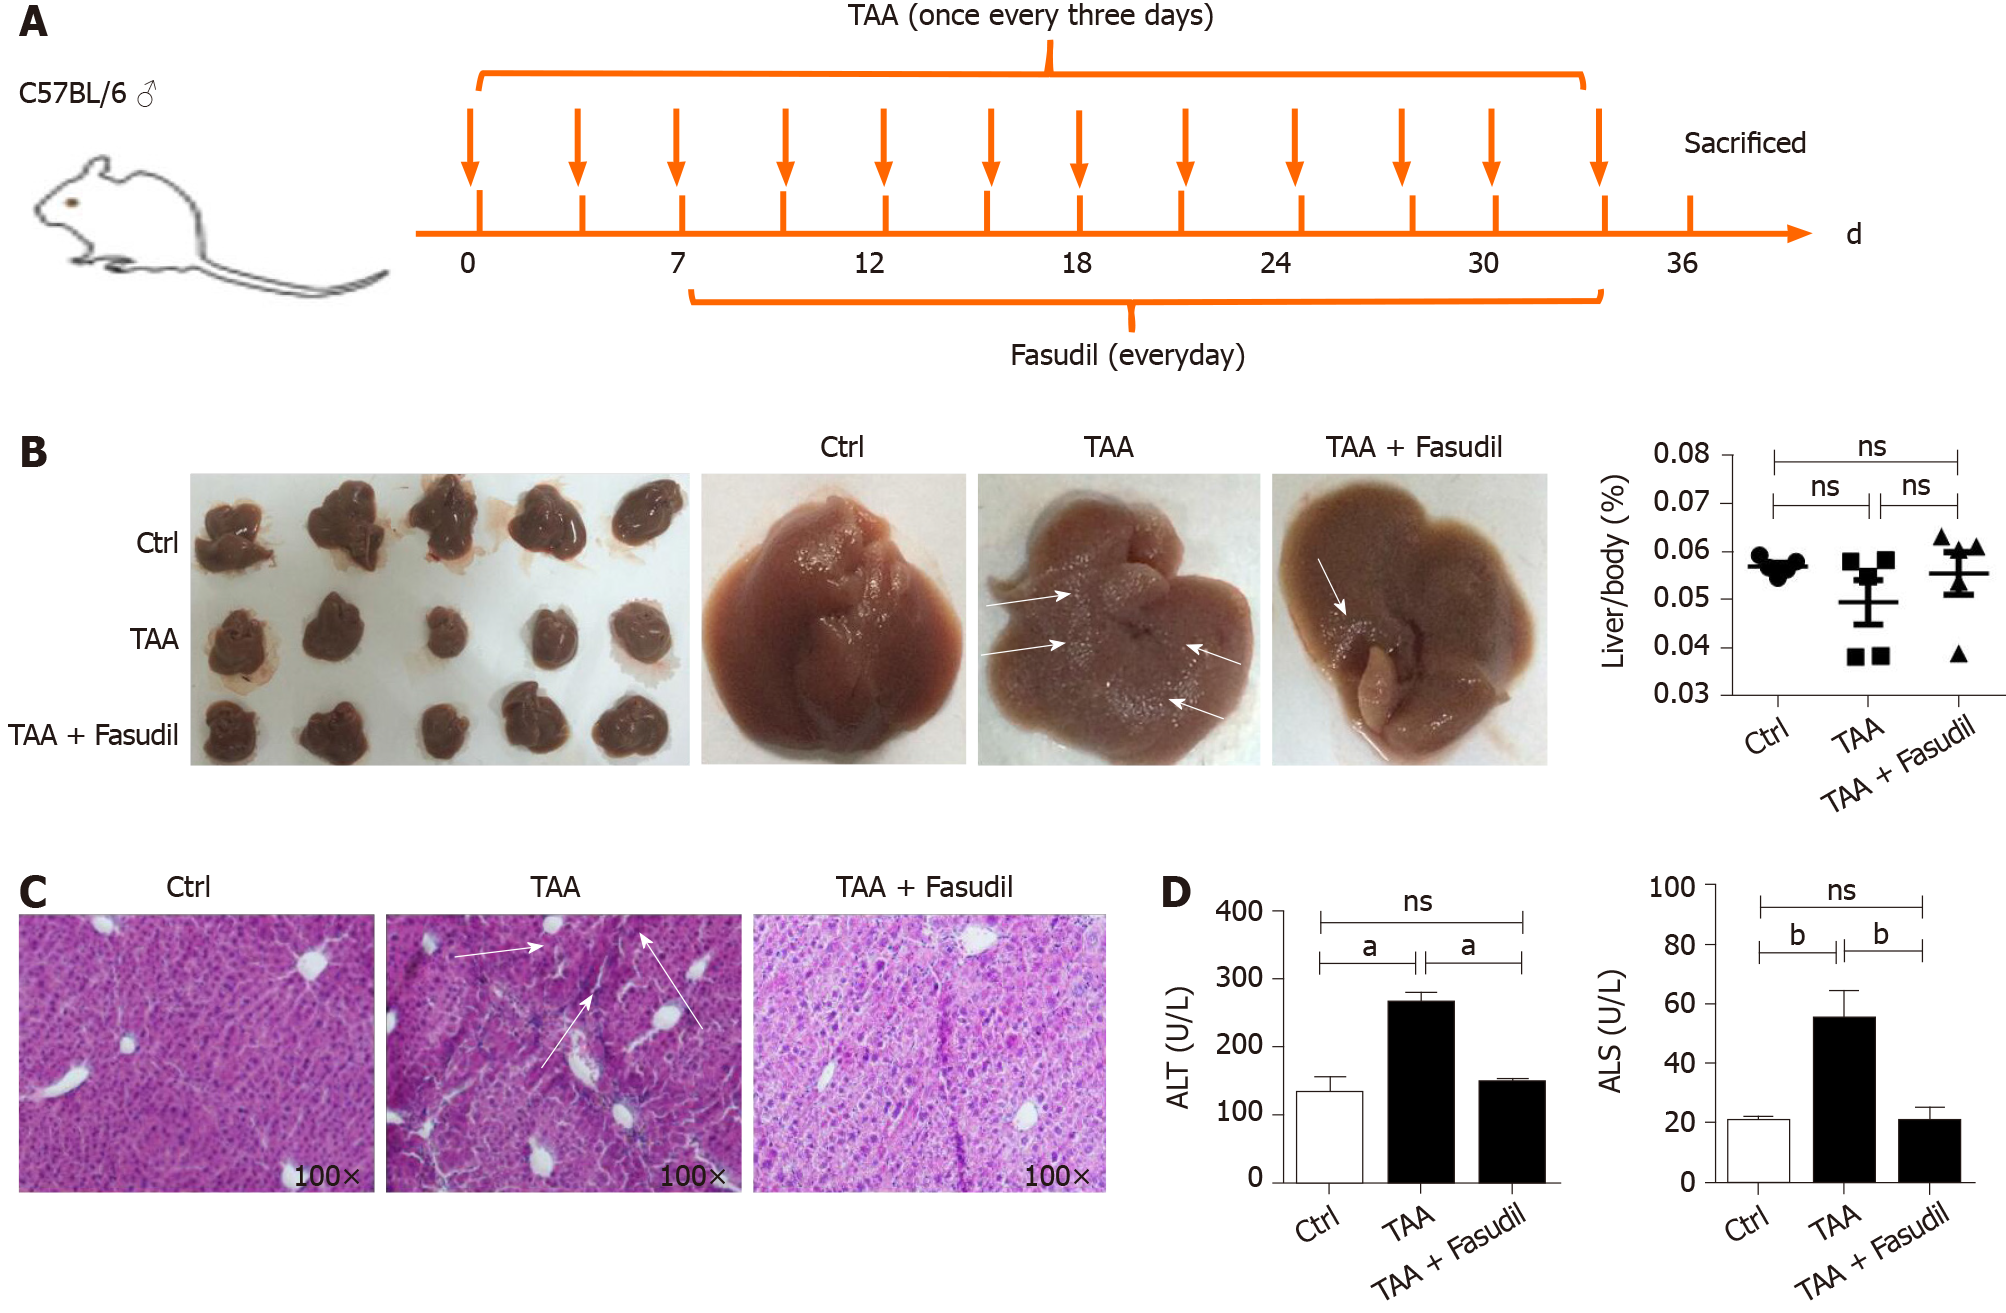
Figure 1 Fasudil protects thioacetamide-induced liver injury.
A: Establishment of a liver fibrosis mouse model; B: Representative detection of liver images is shown. Gross pathological examination of liver taken from normal control, thioacetamide (TAA)-treated, and TAA + Fasudil-treated groups, and the liver/body ratio was assayed among these three groups; C: Histological observation of liver fibrosis by hematoxylin and eosin staining under light-field microscope with × 100 magnification; D: Enzyme-linked immunoassay was used to assess the level of serum alanine aminotransferase and aspartate aminotransferase. Data represent the mean ± SD from at least three independent experiments (n = 5/group). aP < 0.05, bP < 0.01.
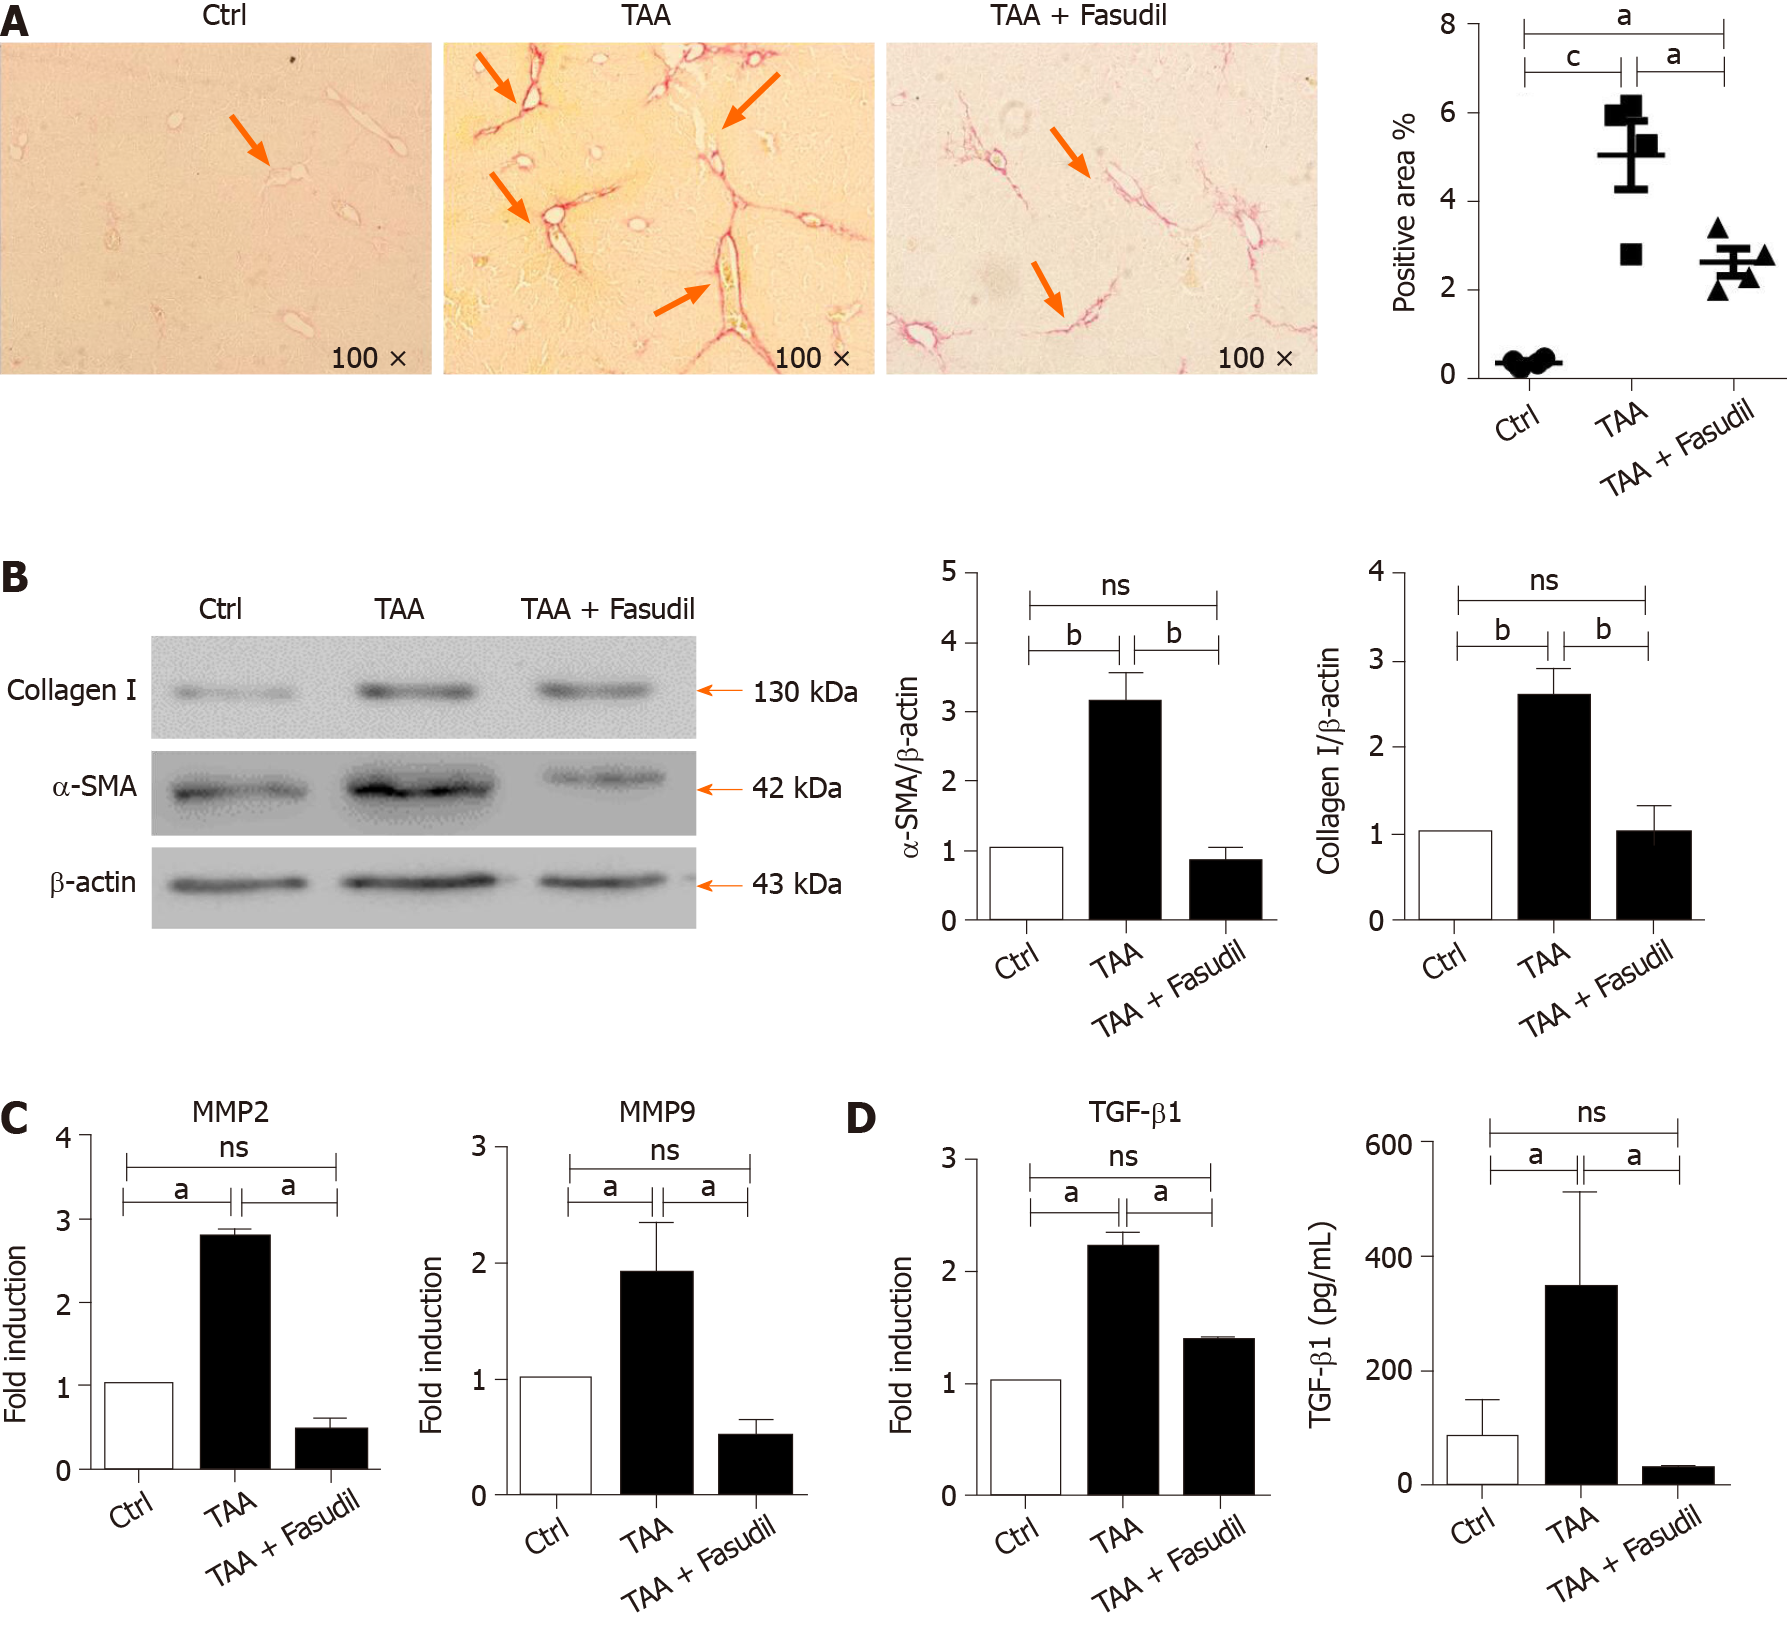
Figure 2 Fasudil prevents thioacetamide-induced liver fibrosis.
A: Histological observation of collagen deposition by sirius red staining under a light-field microscope with × 100 magnification (left). Quantitative analysis of sirius red staining of each group (right); B: Expression of alpha smooth muscle actin (a-SMA) and collagen I in liver tissues was assayed by western blotting. Right panel shows the quantification of α-SMA and collagen I protein levels; C: Levels of matrix metalloproteinase 2 (MMP2) and MMP9 mRNA in liver tissues were detected by real time-reverse transcription polymerase chain reaction (RT-PCR); D: Hepatic expression of transforming growth factor beta 1 (TGF-β1) mRNA was detected by real time-RT-PCR, the secretion level of TGF-β1 in serum was assayed by enzyme-linked immunoassay. Data represent the mean ± SD from at least three independent experiments. aP < 0.05, bP < 0.01.
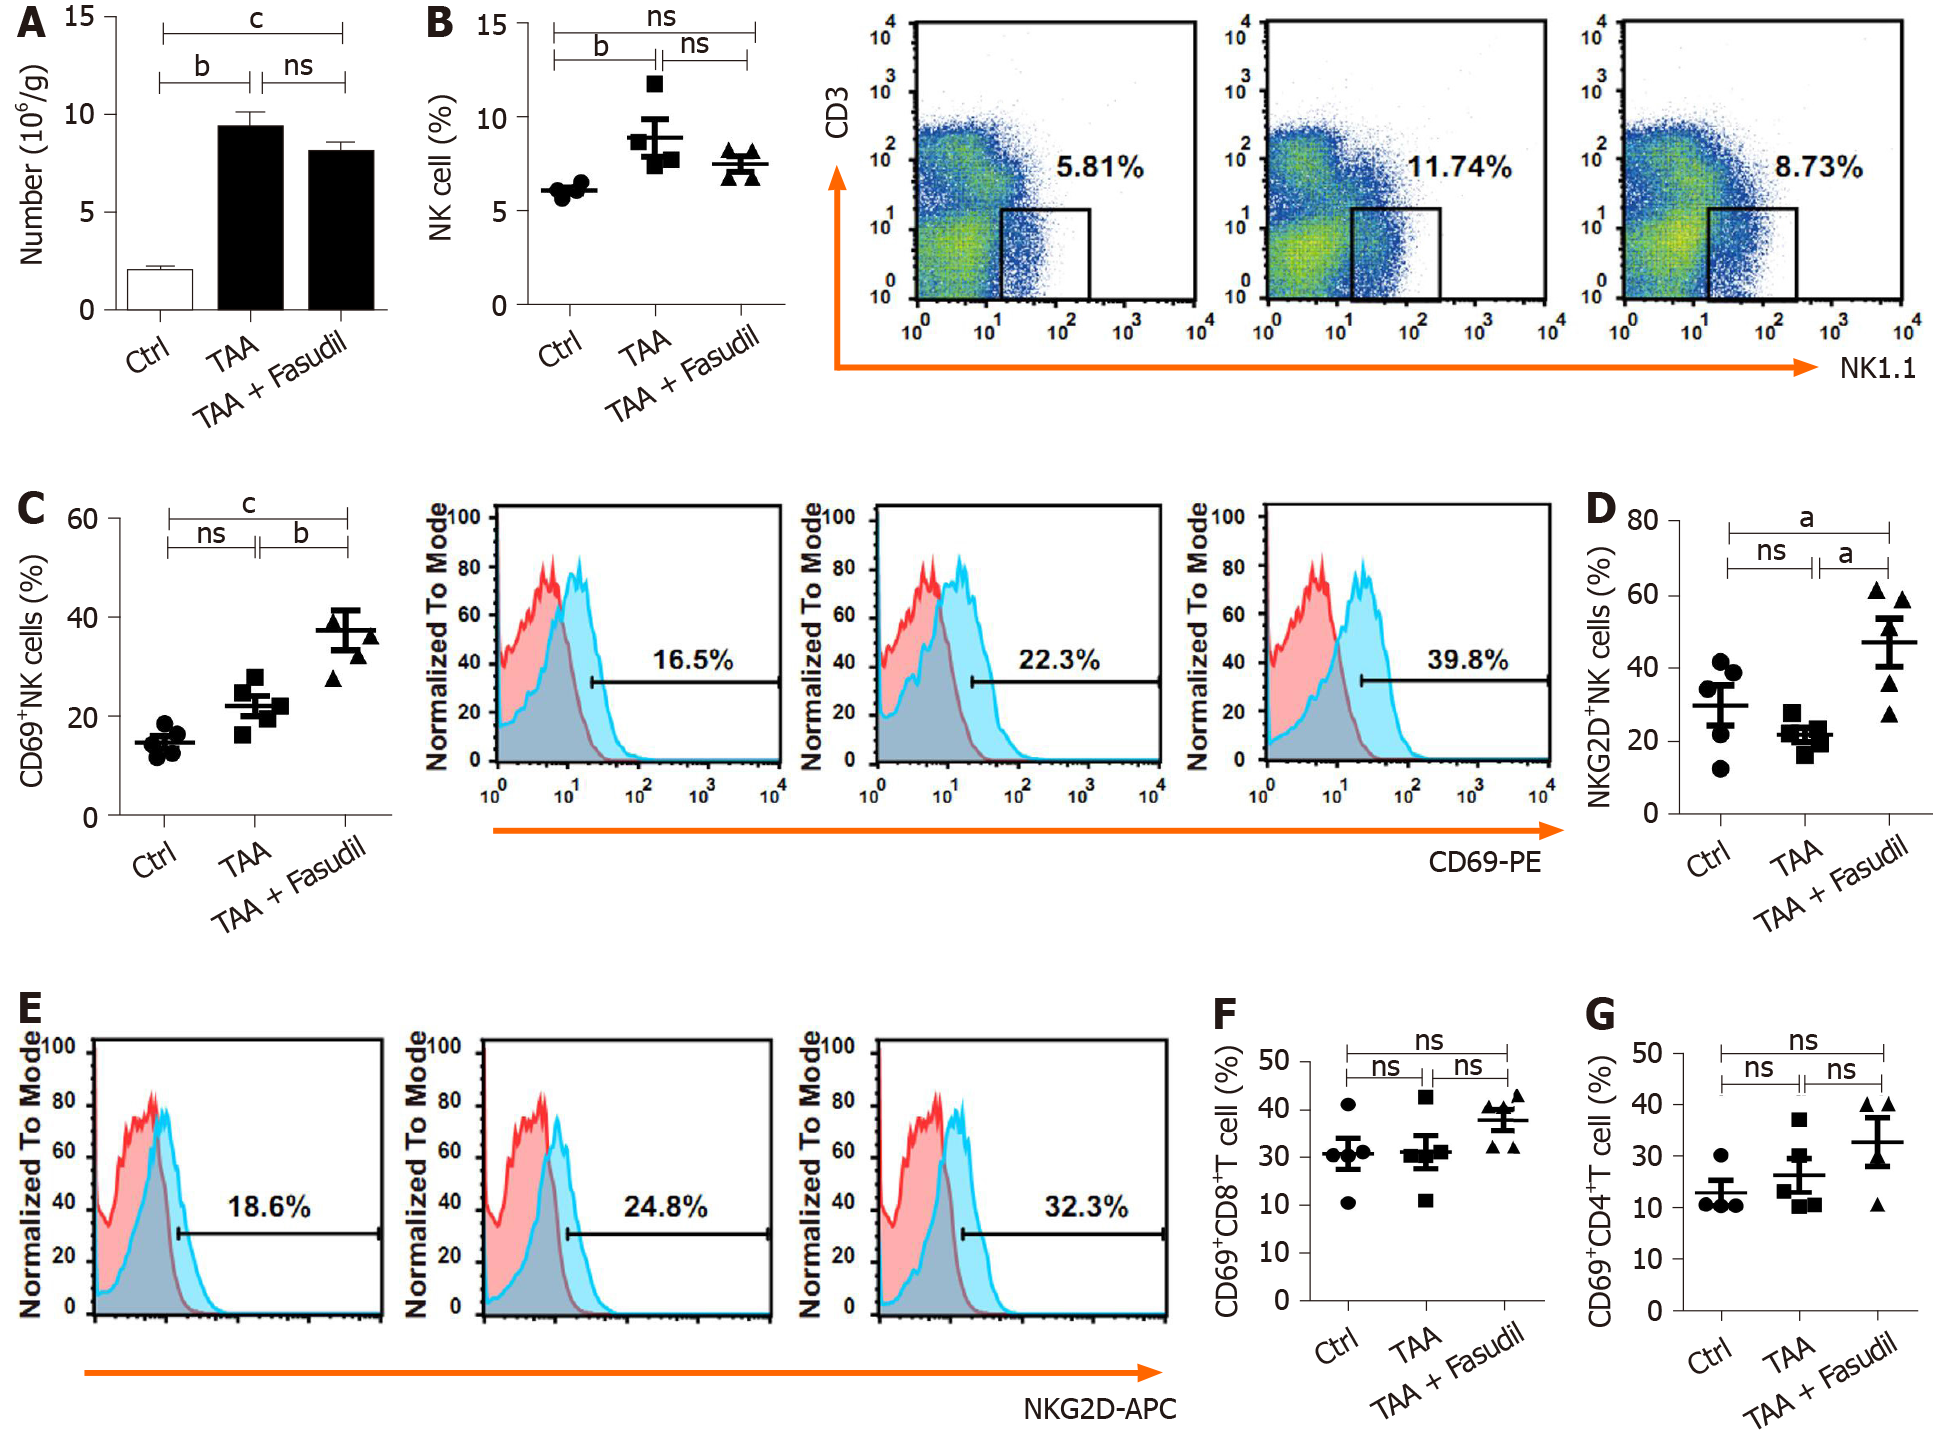
Figure 3 Natural killer cells are activated in a Fasudil-treated liver fibrotic mouse model.
After the last treatment, the mice were sacrificed and the intrahepatic lymphocytes were isolated. A: Absolute number of mononuclear cells in the liver from the normal control, thioacetamide (TAA)-induced, and TAA + Fasudil groups was assessed; B-G: Then the percentages and representative fluorescence-activated cell sorting (FACS) plots of natural killer (NK) cells among lymphocytes (B), CD69+ NK cells and representative FACS plots (C), quantification of NKG2D+ NK cells (D), representative FACS plots of NKG2D on NK cells (E), CD69+CD8+ T cells (F) and CD69+CD4+ T cells (G) in liver from the above three groups were analyzed by FACS. Data represent the mean ± SD from at least three independent experiments (n = 5/group). aP < 0.05, bP < 0.01, cP < 0.001.
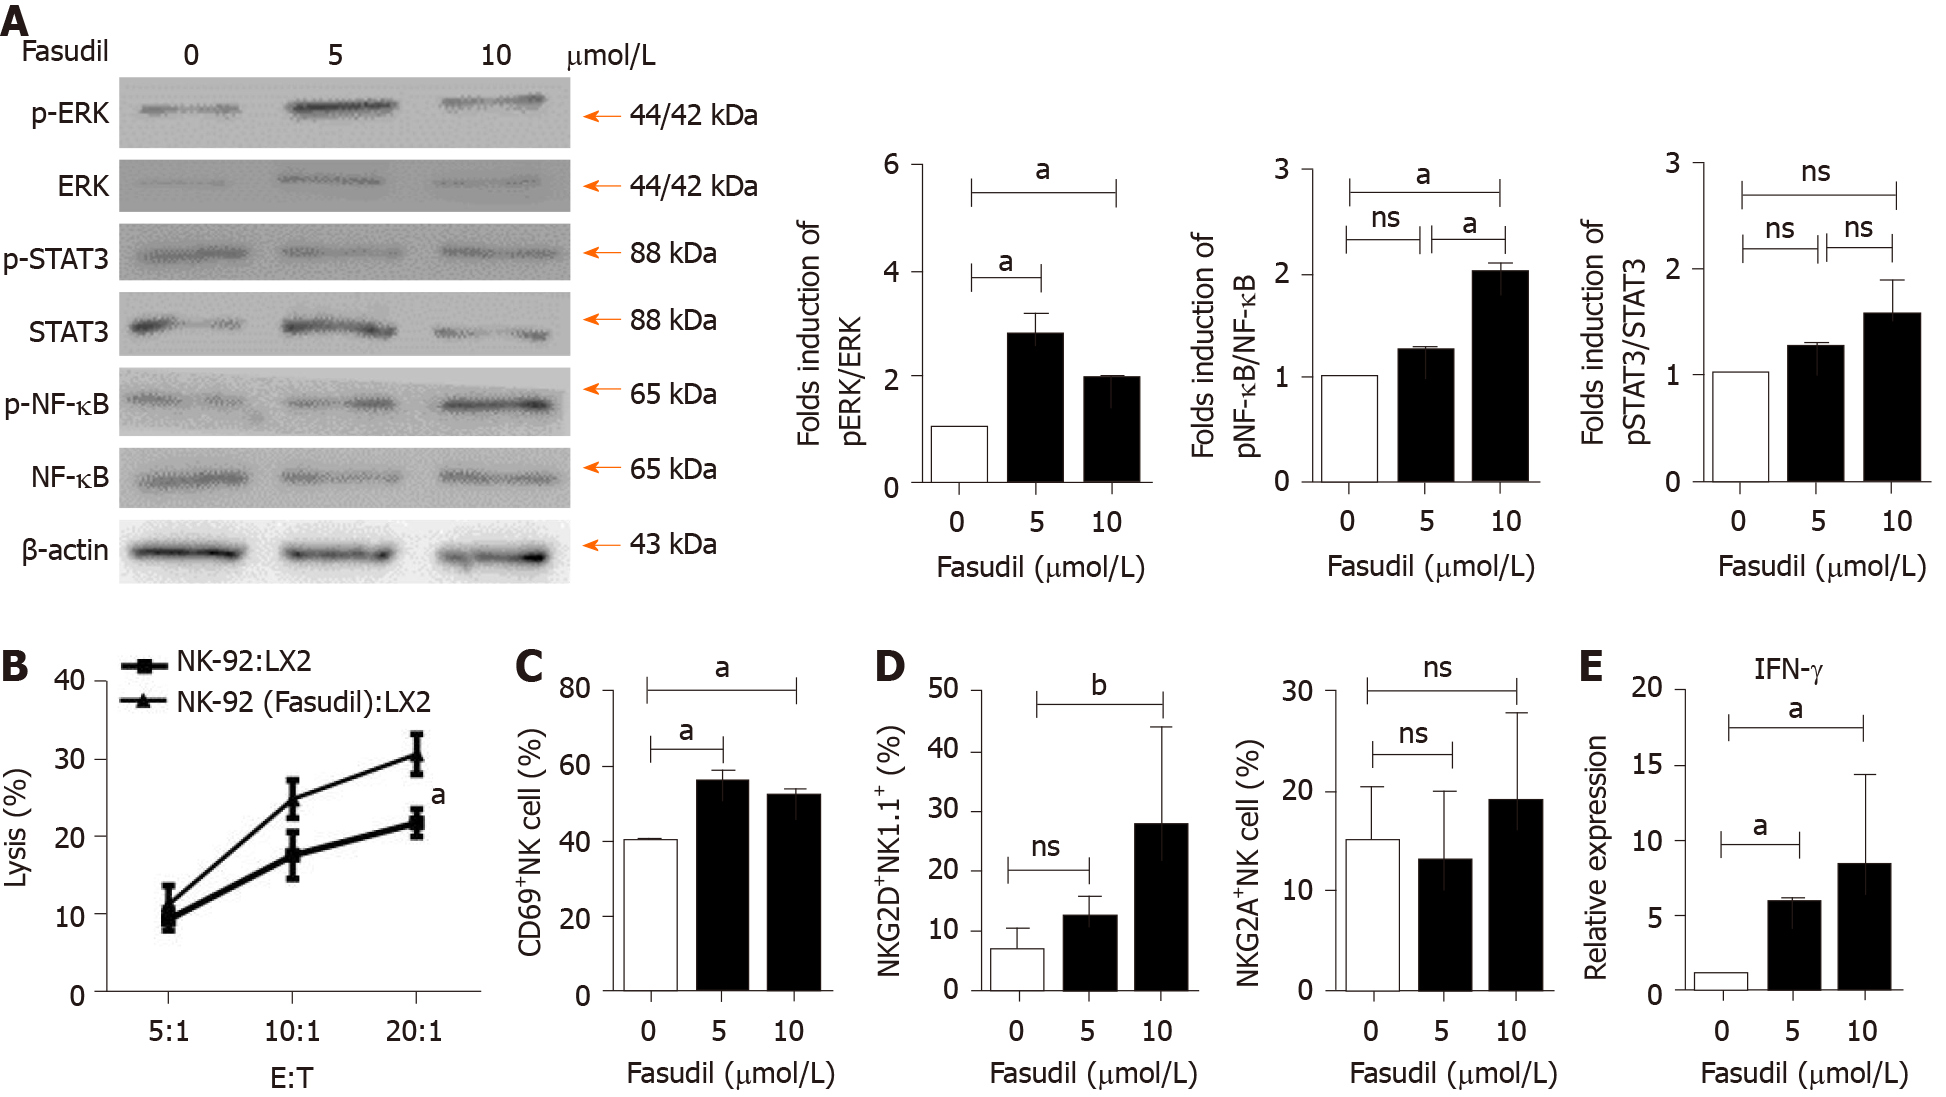
Figure 4 Fasudil can promote natural killer cell activation via extracellular signal-related kinase and nuclear factor kappa B signaling pathways.
A: Natural killer (NK)-92 cells were treated with different concentrations of Fasudil (5 mM, 10 mM) for 24 h in vitro, and extracellular signal-related kinase (ERK), nuclear factor kappa B (NF-kB), and signal transducer and activator of transcription 3 (STAT3) levels were detected by western blotting. Then mononuclear cells from the livers of normal mice were isolated and then treated with Fasudil (5 mM, 10 mM) for 24 h in vitro; B: 1 × 104 LX2 cells were seeded into 96-well plates. NK-92 cells pretreated with Fasudil (10 mM) were added at different ratios (1:20, 1:10, or 1:5) for 12 h. Then the cytotoxicity was analyzed; C-E: Frequencies of CD69+ NK cells (C), NKG2D NK cells, and NKG2A NK cells (D), as well as the proportion of IFN-γ-producing NK cells (D) were analyzed by FACS (E). Data represent the mean ± SD from at least three independent experiments. aP < 0.05, bP < 0.01, cP < 0.001.
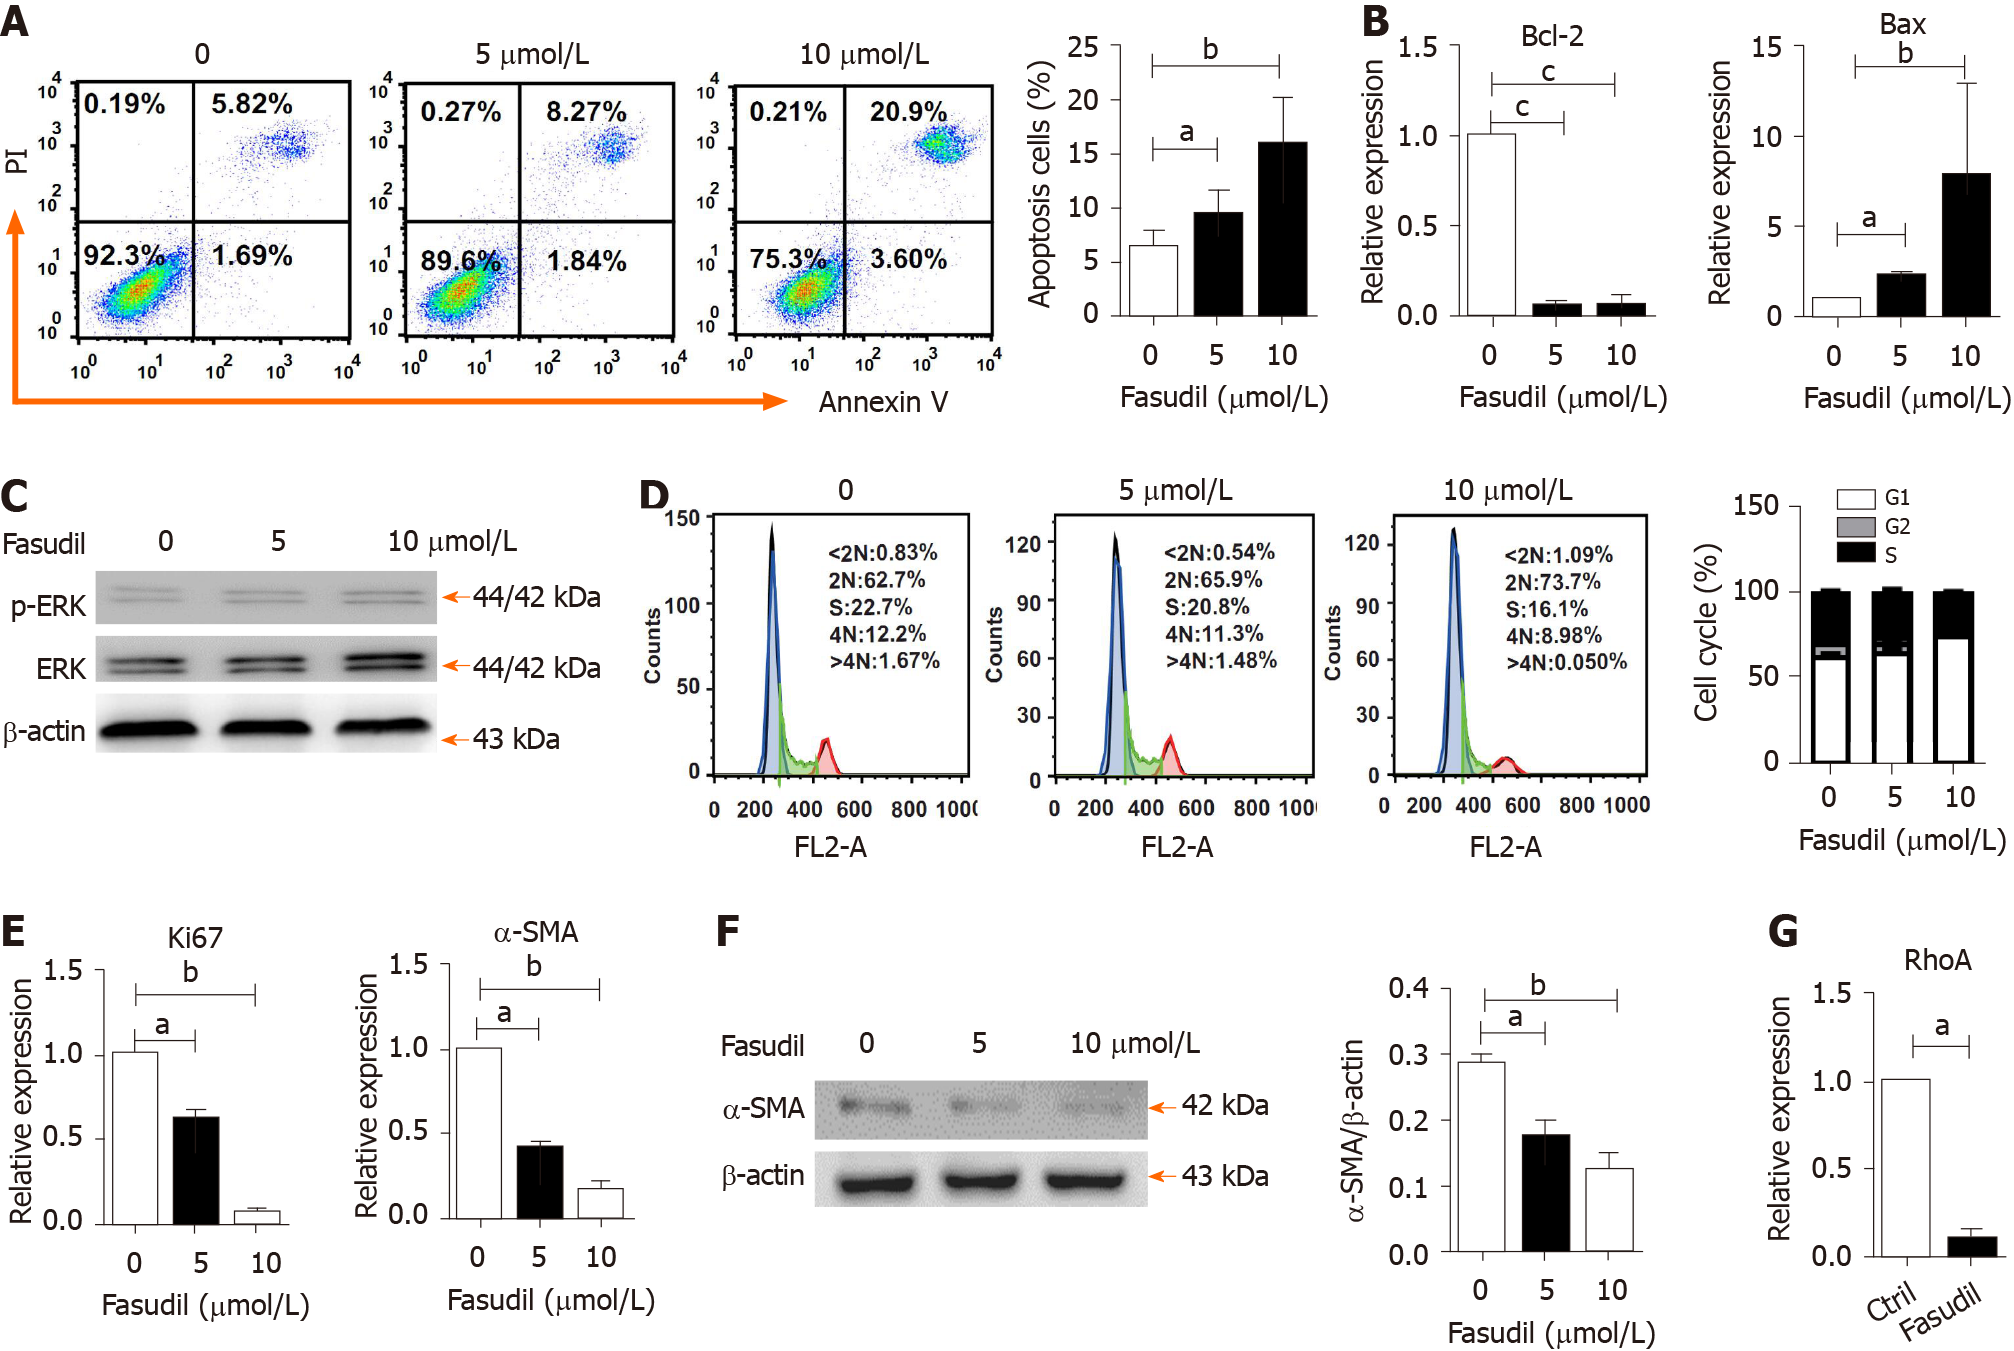
Figure 5 Fasudil inhibits the proliferation but promotes the apoptosis of hepatic stellate cells.
A: LX2 cells were treated with different concentrations of Fasudil (5 mM, 10 mM) for 24 h in vitro; B: The apoptosis of LX2 cells was analyzed by fluorescence-activated cell sorting (FACS). mRNA levels of B-cell lymphoma 2 (Bcl-2) and Bcl-2-associated X protein (Bax) in LX2 cells were detected by quantitative real-time reverse transcription polymerase chain reaction (qRT-PCR); C: The phosphorylated extracellular signal-related kinase (ERK)/ERK levels in LX2 cells were detected by western blotting. The cell cycle of LX2 cells was analyzed by FACS; D: Left panel shows the representative FACS plots of cell cycle, and right panel shows the quantification of percentage of cells in G1, S and G2 phase; E: Relative expression level of Ki67 and alpha smooth muscle actin (α-SMA) mRNA in LX2 cells was analyzed by qRT-PCR; F: α-SMA level in LX2 cells was analyzed by western blotting; G: mRNA levels of Ras homology family member A in LX2 cells were analyzed by qRT-PCR. Data represent the mean ± SD from at least three independent experiments. aP < 0.05, bP < 0.01, cP < 0.001.
- Citation: Han QJ, Mu YL, Zhao HJ, Zhao RR, Guo QJ, Su YH, Zhang J. Fasudil prevents liver fibrosis via activating natural killer cells and suppressing hepatic stellate cells. World J Gastroenterol 2021; 27(24): 3581-3594
- URL: https://www.wjgnet.com/1007-9327/full/v27/i24/3581.htm
- DOI: https://dx.doi.org/10.3748/wjg.v27.i24.3581


