Copyright
©The Author(s) 2021.
World J Gastroenterol. Apr 14, 2021; 27(14): 1435-1450
Published online Apr 14, 2021. doi: 10.3748/wjg.v27.i14.1435
Published online Apr 14, 2021. doi: 10.3748/wjg.v27.i14.1435
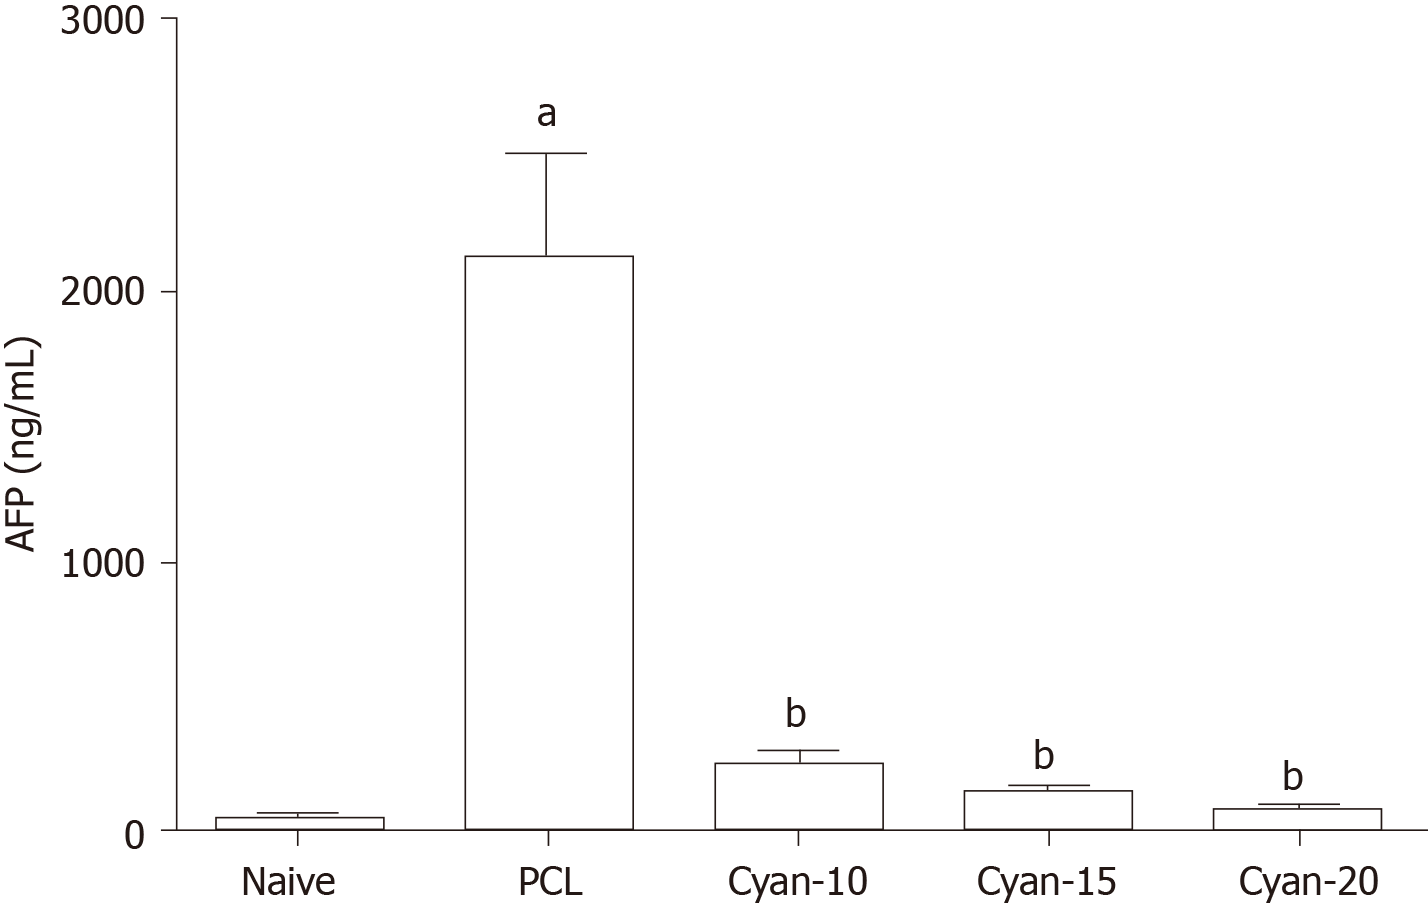
Figure 1 Effect of cyanidin 3-glucoside at different doses (10, 15 and 20 mg/kg/d) on alpha fetoprotein in the serum of rats.
Values are mean ± SEM; number of animals = 6 rats/each group. aP < 0.05 significant differences compared to naïve group, unpaired t test; bP < 0.05 significant differences compared to precancerous lesion group. PCL: Precancerous lesion; Cyan: Cyanidin-3-O-glucoside; AFP: Alpha fetoprotein.
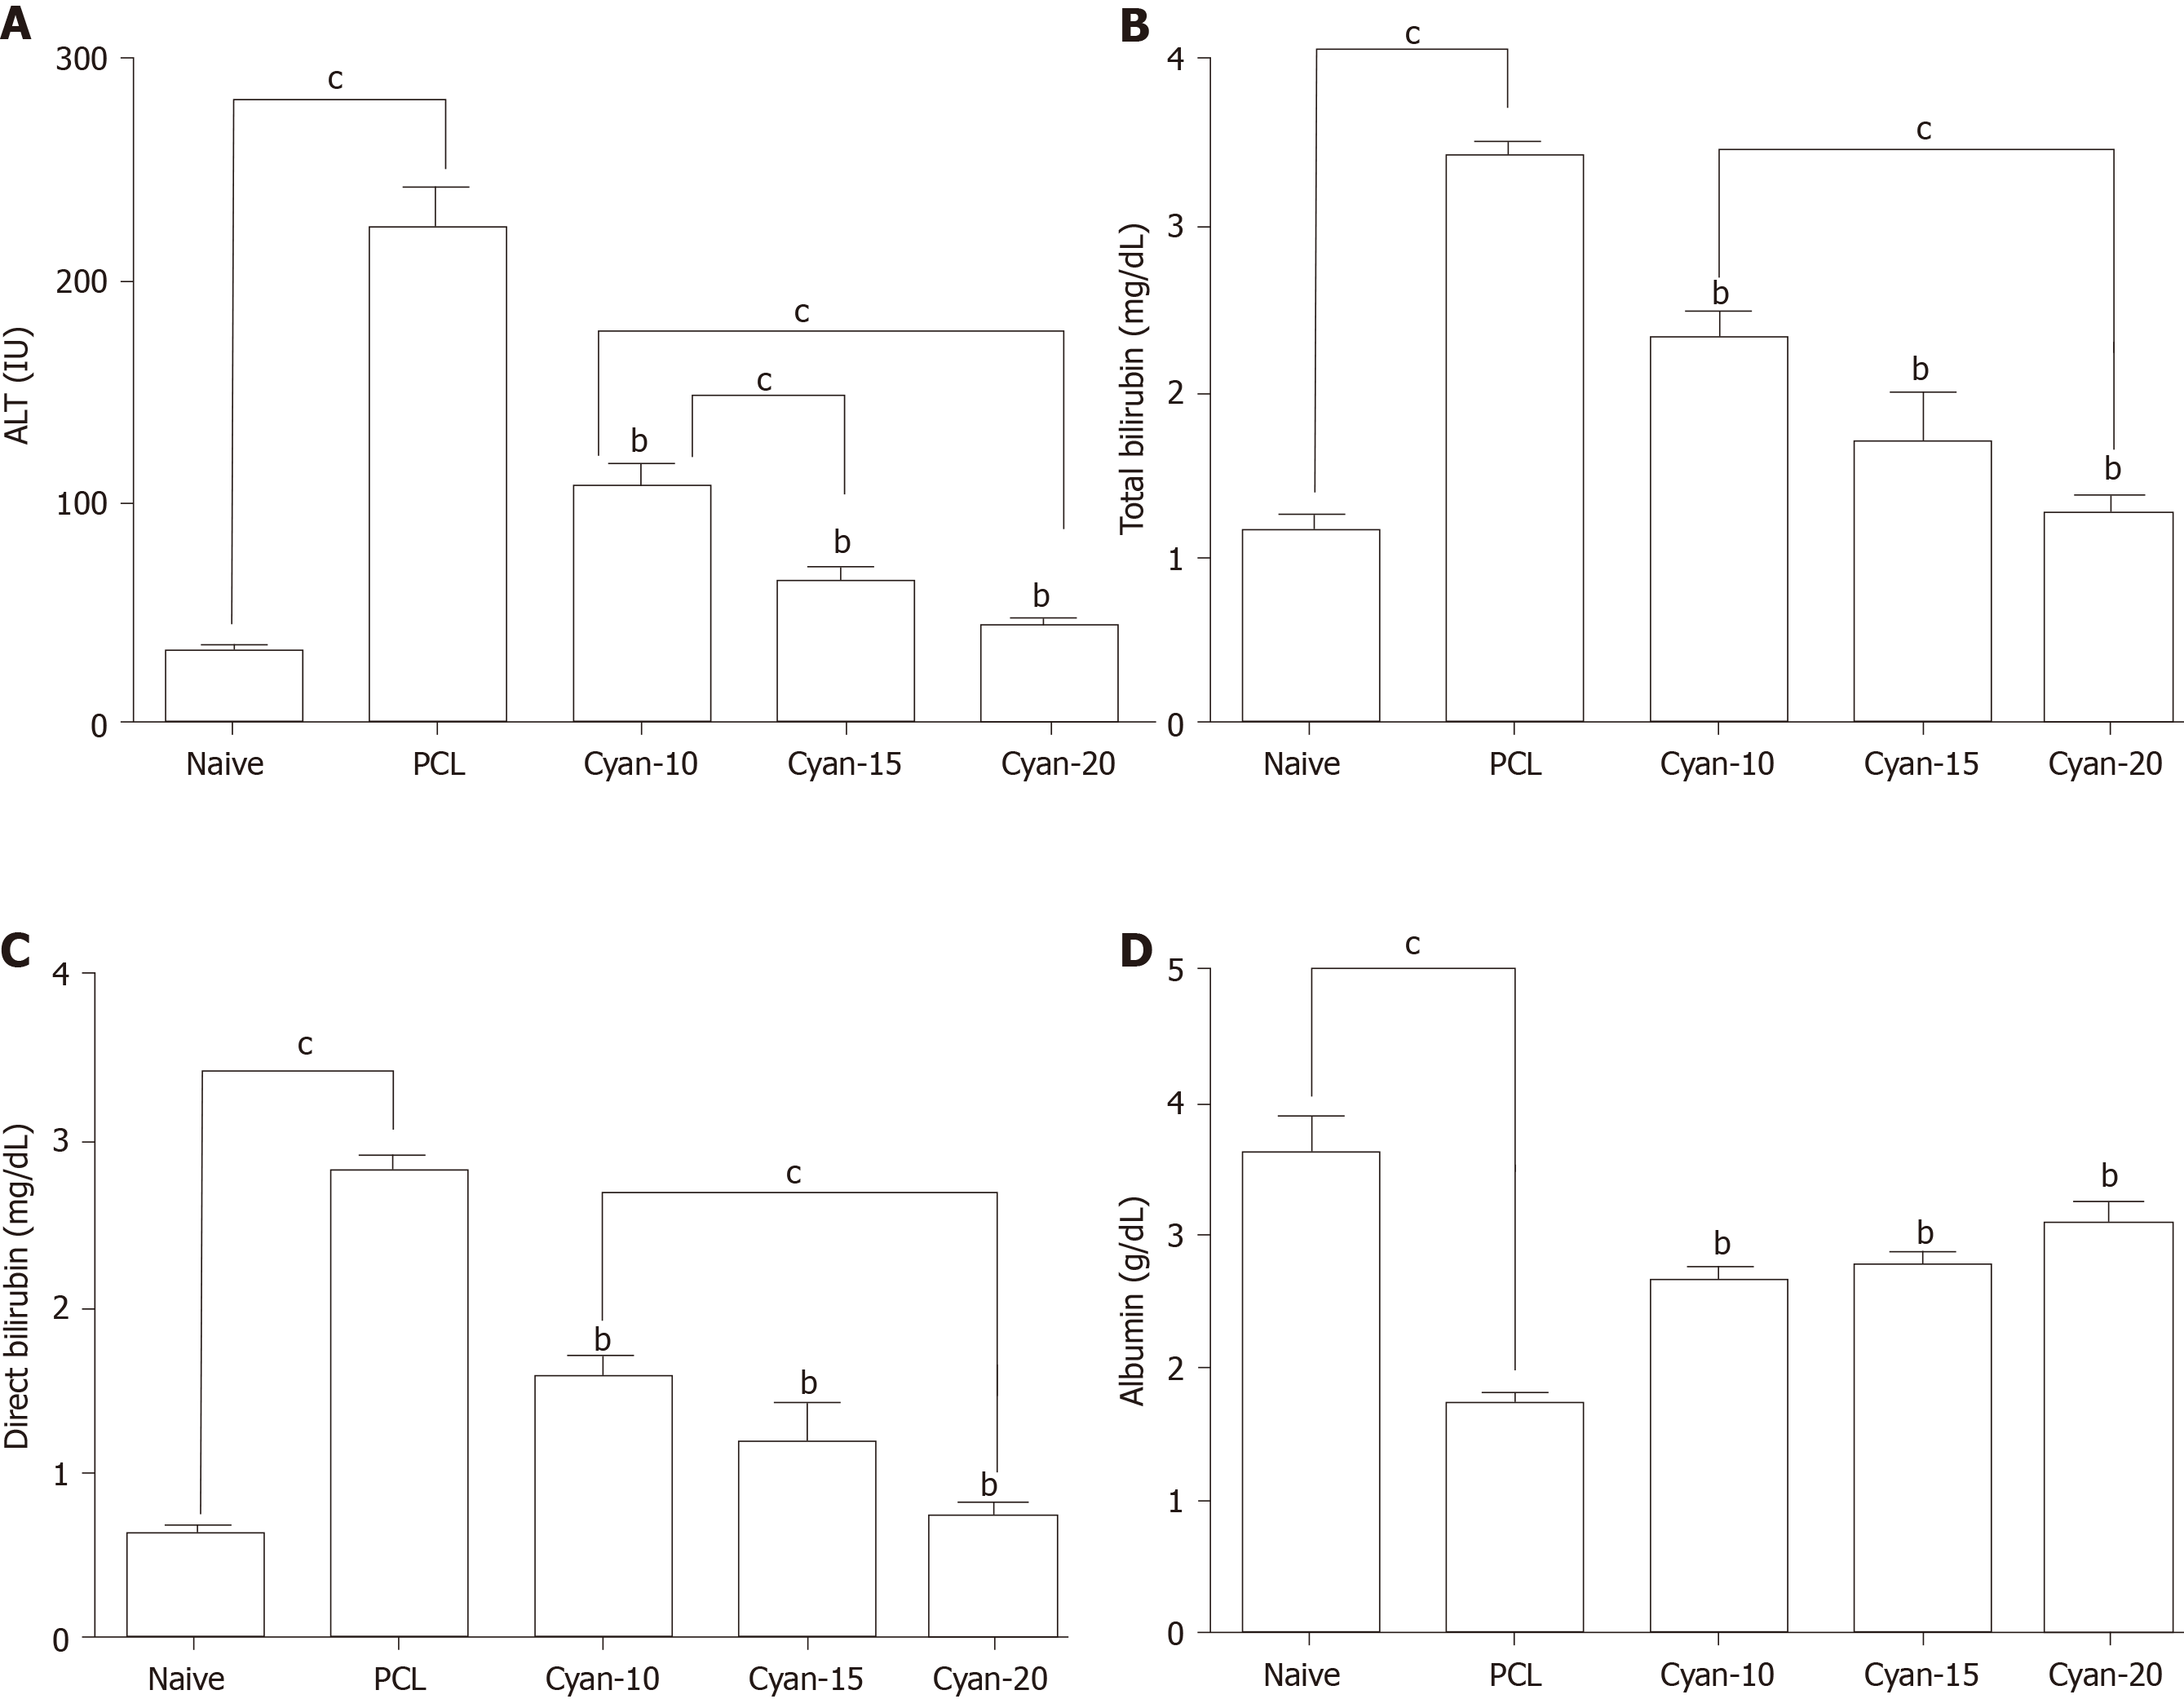
Figure 2 Effect of cyanidin 3-glucoside at different doses (10, 15 and 20 mg/kg/d) in rats.
A: Alanine aminotransferase; B: Total bilirubin; C: Direct bilirubin; D: Serum albumin. Values are mean ± SEM; number of animals = 6 rats/each group. bP < 0.05 significant differences compared to precancerous lesion group; cP < 0.05 significant differences between the 2 selected groups, One-way ANOVA followed by Tukey’s test. PCL: Precancerous lesion; Cyan: Cyanidin-3-O-glucoside; ALT: Alanine aminotransferase.
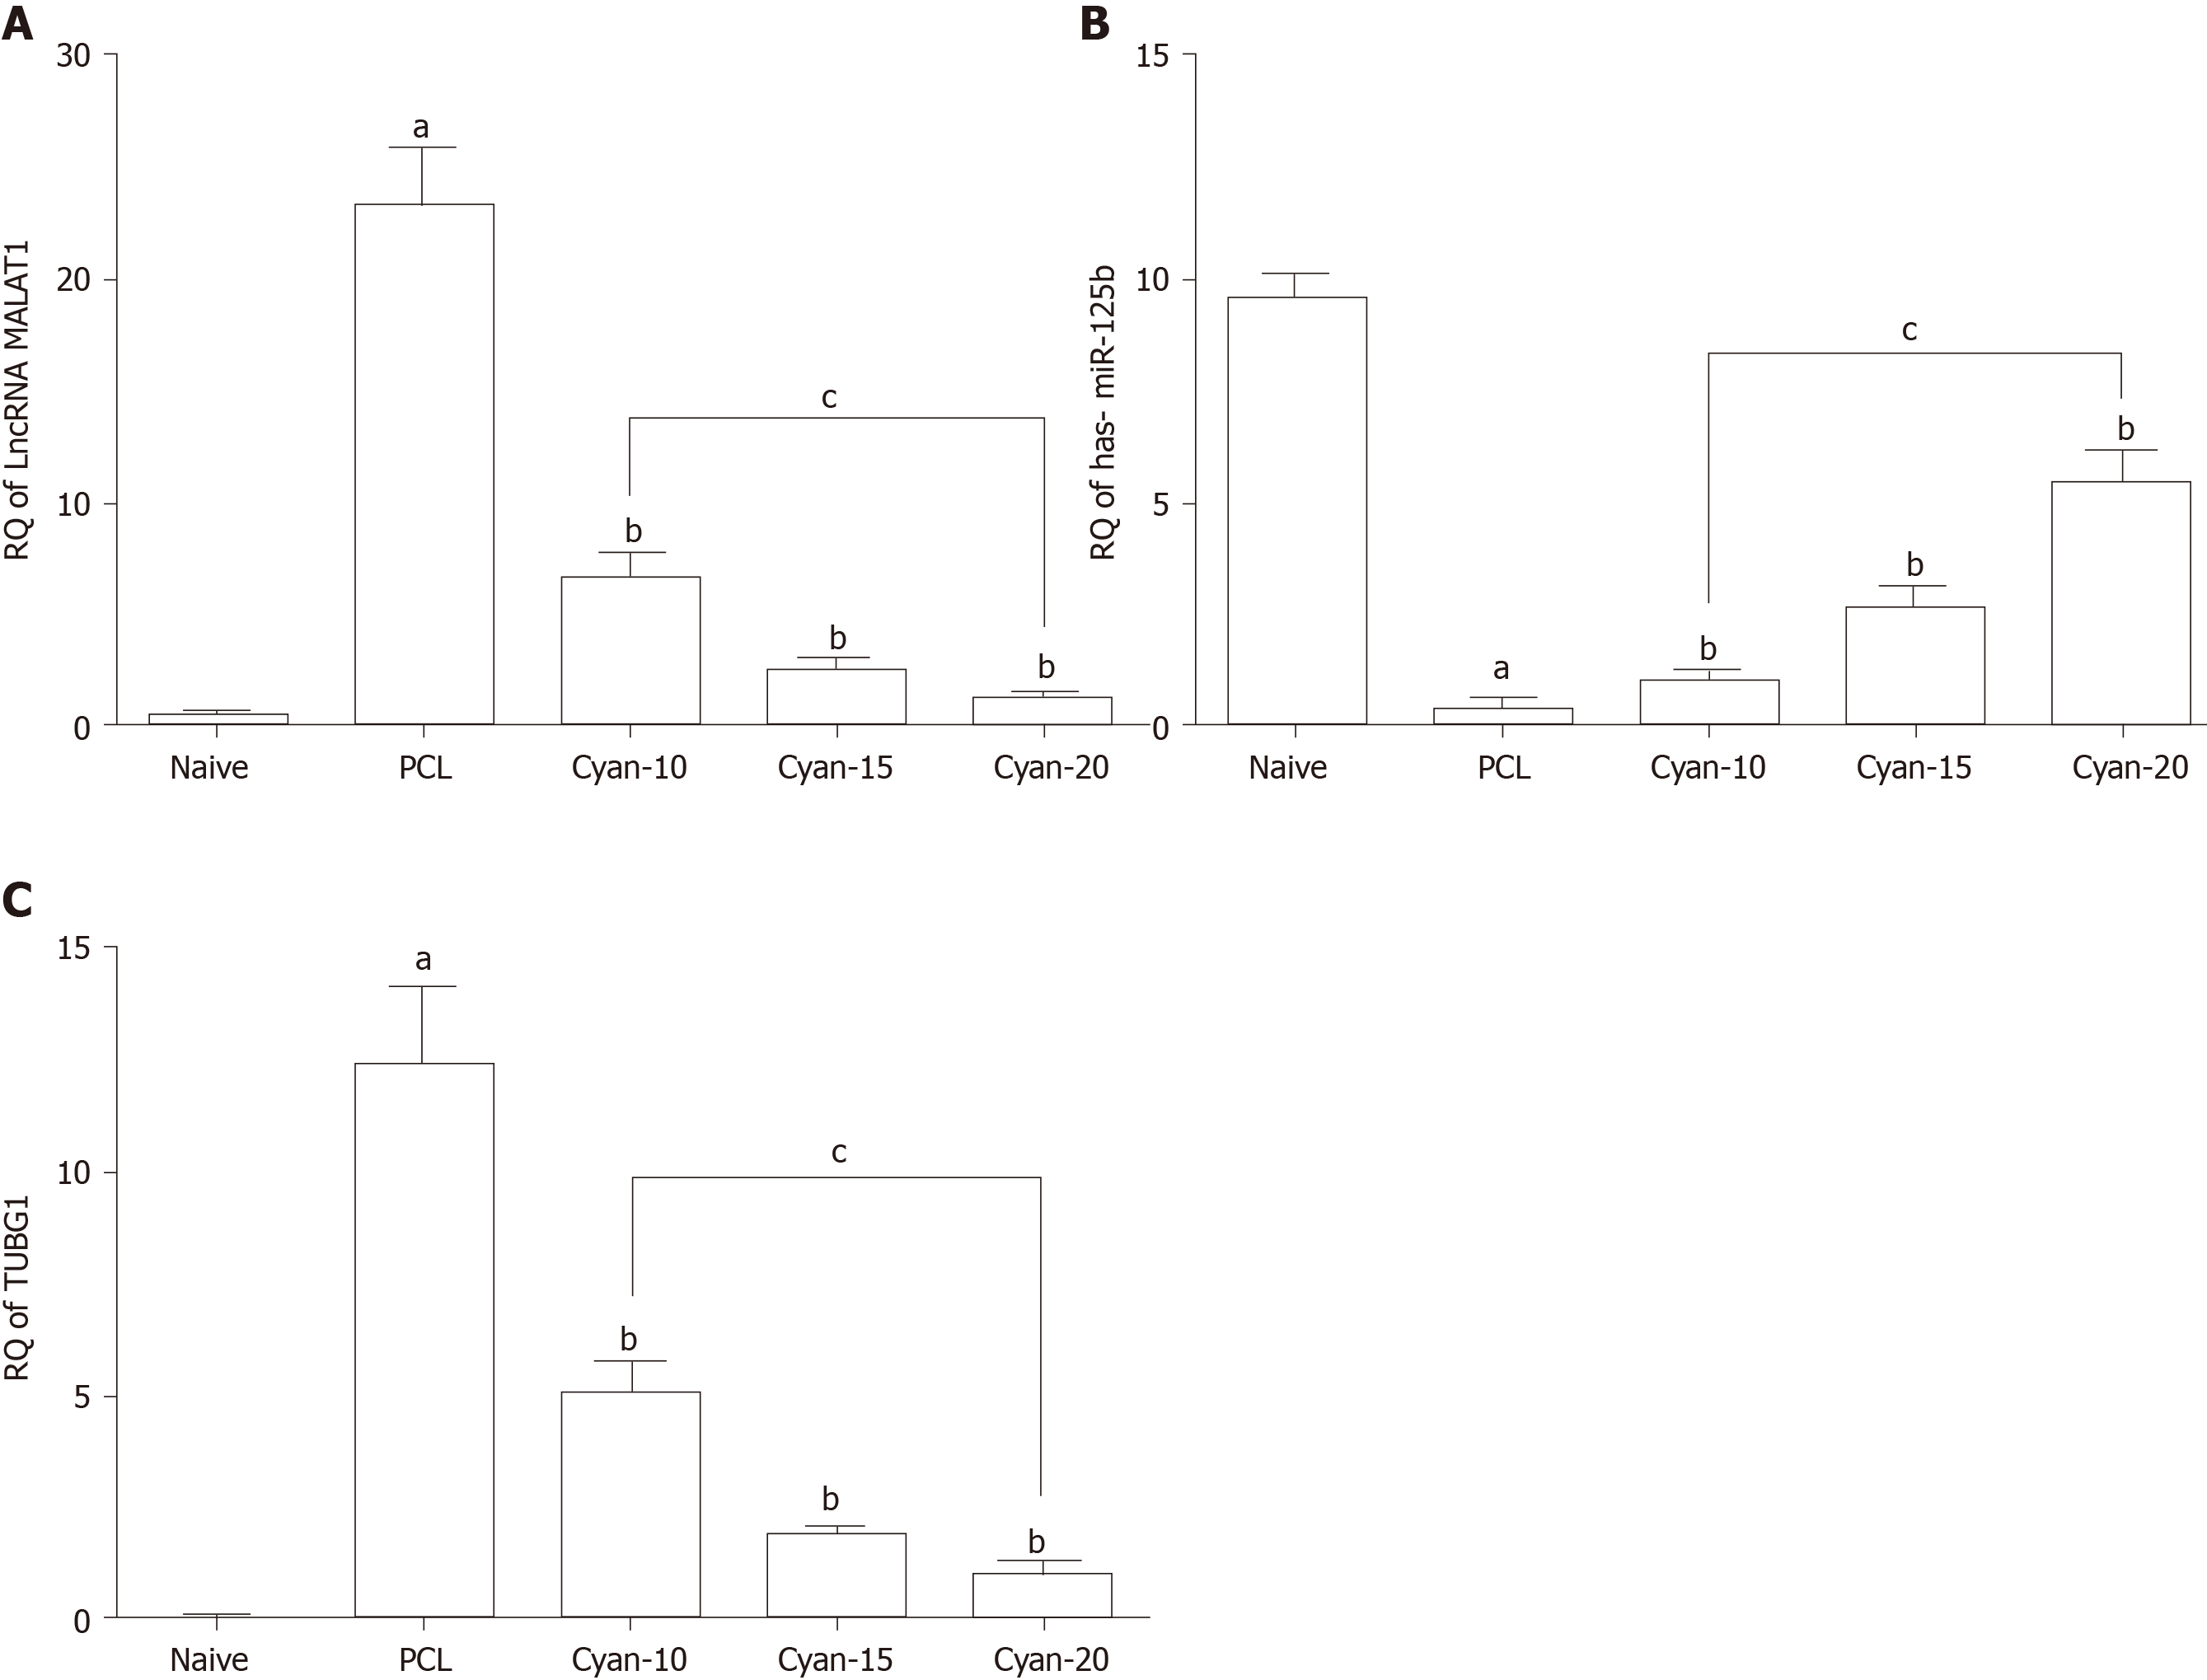
Figure 3 Effect on expression of of long non-coding RNA, MALAT1, miR-125b and tubulin 1 (G2/M transition of mitotic cell cycle) in the liver tissue.
A: RQ of long non-coding RNA MALAT1; B: RQ miR-125b; C: RQ TUBGI . Values are mean ± SEM; number of animals = 6 rats/each group. aP < 0.05 significant differences compared to naïve group; bP < 0.05 significant differences compared to precancerous lesion group; cP < 0.05 significant differences between the 2 selected groups, One-way ANOVA followed by Tukey’s test. PCL: Precancerous lesion; Cyan: Cyanidin-3-O-glucoside; TUBG: Tubulin gamma 1; lncRNA: Long non-coding RNA.
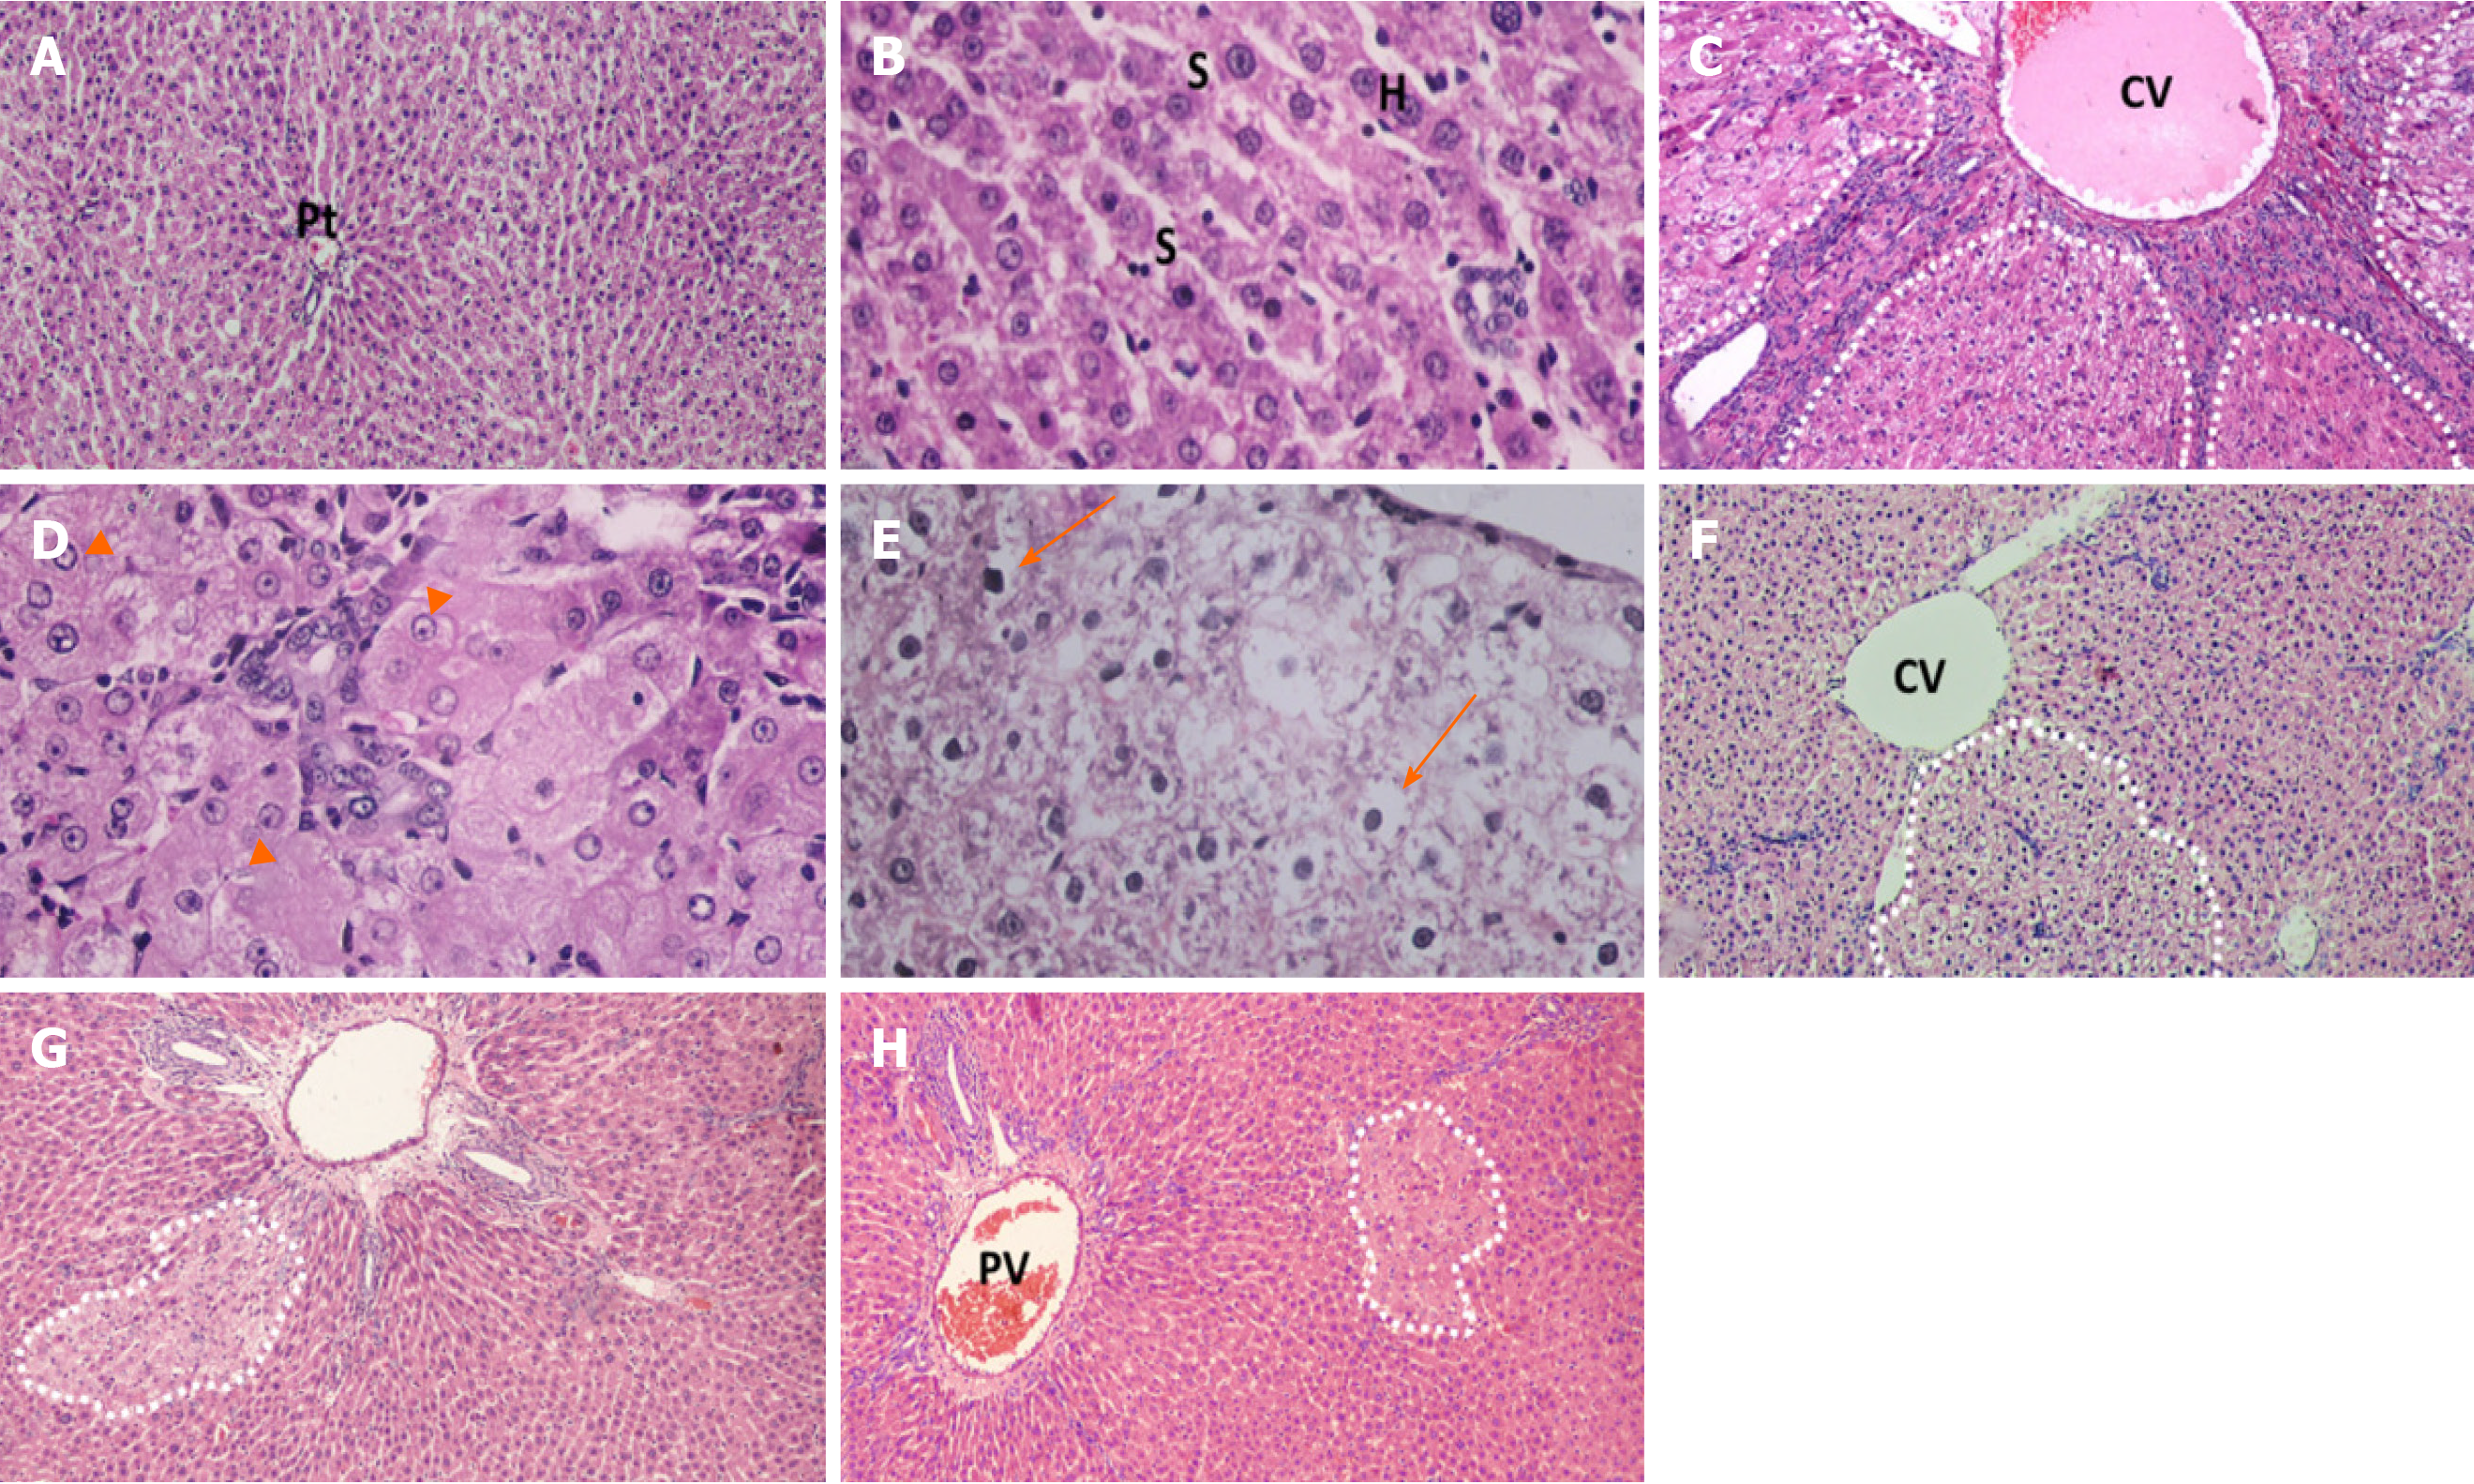
Figure 4 Photomicrographs of liver sections stained with H&E staining.
A and B: Naïve group liver sections showed normal hepatic architecture, cords of hepatocytes radiating from central vein and portal triads present in-between and polygonal hepatocytes with central rounded vesicular nuclei, and hepatic sinusoid in-between; C-E: Liver sections of rats received diethylnitrosamine/2-acetylaminofluorene (DEN/2-AAF) showed larger, discriminated dysplastic nodules (doted shapes) compressing the surrounding liver tissue with disruption of normal hepatic lobular architecture; D: Liver sections of rats received DEN/2-AAF showed eosinophilic foci of cellular alteration consisting of enlarged hepatocytes with increased acidophilic staining and vaculated nuclei (arrow head); E: Liver sections of rats received DEN/2-AAF showed foci of Clear cell formed of hepatocytes showing variable degrees of cytoplasmic vacuolations and ballooning with pyknotic nuclei (arrow); F-H: Liver sections of rats treated with different doses of cyanidin (10, 15, 20 mg/kg) respectively, showing small and less discriminated dysplastic nodules (doted shapes). (Magnification: A, C, F, G, H × 1000; B, D, E × 400). CV: Central vein; PV: Portal vein; Pt: Portal triads; S: Sinusoid; H: Hepatocytes.
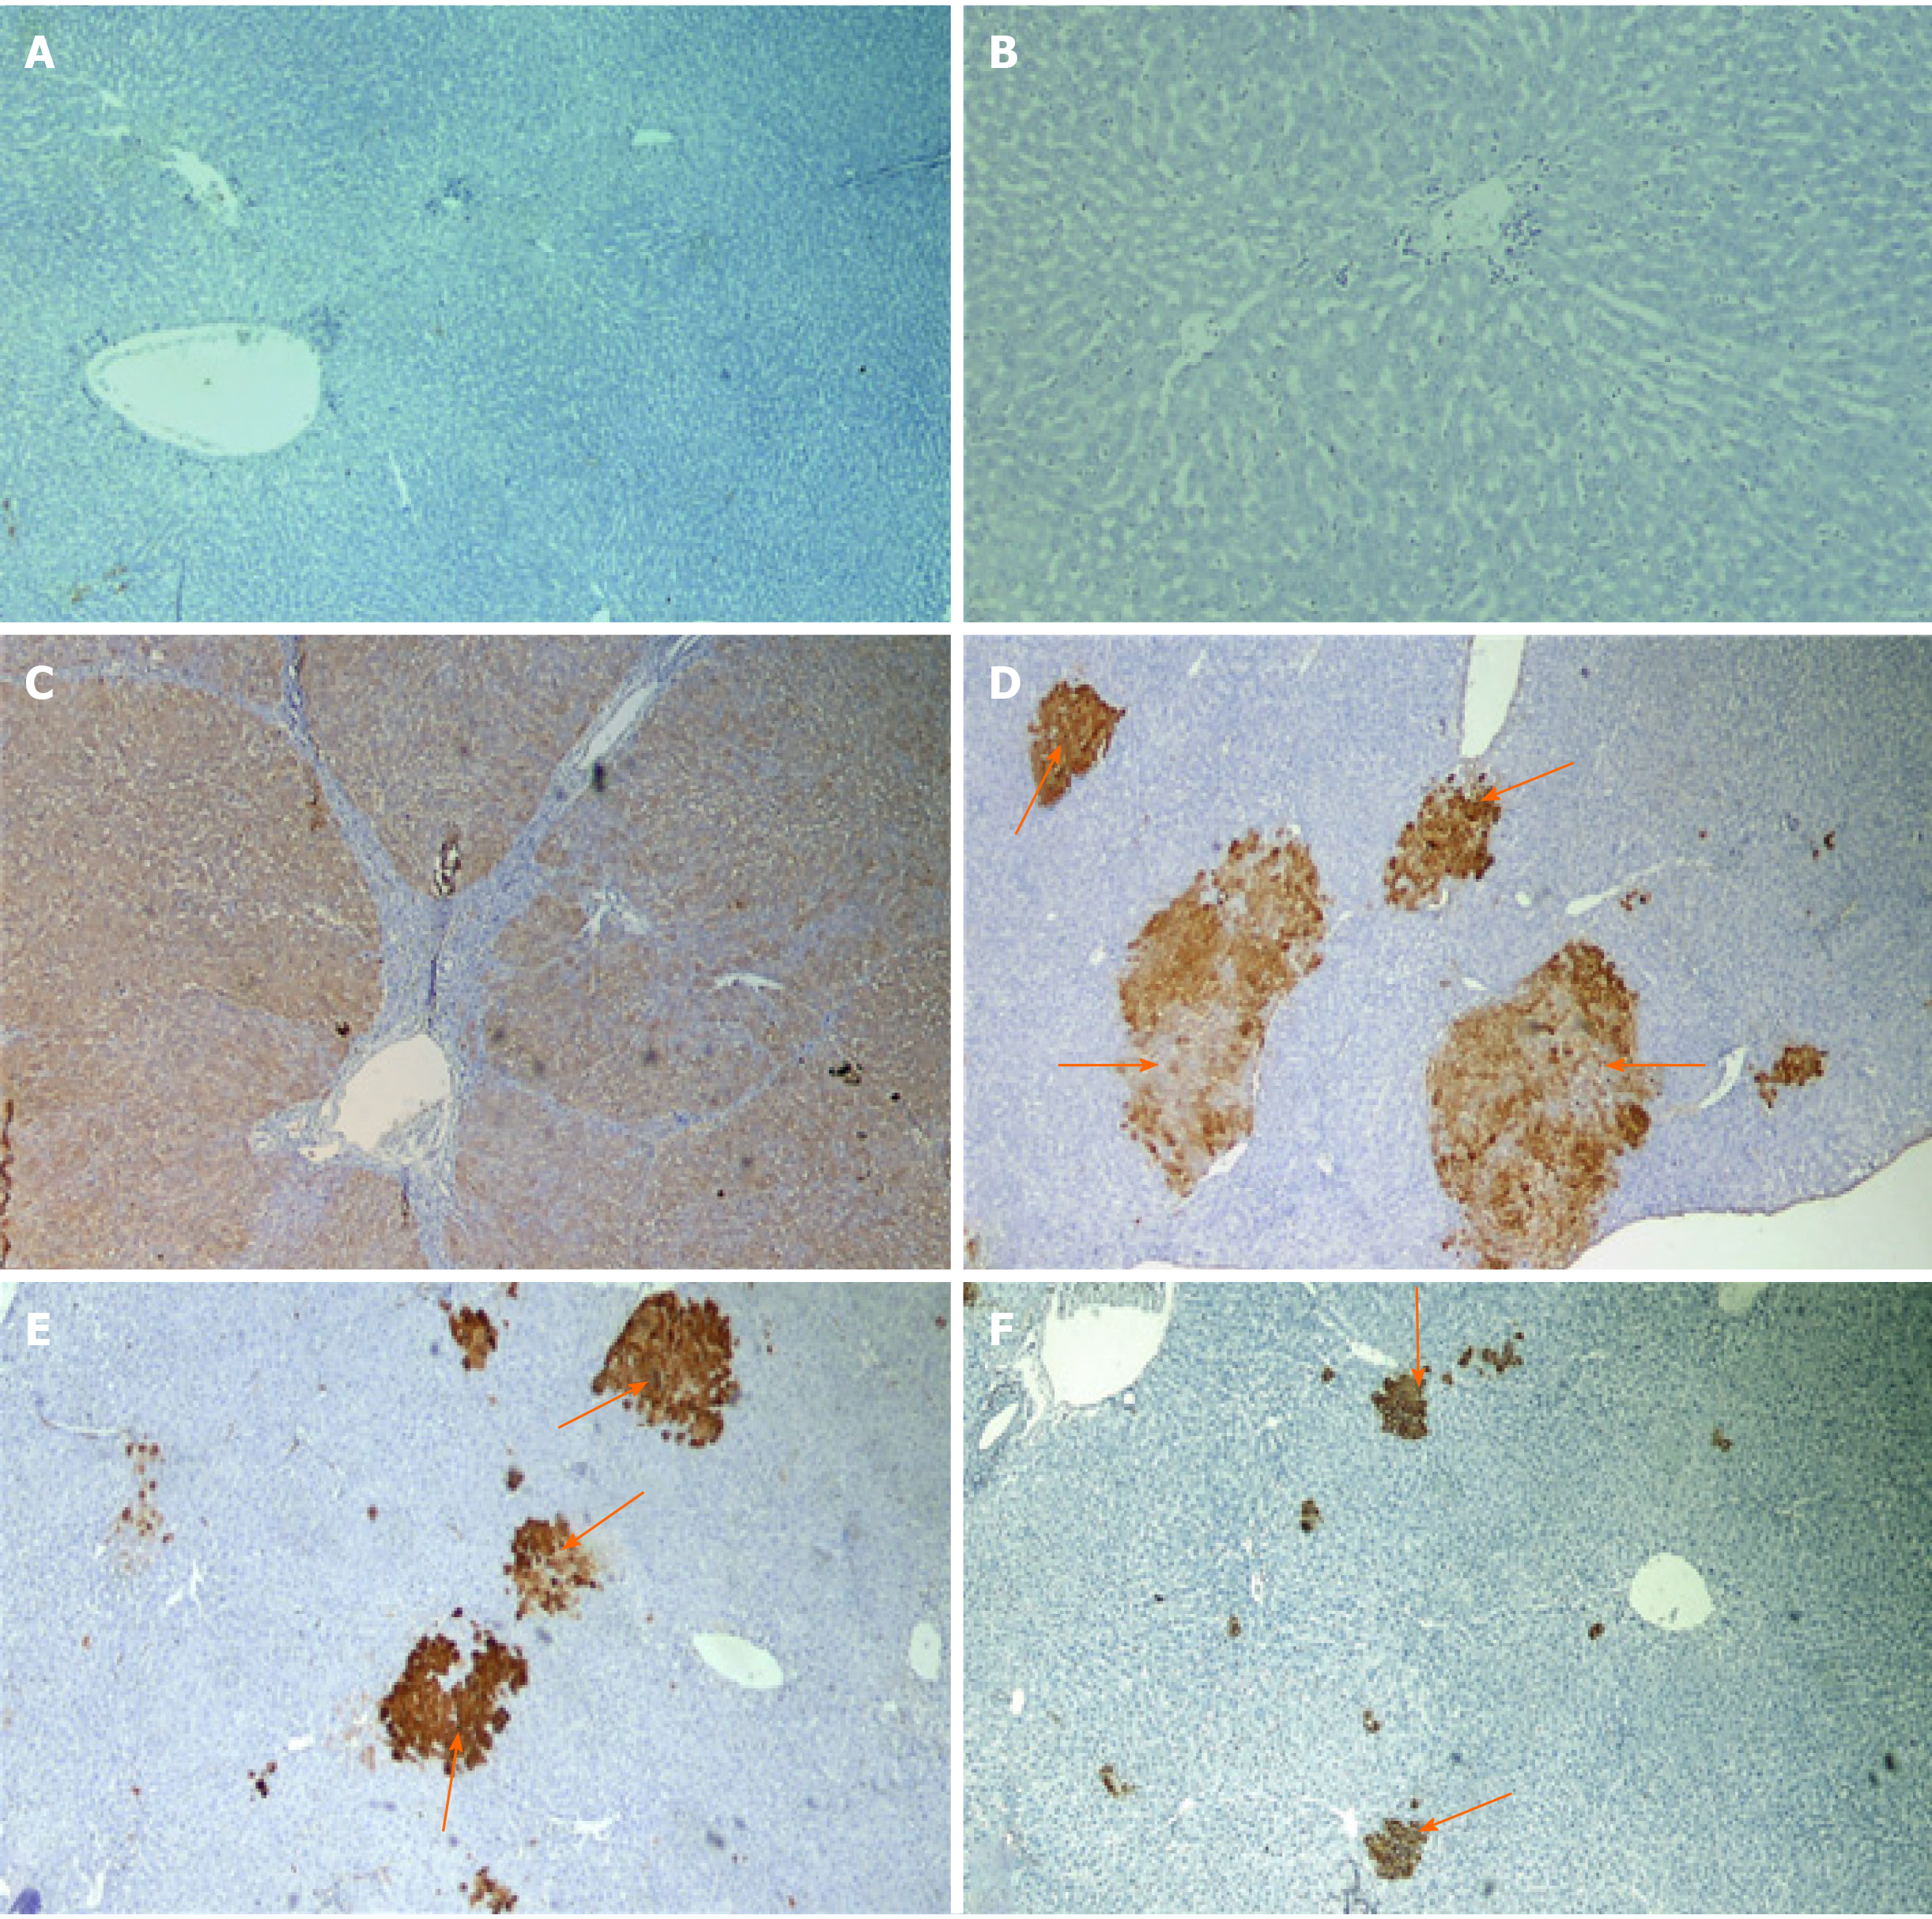
Figure 5 Photomicrographs of liver sections of rats immunohistochemical stained with glutathione S-transferase placental antibody.
A and B: Naive group; C: Precancerous lesion group showing multiple glutathione S-transferase placental (GSTP)-positive large hepatic nodules (brown stained nodules) occupying most of section; D-F: Liver sections of rats treated with different doses of cyanidin (10, 15, 20 mg/kg) showing GSTP positive small hepatic foci (brown stained cells = arrow) of different size scattered in-between negatively stained hepatic parenchyma. (Magnification: × 40)
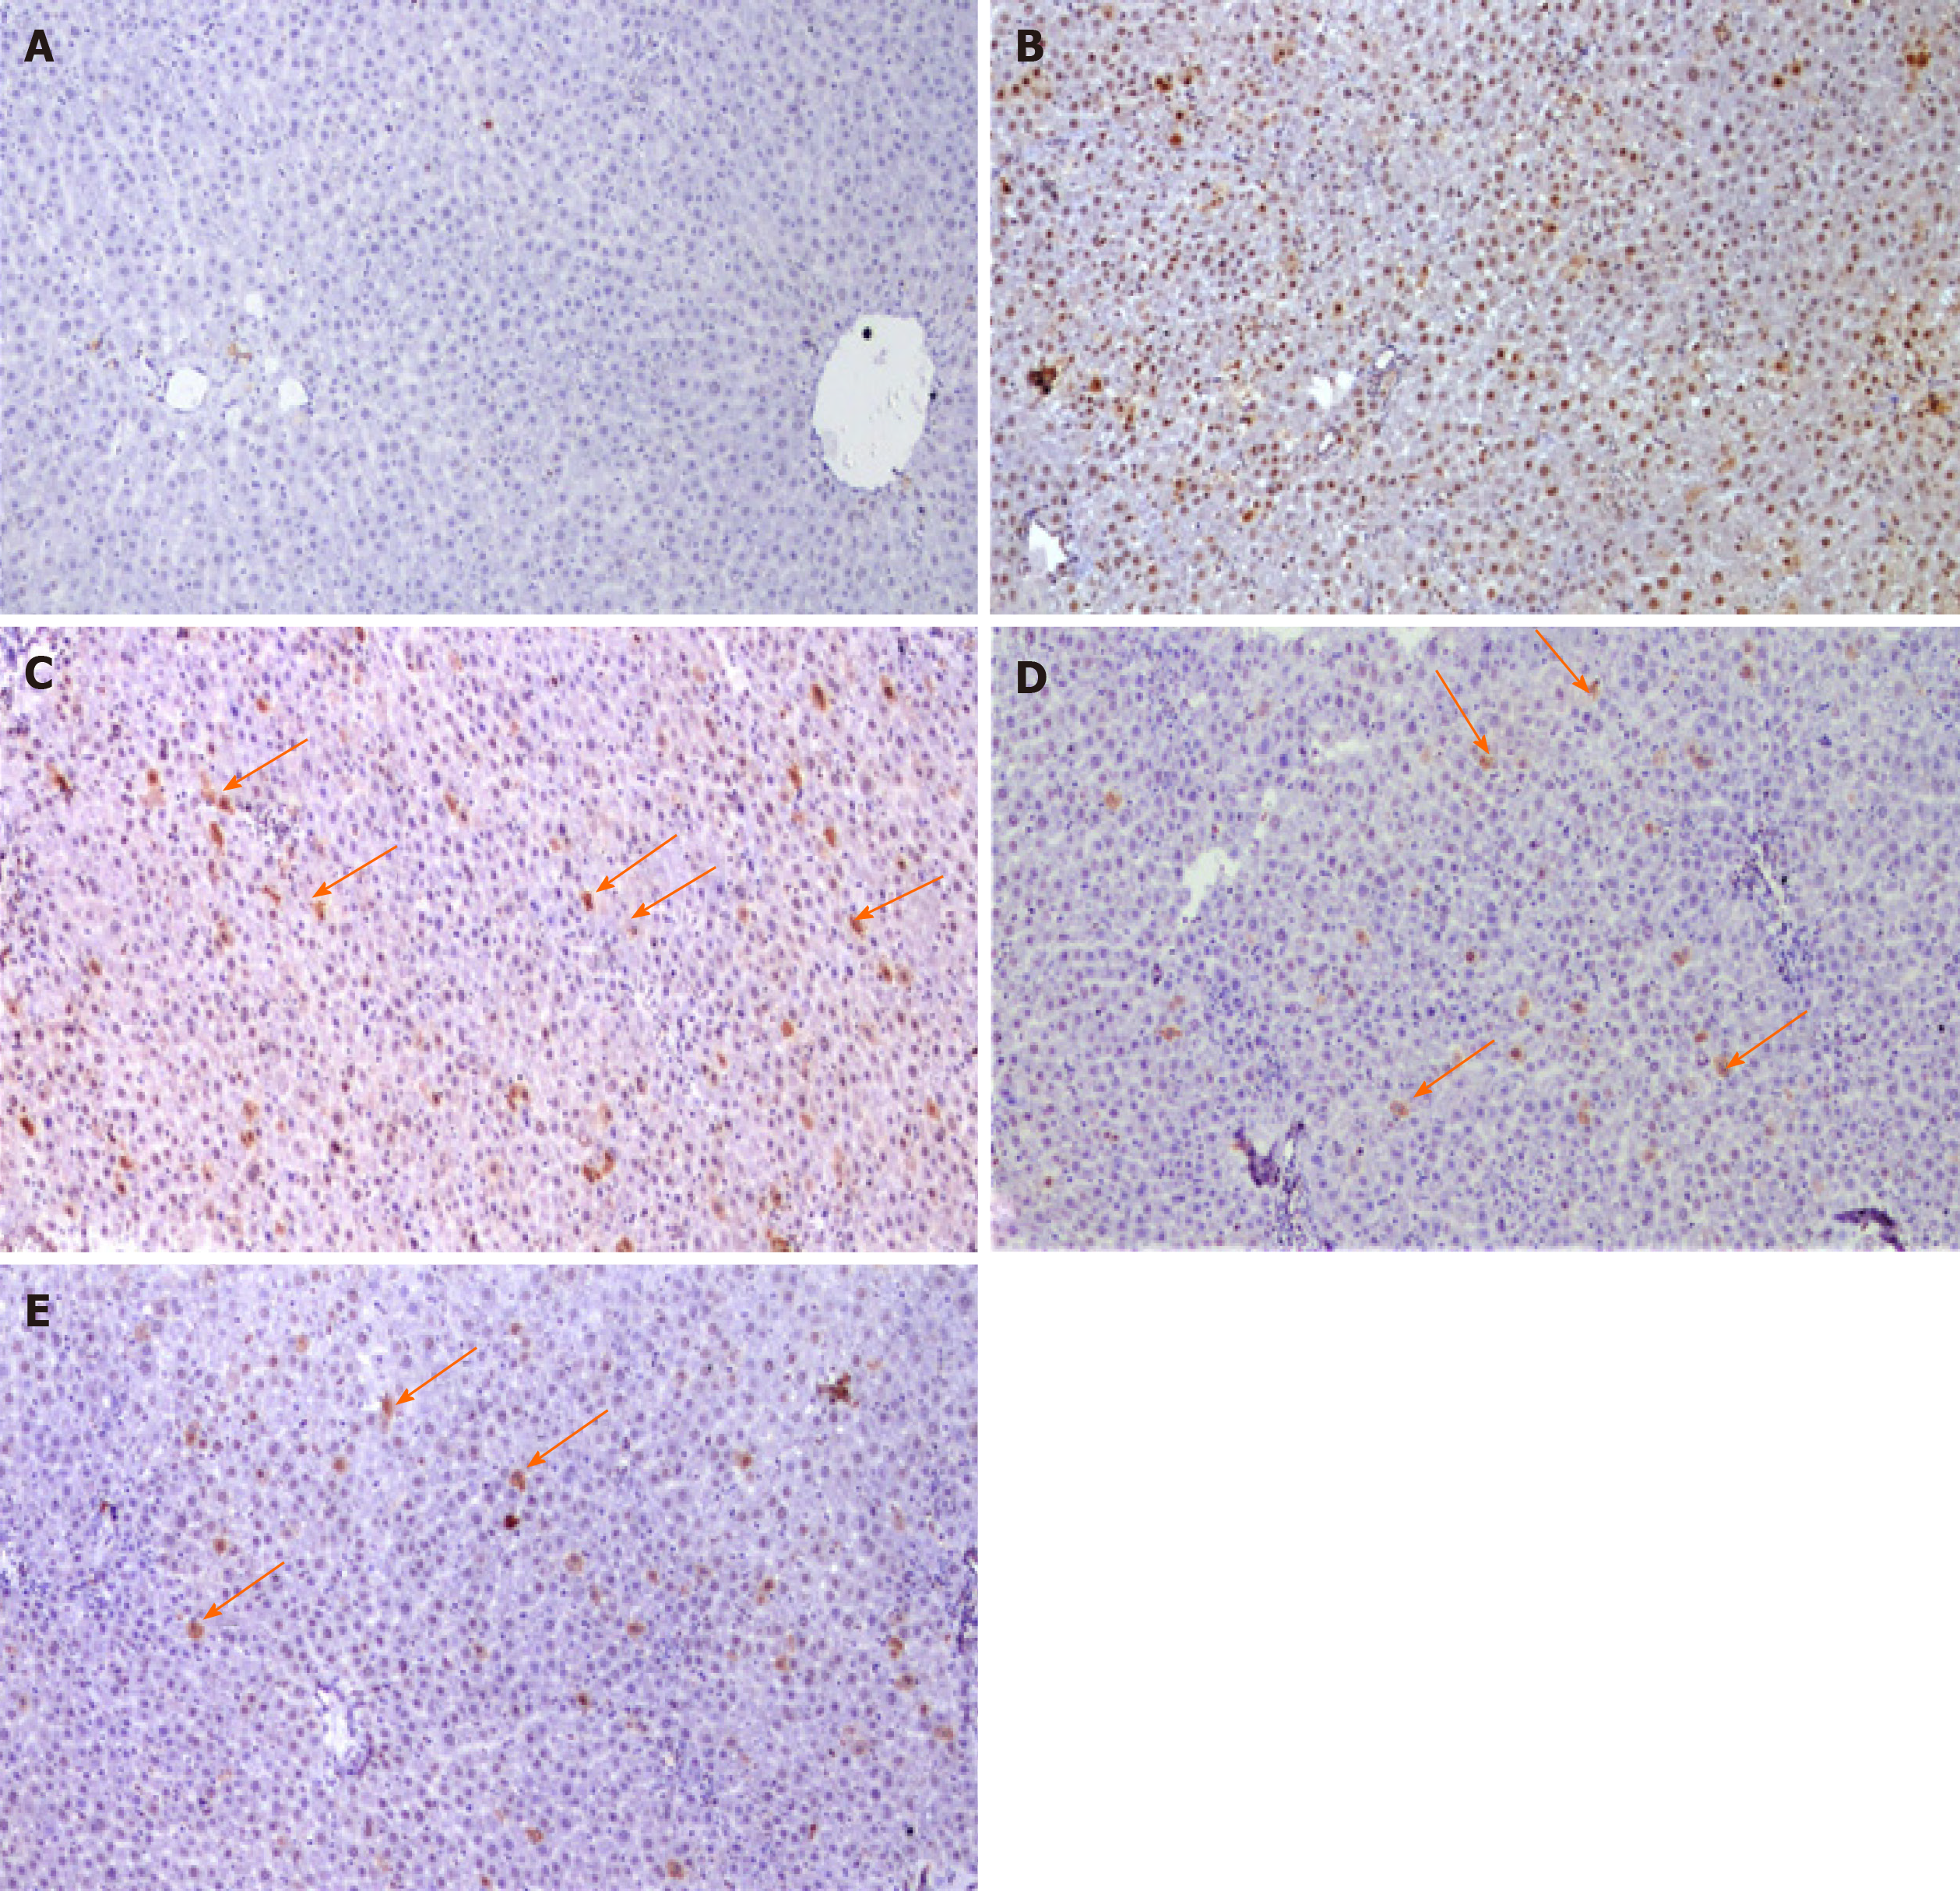
Figure 6 Photomicrographs of liver sections Immunohistochemical stained with proliferating cell nuclear antigen.
A: Negative reaction of control group; B: Diethylnitrosamine + 100 mg 2-acetylaminofluorene group showing positive stained nuclei scattered all over the field; C-E: Liver sections of rats treated with different doses of cyamidine (10, 15, 20 mg/kg) respectively, show few positive hepatocytes sporadically distributed over the field (arrow). (Magnification × 100).
Figure 7 Concept map of study design.
GSTP: Glutathione S-transferase placental; PCNA: Proliferating cell nuclear antigen; TUBG: Tubulin; lncRNA: Long non-coding RNA.
- Citation: Matboli M, Hasanin AH, Hussein R, El-Nakeep S, Habib EK, Ellackany R, Saleh LA. Cyanidin 3-glucoside modulated cell cycle progression in liver precancerous lesion, in vivo study. World J Gastroenterol 2021; 27(14): 1435-1450
- URL: https://www.wjgnet.com/1007-9327/full/v27/i14/1435.htm
- DOI: https://dx.doi.org/10.3748/wjg.v27.i14.1435


