Copyright
©The Author(s) 2020.
World J Gastroenterol. Feb 28, 2020; 26(8): 839-849
Published online Feb 28, 2020. doi: 10.3748/wjg.v26.i8.839
Published online Feb 28, 2020. doi: 10.3748/wjg.v26.i8.839
Figure 1 Trends of poor survival were observed for patients with increasing preoperative weight loss and decreasing body mass index.
A, B: Risk of reduced survival (blue line) increases with decreasing BMI (A) and increasing PWL (B). Median OS (golden line) decreases with decreasing BMI (A) and increasing PWL (B). PWL: Preoperative weight loss; BMI: Body mass index.
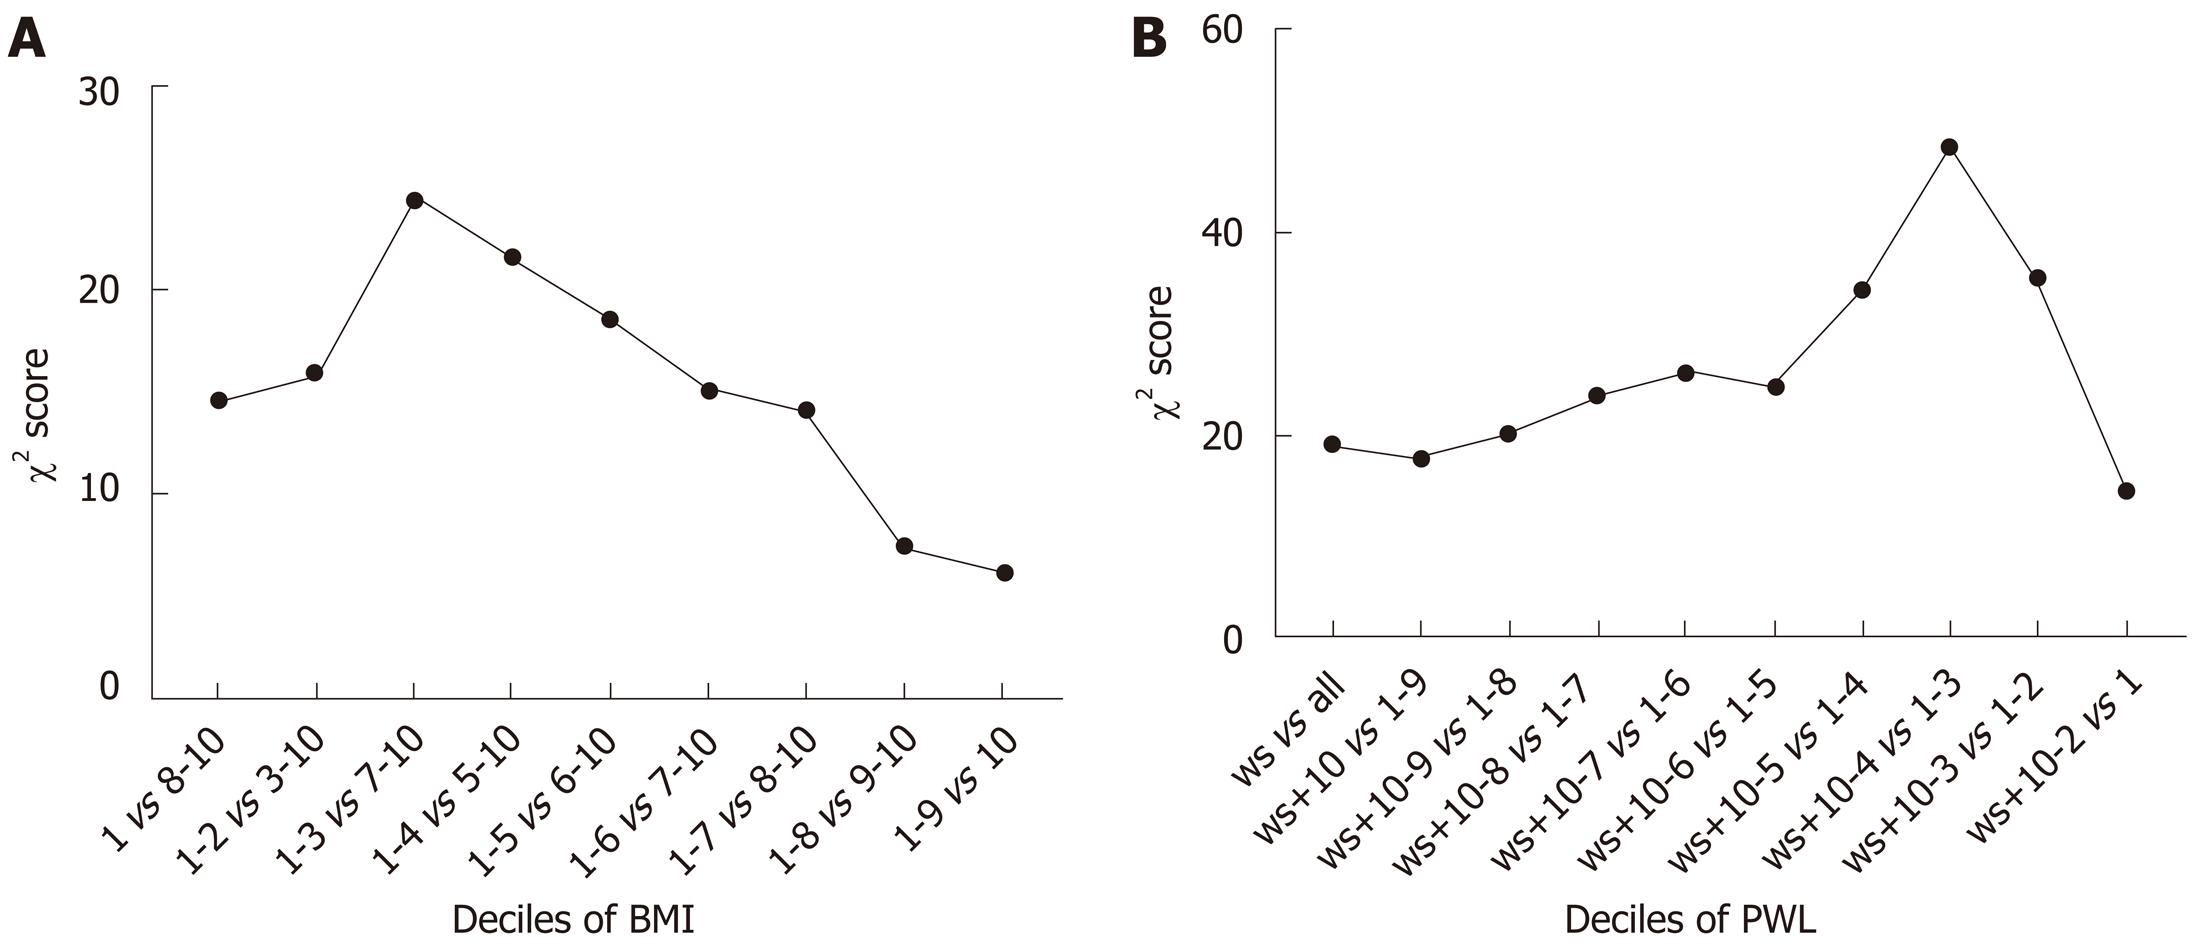
Figure 2 The threshold of BMI with 20.
0 kg/m2 had the maximum χ2 score, and was therefore the best cut-off point (A). The threshold of PWL with 8.8% had the maximum χ2 score, and was therefore the best cut-off point (B). ws: weight stable; PWL: Preoperative weight loss; BMI: Body mass index.
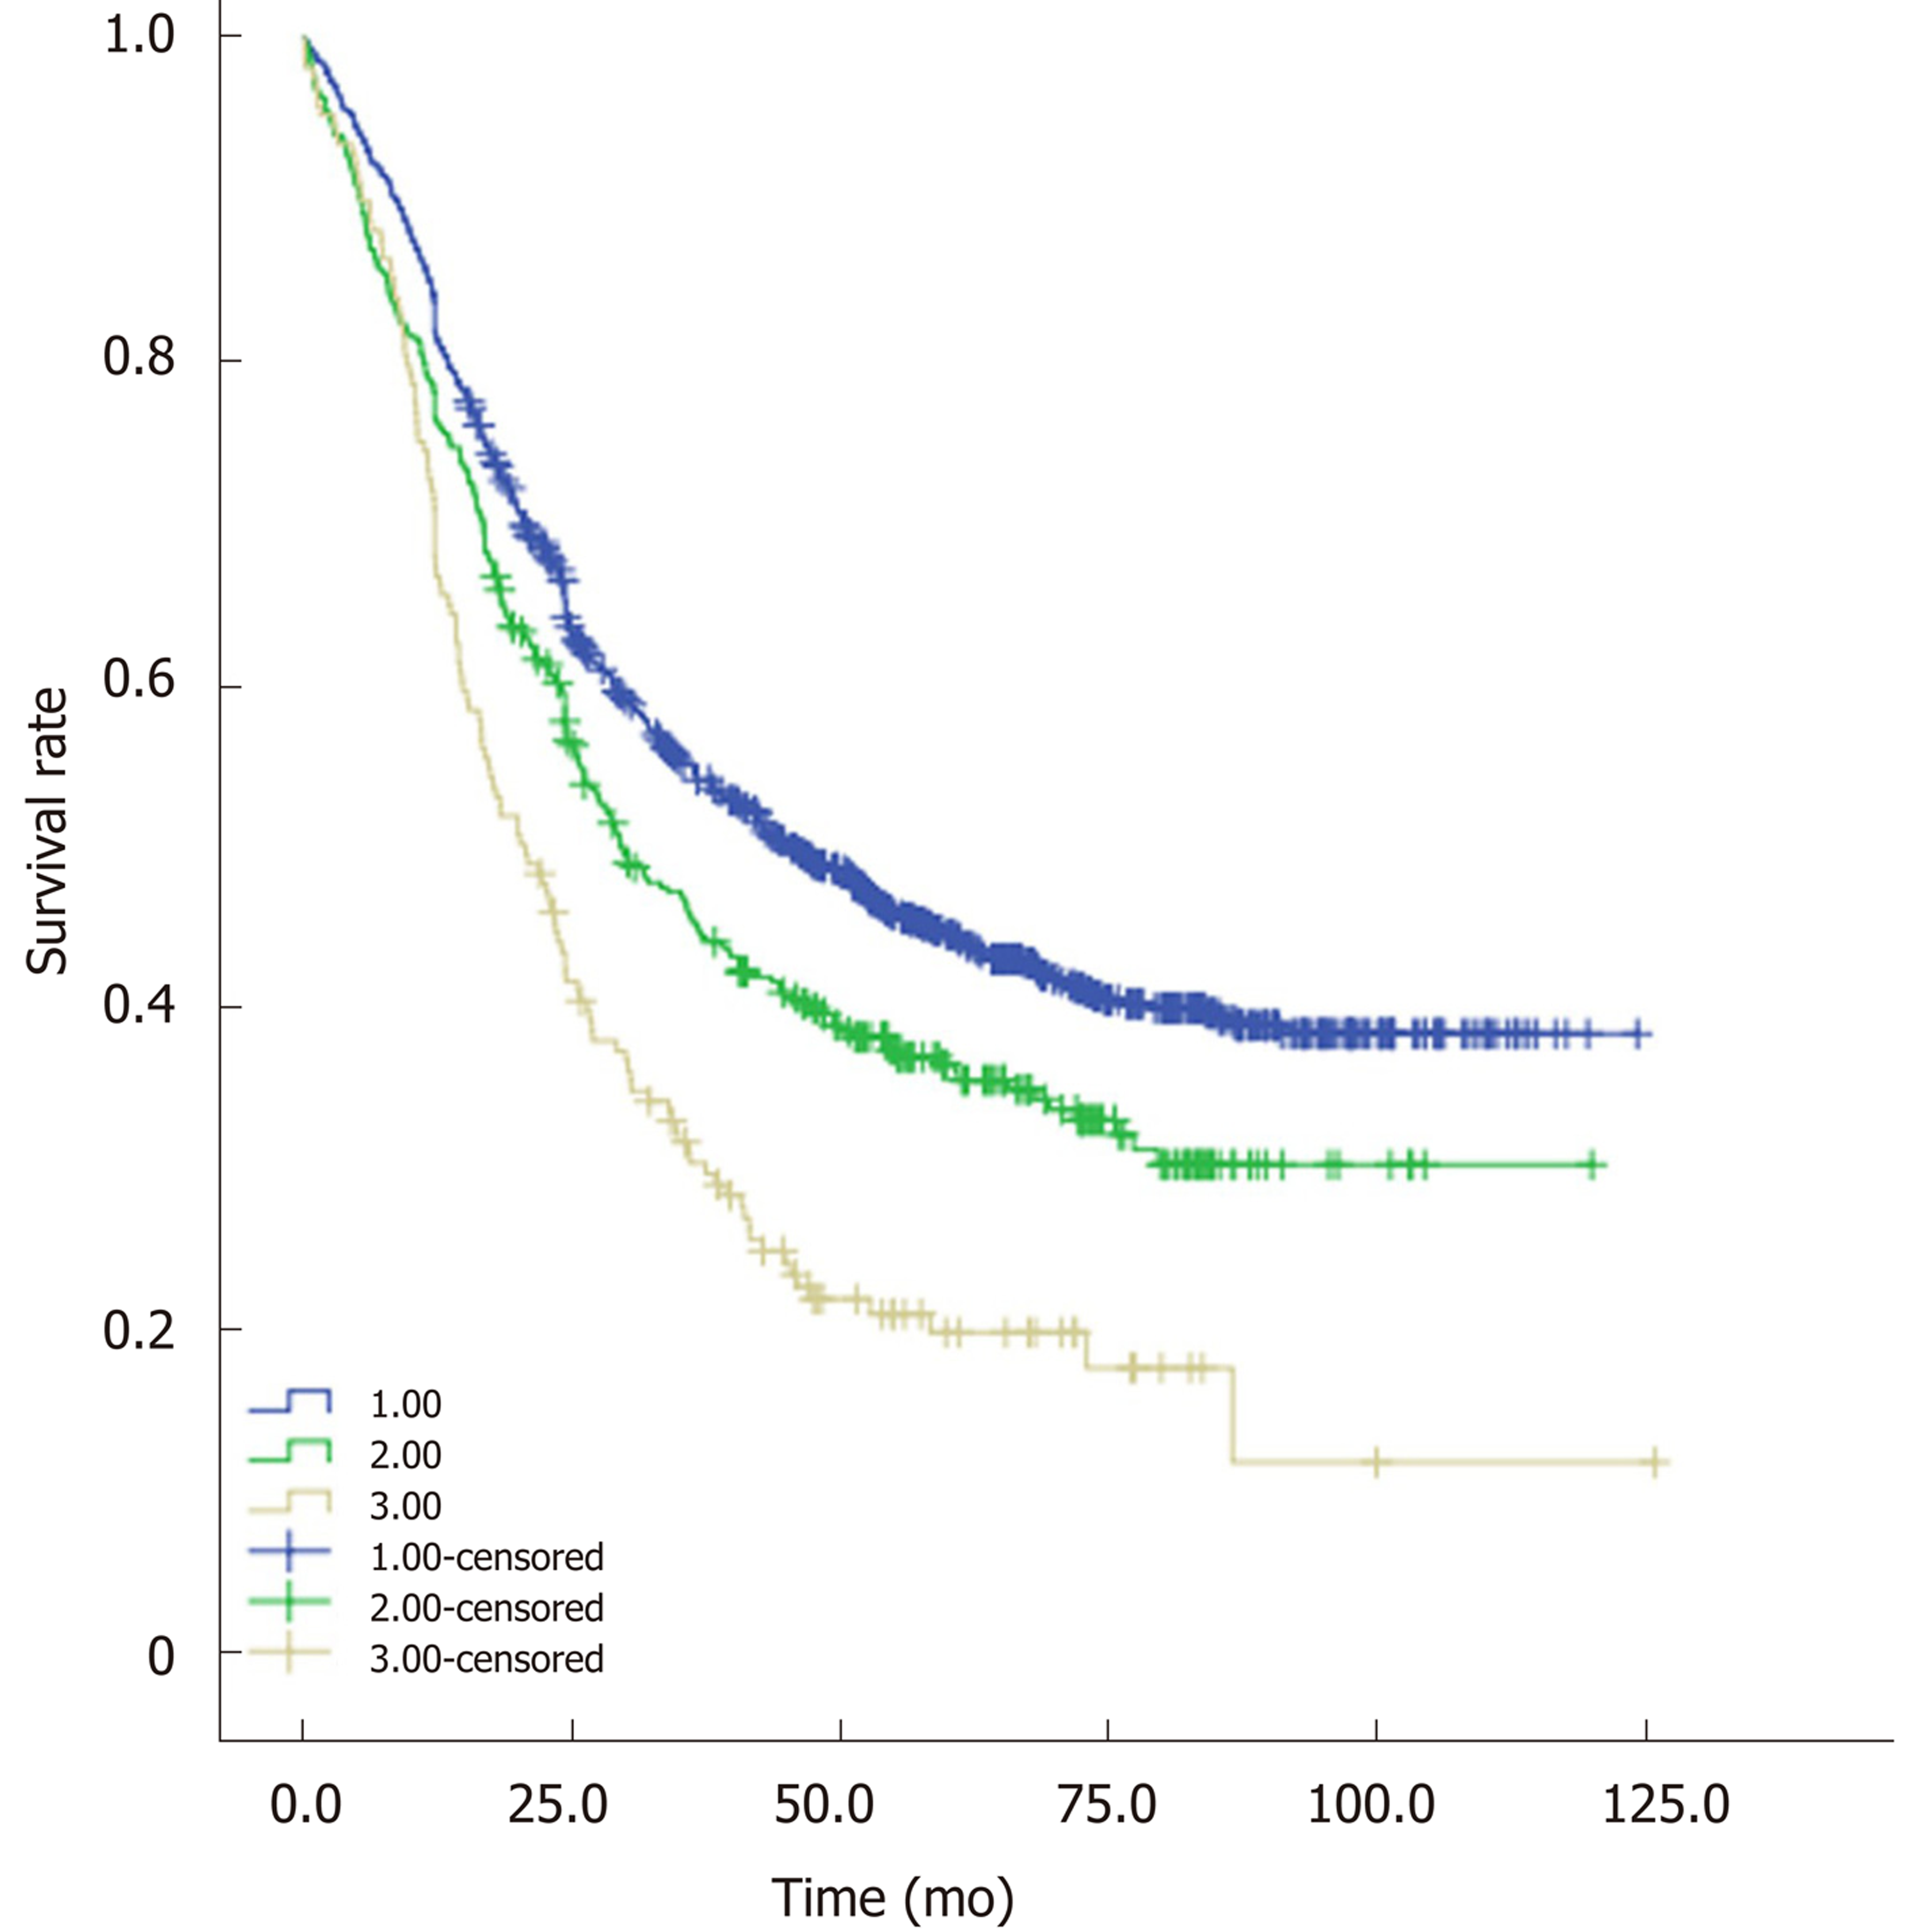
Figure 3 Patients in the three groups were associated with significantly different overall survival (blue line: Group 1; green line: Group 2; golden line: Group 3).
- Citation: Zhang HL, Yang YS, Duan JN, Shang QX, He SL, Gu YM, Hu WP, Wang WP, Hu Y, Wang Y, Yuan Y, Chen LQ. Prognostic value of preoperative weight loss-adjusted body mass index on survival after esophagectomy for esophageal squamous cell carcinoma. World J Gastroenterol 2020; 26(8): 839-849
- URL: https://www.wjgnet.com/1007-9327/full/v26/i8/839.htm
- DOI: https://dx.doi.org/10.3748/wjg.v26.i8.839


