Copyright
©The Author(s) 2020.
World J Gastroenterol. Feb 14, 2020; 26(6): 598-613
Published online Feb 14, 2020. doi: 10.3748/wjg.v26.i6.598
Published online Feb 14, 2020. doi: 10.3748/wjg.v26.i6.598
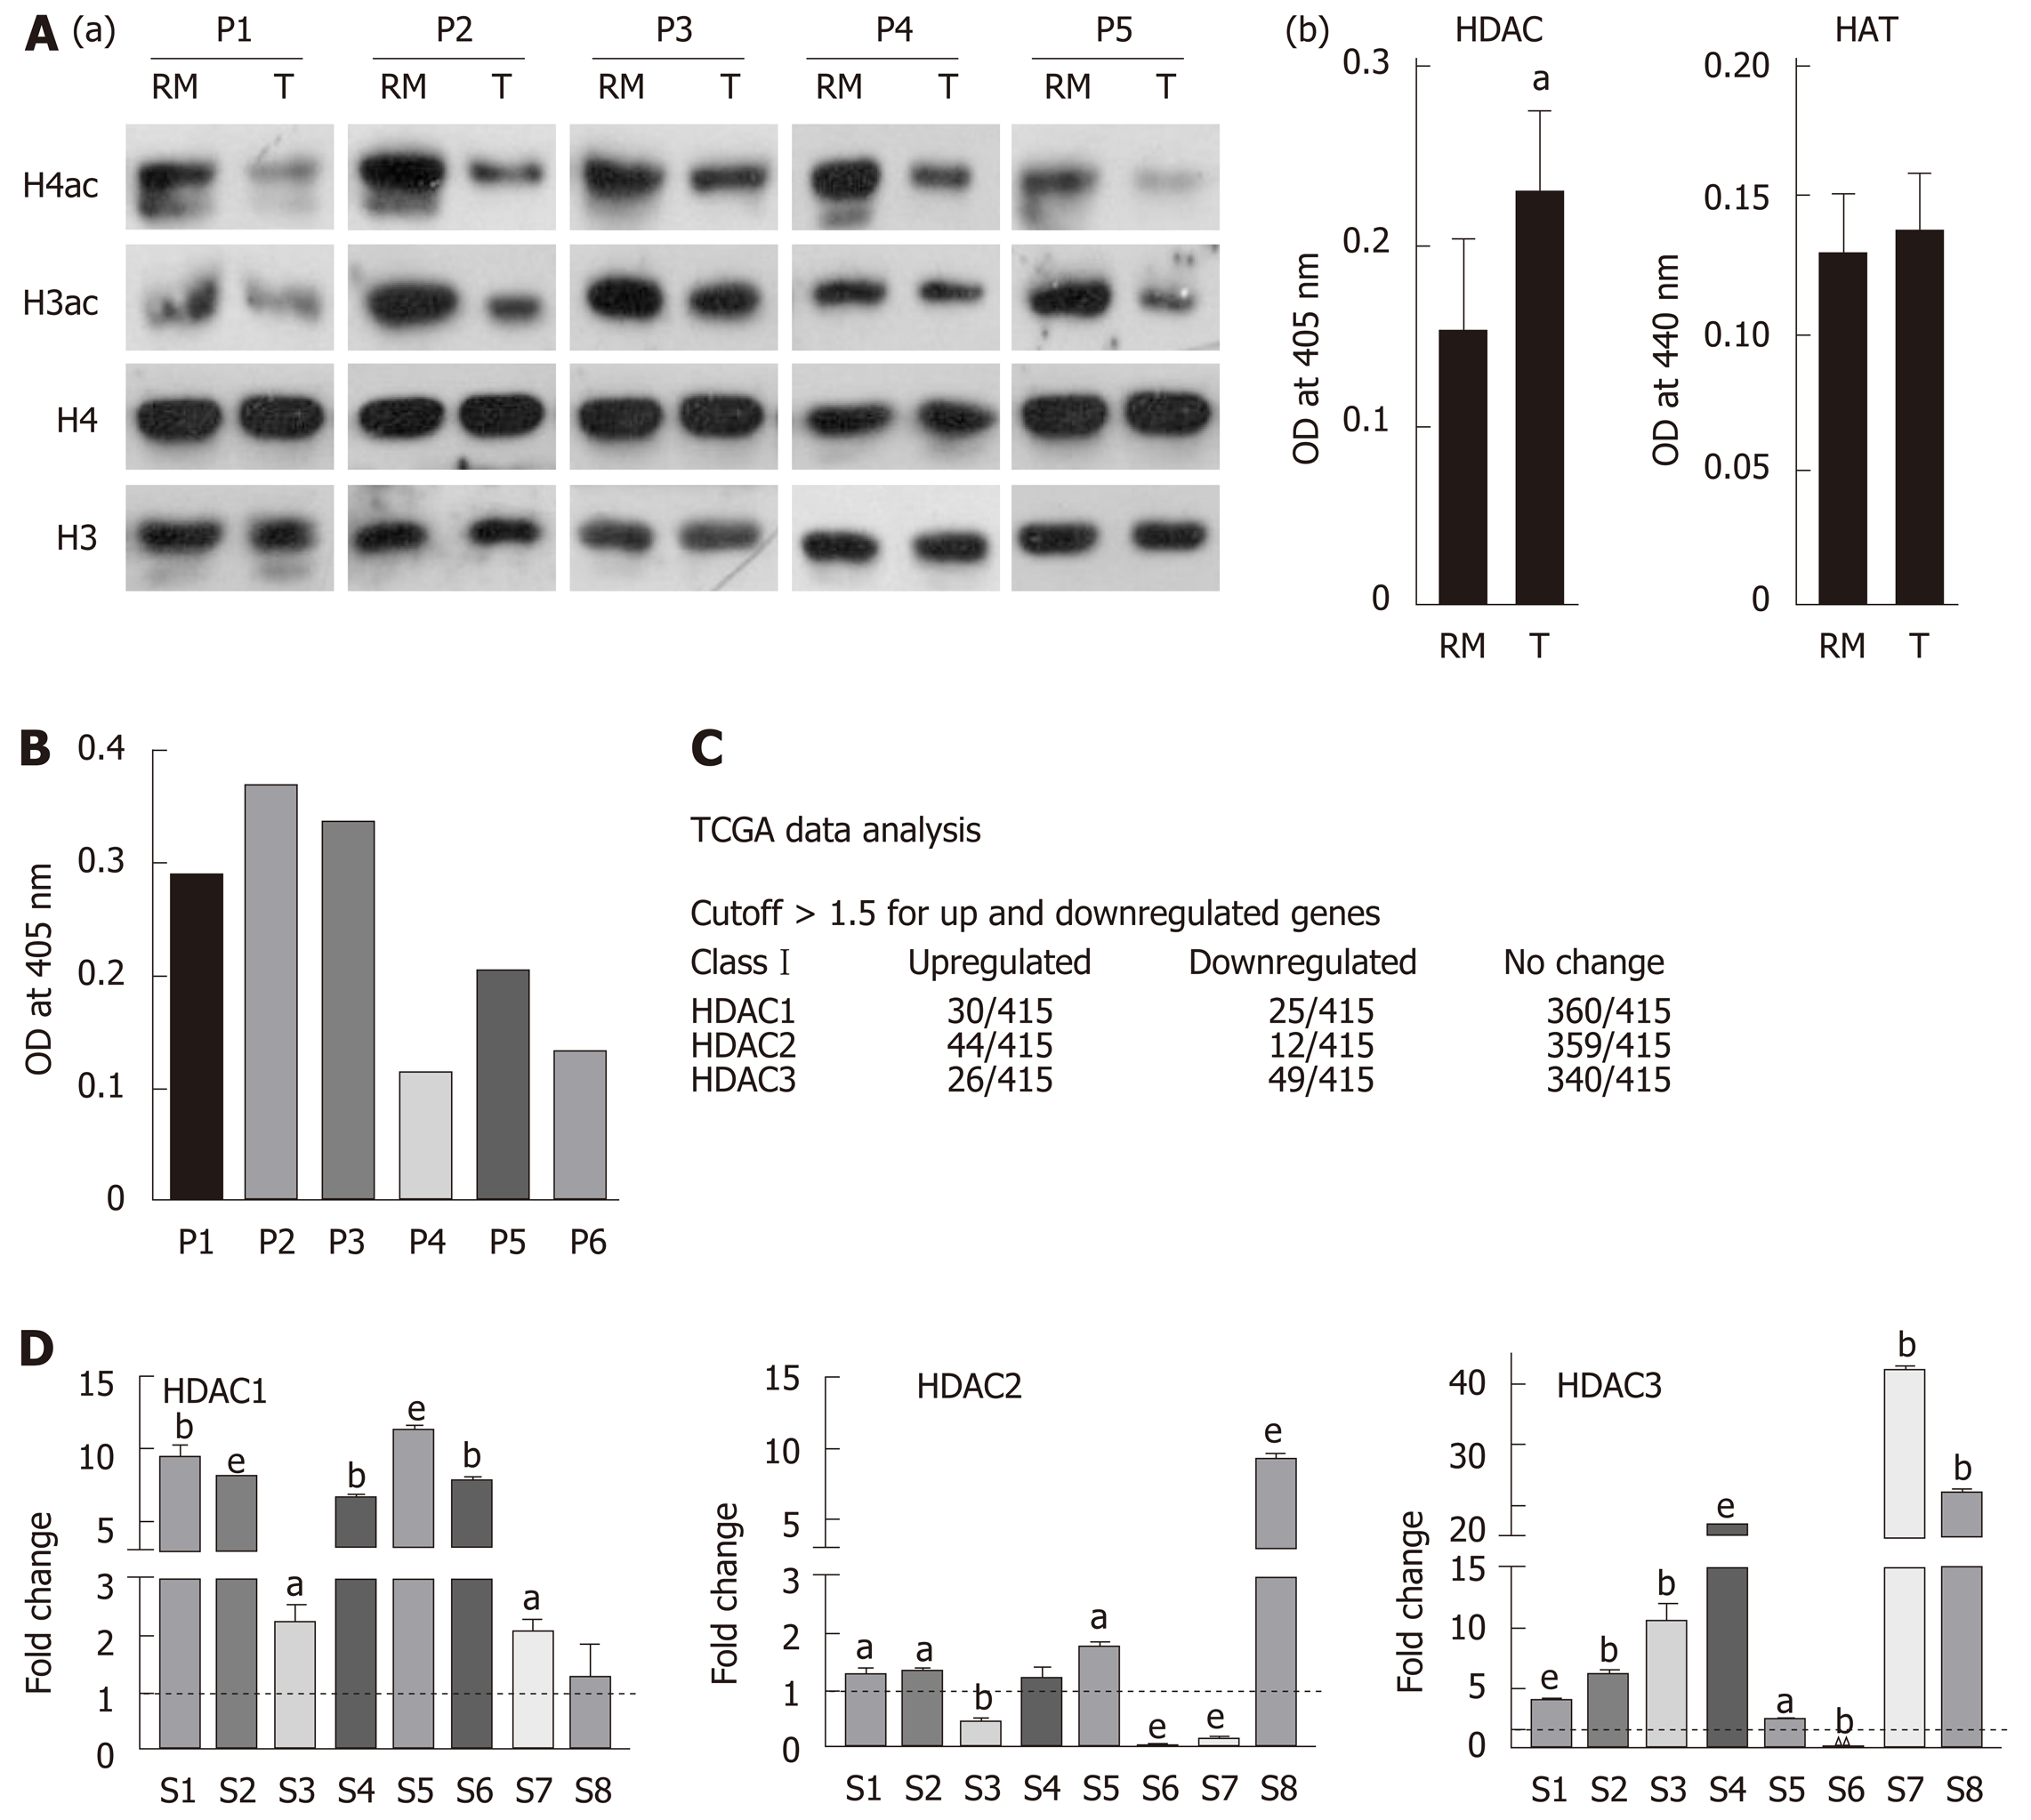
Figure 1 Hypo-acetylation in gastric cancer patient samples is associated with low histone deacetylase activity and transcripts.
A: (a) Immunoblot analysis for the comparison of pan-acetyl levels of histone H3 and H4 between paired (n = 5) negative resection margins (RMs) and tumor (T) tissues, and (b) Nucleo-cytosolic fractions were used to compare histone deacetylase (HDAC) and histone acetyltransferase (HAT) levels in paired negative resection margins and tumor tissues using calorimetric assays; B: Differential HDAC activity amongst patients was studied calorimetrically; C: Analysis of The Cancer Genome Atlas data for class 1 HDAC transcript levels in gastric adenocarcinoma patients; D: Expression of Class I HDAC viz HDAC1, HDAC2 and HDAC3 in gastric cancer tumors compared to normal tissue (aP < 0.05; bP < 0.009; eP < 0.0009). GC: Gastric cancer; HDAC: Histone deacetylase; HAT: Histone acetyltransferase; HDAC1: Histone deacetylase 1; HDAC2: Histone deacetylase 2; HDAC3: Histone deacetylase 3; RM: Resection margin; T: Tumor tissues.
Figure 2 Pre-treatment regime with histone deacetylase inhibitor maximally enhances binding of chemotherapeutic drugs to chromatin.
A: (a) Immunoblot analysis for the comparison of site-specific histone acetylation levels between gastric cancer (GC) cell lines, transformed AGS and untransformed HFE145; (b) Nucleo-cytosolic fractions were used to compare HDAC levels in GC cell lines using calorimetric assays; and (c) Real time PCR data of Class I to Class IV HDAC levels in the AGS cell line compared to HFE145 (aP < 0.05; bP < 0.009, cP < 0.0009, dP < 0.0001); B: Schematic representation of three different combination regimes: (a) concurrent [histone deacetylase inhibitor (HDACi) + Drug], (b) pre- (HDACi Drug) and (c) post- (Drug HDACi); C: AGS cells were treated with chemotherapeutic drugs and HDACi at their inhibitory concentration (IC)50 concentration for 24 h in three different combinations as mentioned above. Experiment was performed in triplicate, absorbance was taken, normalized with blank, and mean absorbance was incorporated into a bar graph. HDACi: Histone deacetylase inhibitor; HDAC: Histone deacetylase; Drug: Chemotherapy drugs; VPA: Valproic acid; SAHA: Suberoylanilide hydroxamic acid; TSA: Trichostatin A; IC: Inhibitory concentration.
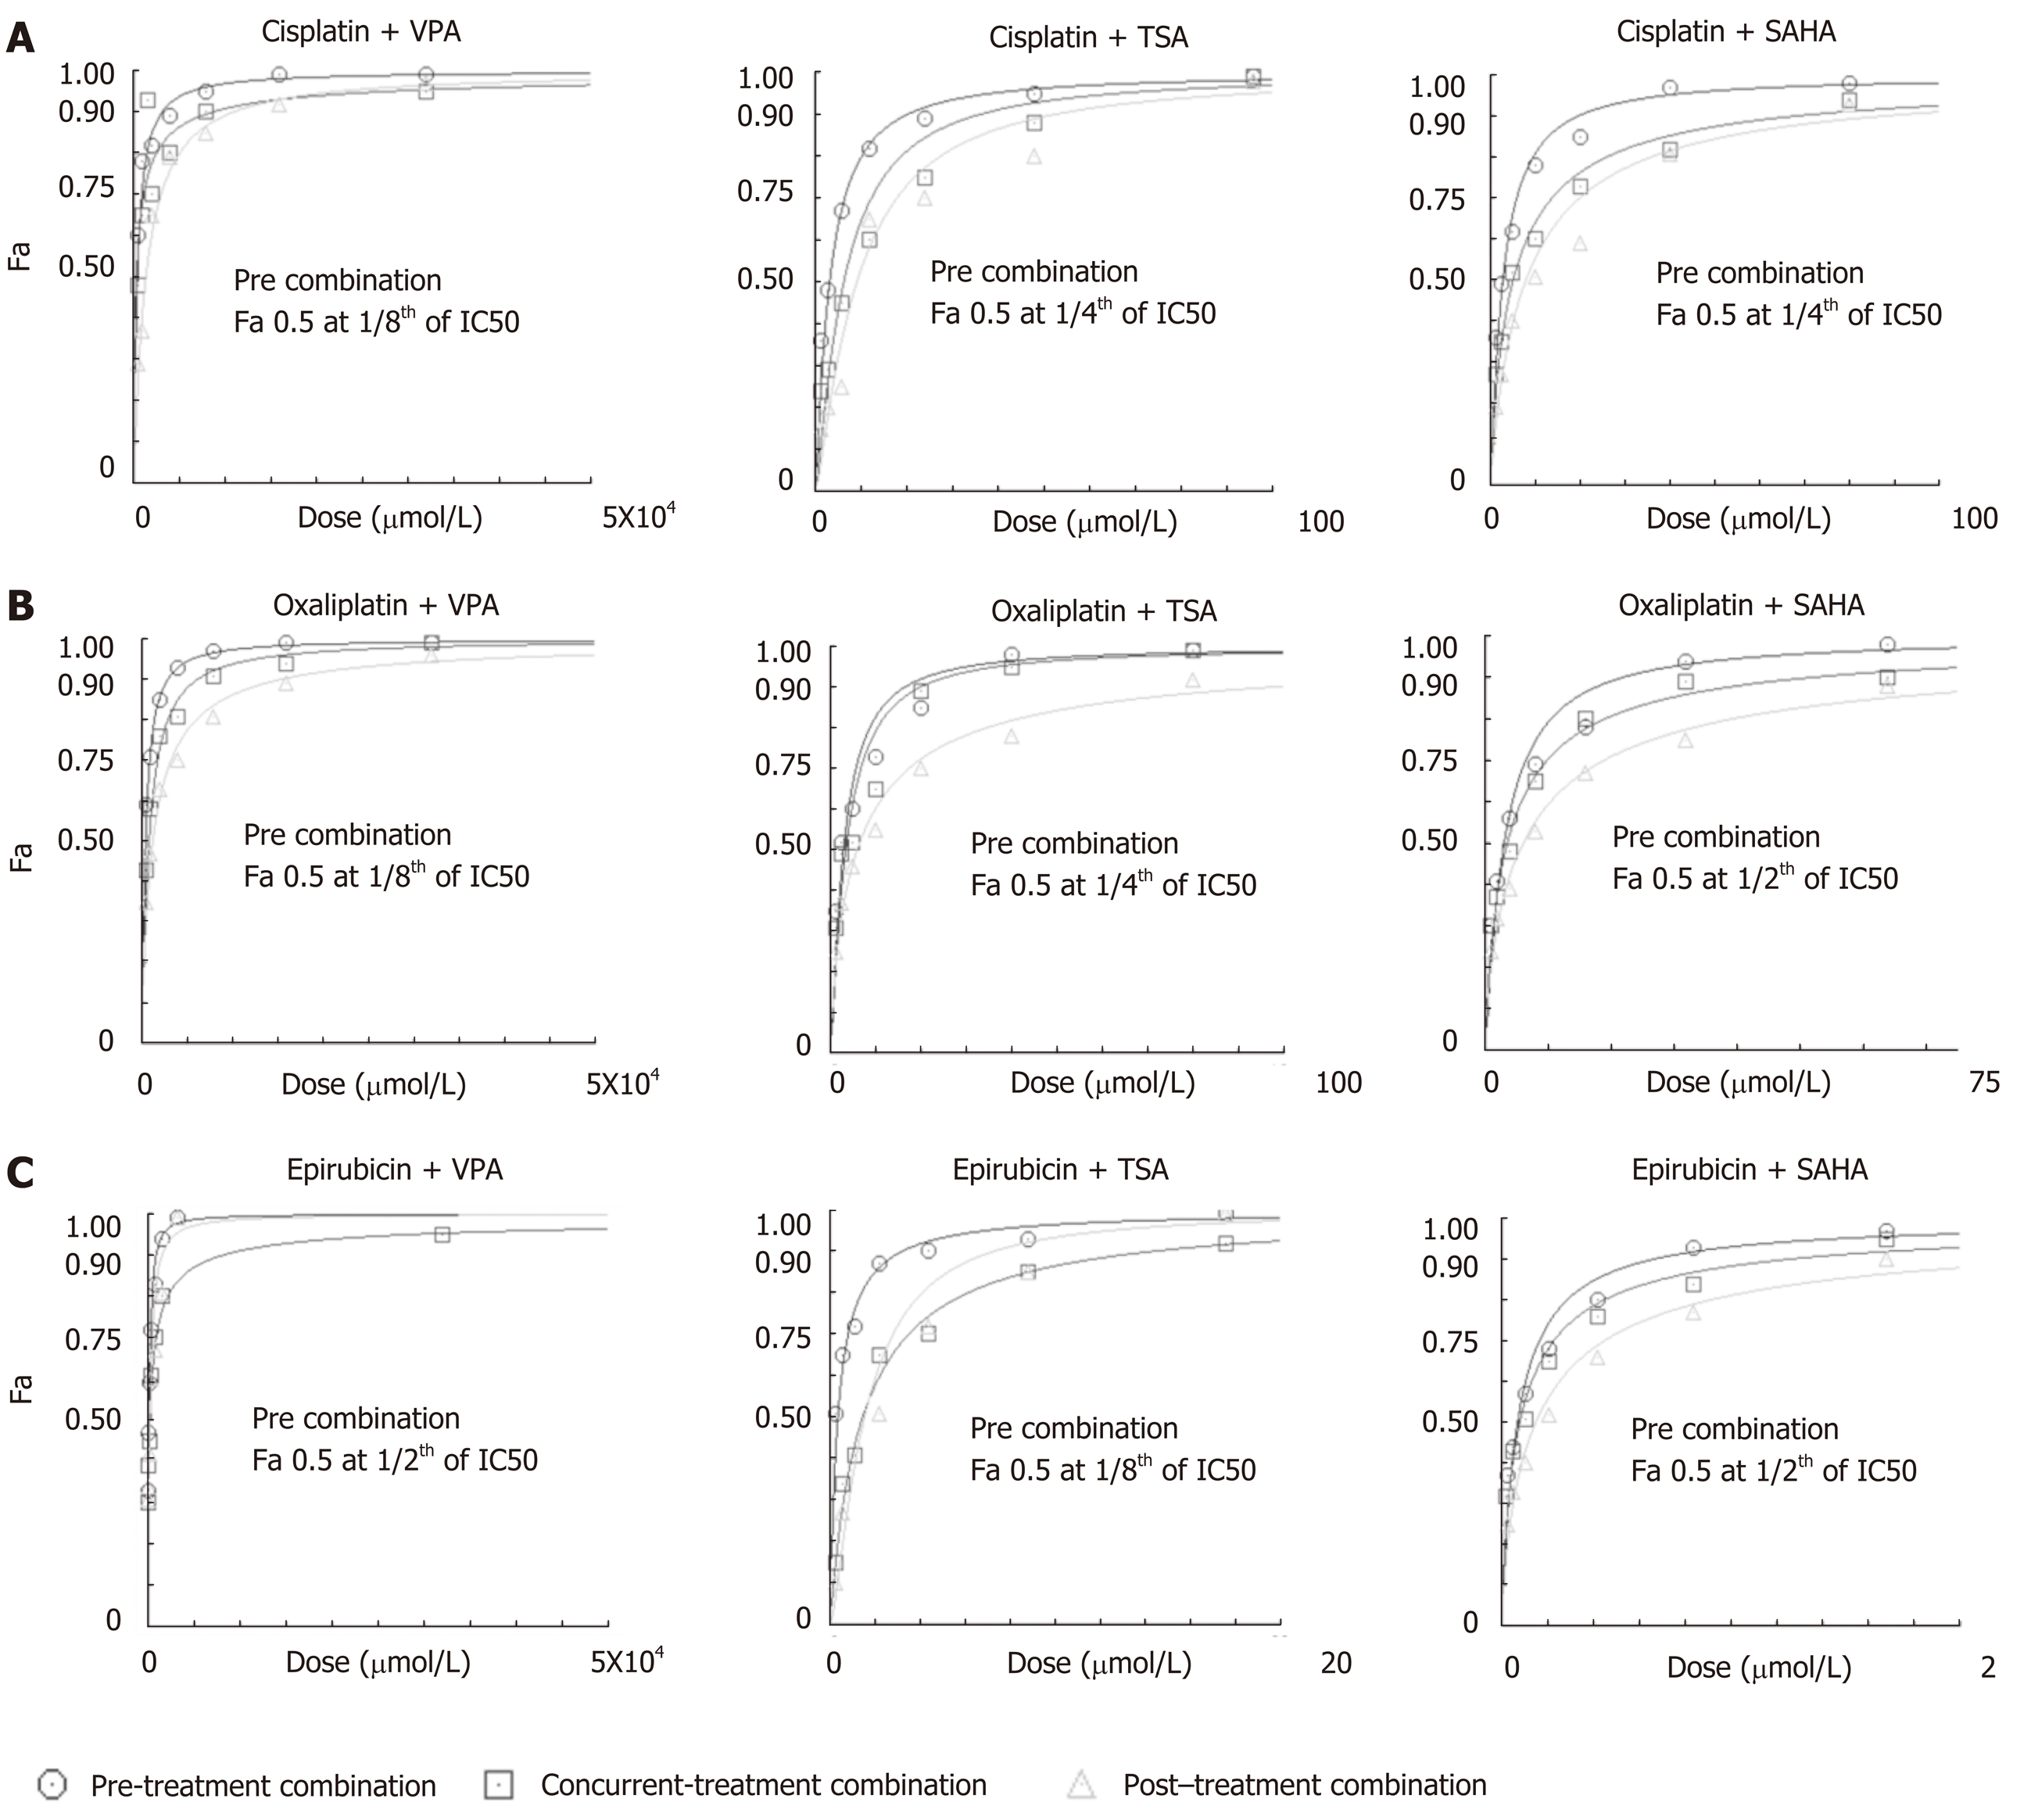
Figure 3 Histone deacetylase inhibitor-dependent sensitization of gastric cancer cells decreases the dose of chemotherapeutic drugs to attain maximum efficacy.
AGS cells were treated with chemotherapeutic drugs (cisplatin, oxaliplatin and epirubicin) and histone deacetylase (HDAC) inhibitors [valproic acid (VPA), trichostatin A (TSA) and suberoylanilide hydroxamic acid (SAHA)] for 24 h each in three different combinations: (i) concurrent (HDACi + Drug), (ii) pre- (HDACi Drug) and (iii) post- (Drug HDACi) at the combined dose (as mentioned in Supplementary Table 1), and : 3-(4,5-Dimethylthiazol-2-yl)-2,5-diphenyltetrazolium bromide (MTT) assays were performed. Fraction-affected dose response curve of A: Cisplatin; B: Oxaliplatin; and C: Epirubicin in different combinations with VPA, TSA or SAHA. TSA: Trichostatin A; VPA: Valproic acid; SAHA: Suberoylanilide hydroxamic acid.
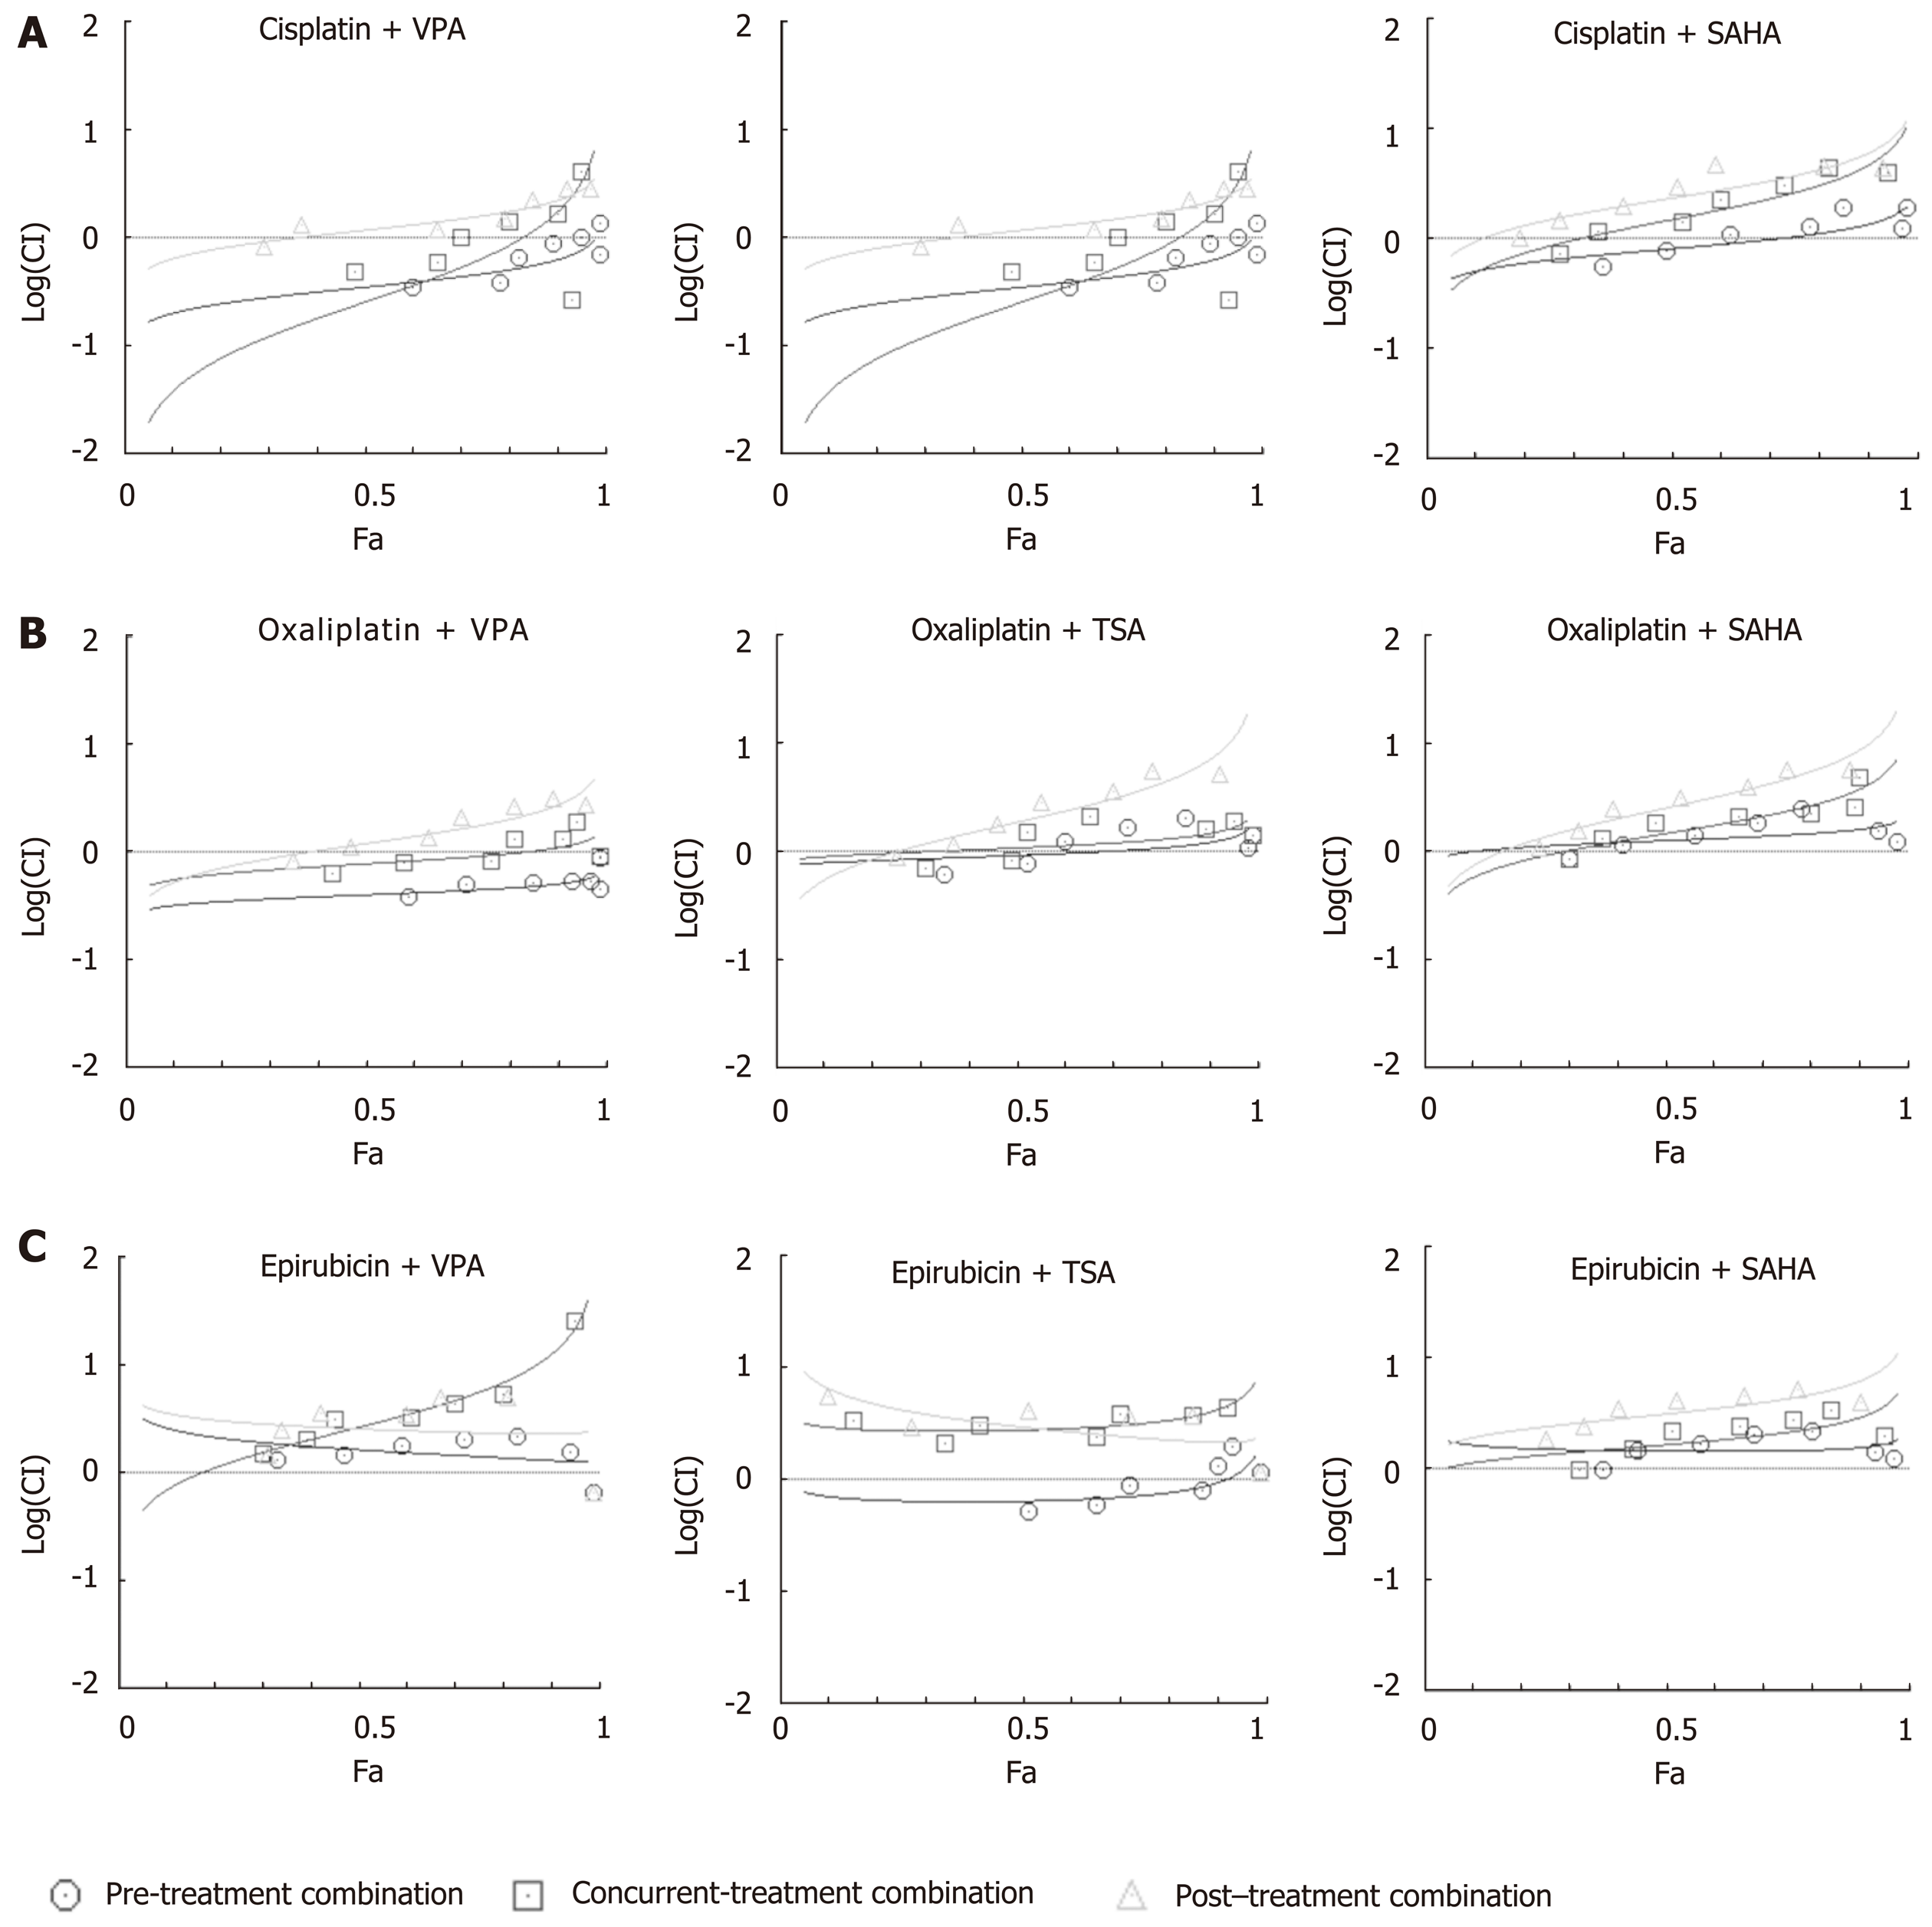
Figure 4 Median effect plot analysis for drug combinations (chemotherapeutic drugs and histone deacetylase inhibitors) as synergistic, additive or antagonistic.
AGS cells were treated with chemotherapeutic drugs (cisplatin, oxaliplatin and epirubicin) and histone deacetylase inhibitors (HDACi) [valproic acid (VPA), trichostatin A (TSA) and suberoylanilide hydroxamic acid (SAHA)] for 24 h each in three different combinations - concurrent (HDACi + Drug), pre- (HDACi Drug) and post- (Drug HDACi) at the combined dose (as mentioned in Supplementary Table 1), and : 3-(4,5-Dimethylthiazol-2-yl)-2,5-diphenyltetrazolium bromide assays were performed. Median effect plot shows the combination index (CI) on the Y-axis and fraction-affected values on the X-axis; A: Cisplatin; B: Oxaliplatin; and C: Epirubicin in different combinations with VPA (left panel), TSA (middle panel) and SAHA (right panel). For a particular fraction affected value, the combination index values range from 0 to 1; CI < 0.8, CI = 0.8-1.2, and CI > 1.2 represents the synergistic, additive or antagonistic nature of drug combinations, respectively. GC: Gastric cancer; HDACi: Histone deacetylase inhibitor; HDAC: Histone deacetylase; Drug: Chemotherapy drugs; VPA: Valproic acid; SAHA: Suberanilohydroxamic acid; TSA: Trichostatin A; MTT: 3-(4,5-Dimethylthiazol-2-yl)-2,5-diphenyltetrazolium bromide; CI: Combination index.
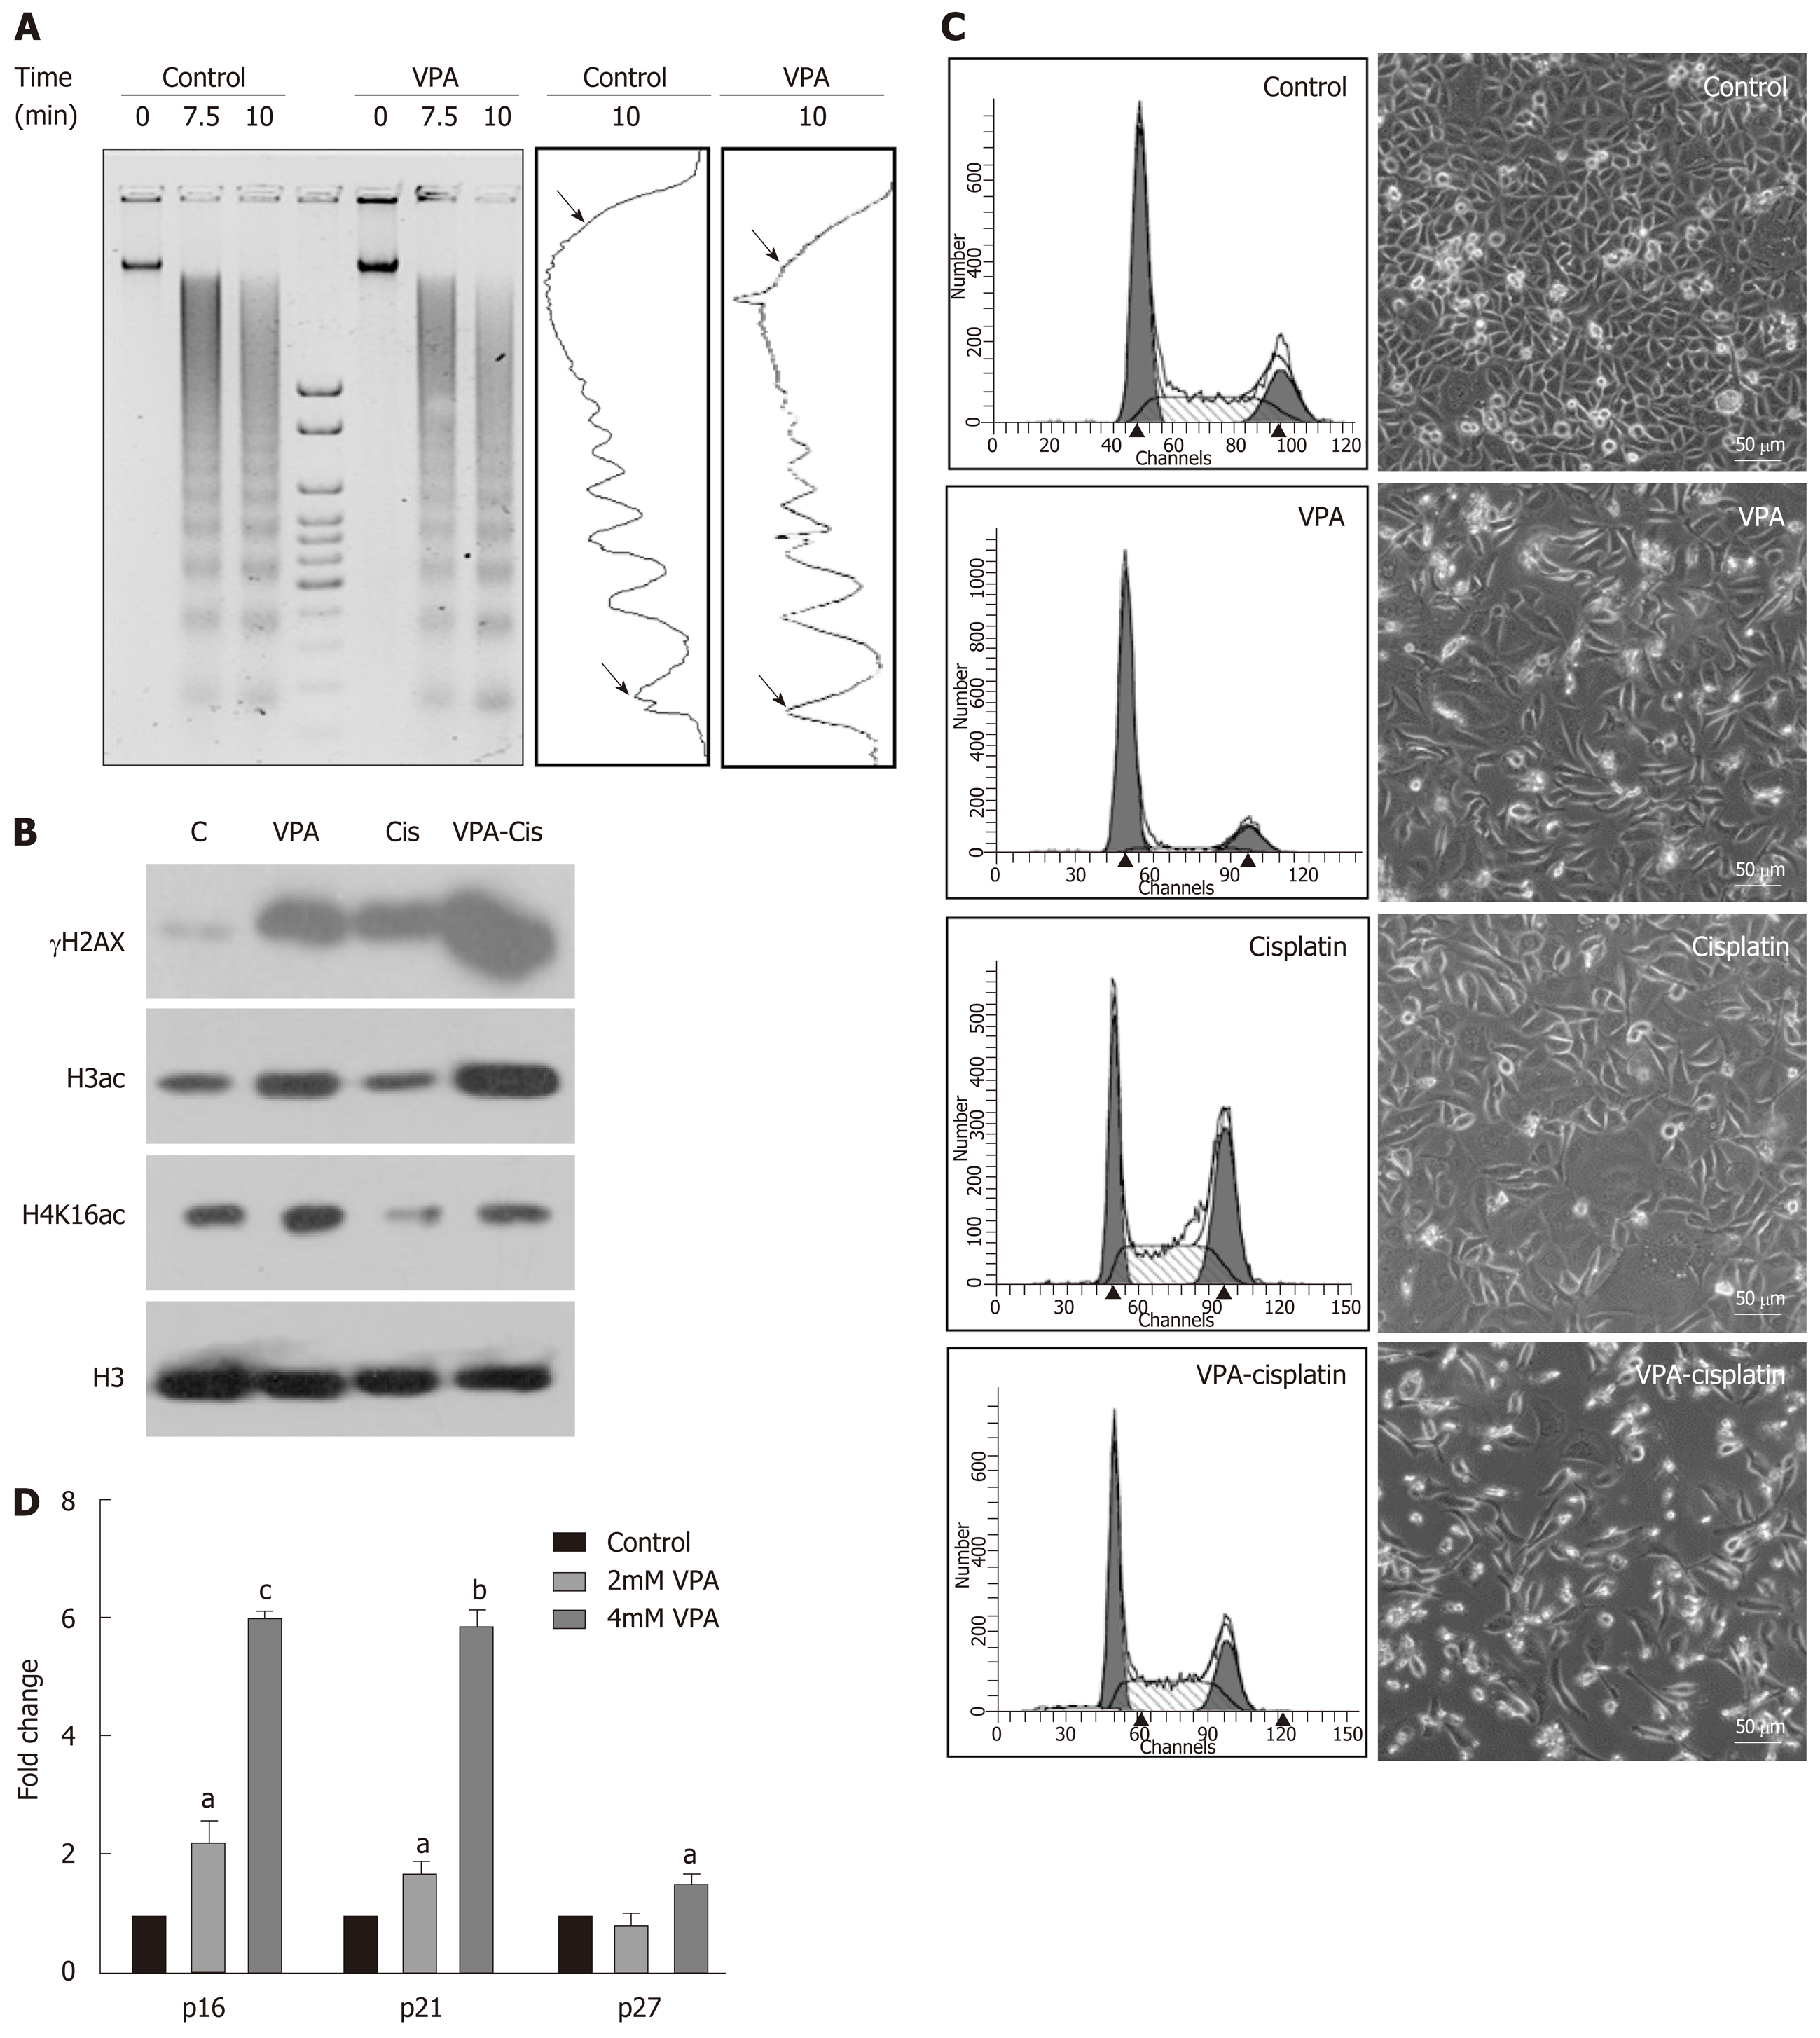
Figure 5 Pretreatment regime is associated with chromatin relaxation, enhanced DNA damage and re-expression of tumor suppressors.
A: Chromatin organization in the AGS cell line by micrococcal nuclease (MNase) assays with time-dependent kinetics was studied following 24 h treatment with valproic acid (VPA) (2 mmol/L). AGS cells were treated with an inhibitory concentration (IC)25 concentration of cisplatin and VPA alone or in combination for 24 h, and the following parameters were analyzed: B: Histone post-translational modifications; C: Cell cycle profile and morphology; and D: Effect of VPA on re-expression of tumor suppressors was studied by treating AGS cells with the IC25 and IC50 concentrations of VPA for 24 h, followed by real time PCR for the p16, p21 and p27 genes (aP < 0.02; bP < 0.0009; cP < 0.0001). MNase: Micrococcal nuclease; HDACi: Histone deacetylase inhibitor; PTMs: Post-translational modifications; VPA: Valproic acid; IC: Inhibitory concentration; PCR: Polymerase chain reaction.
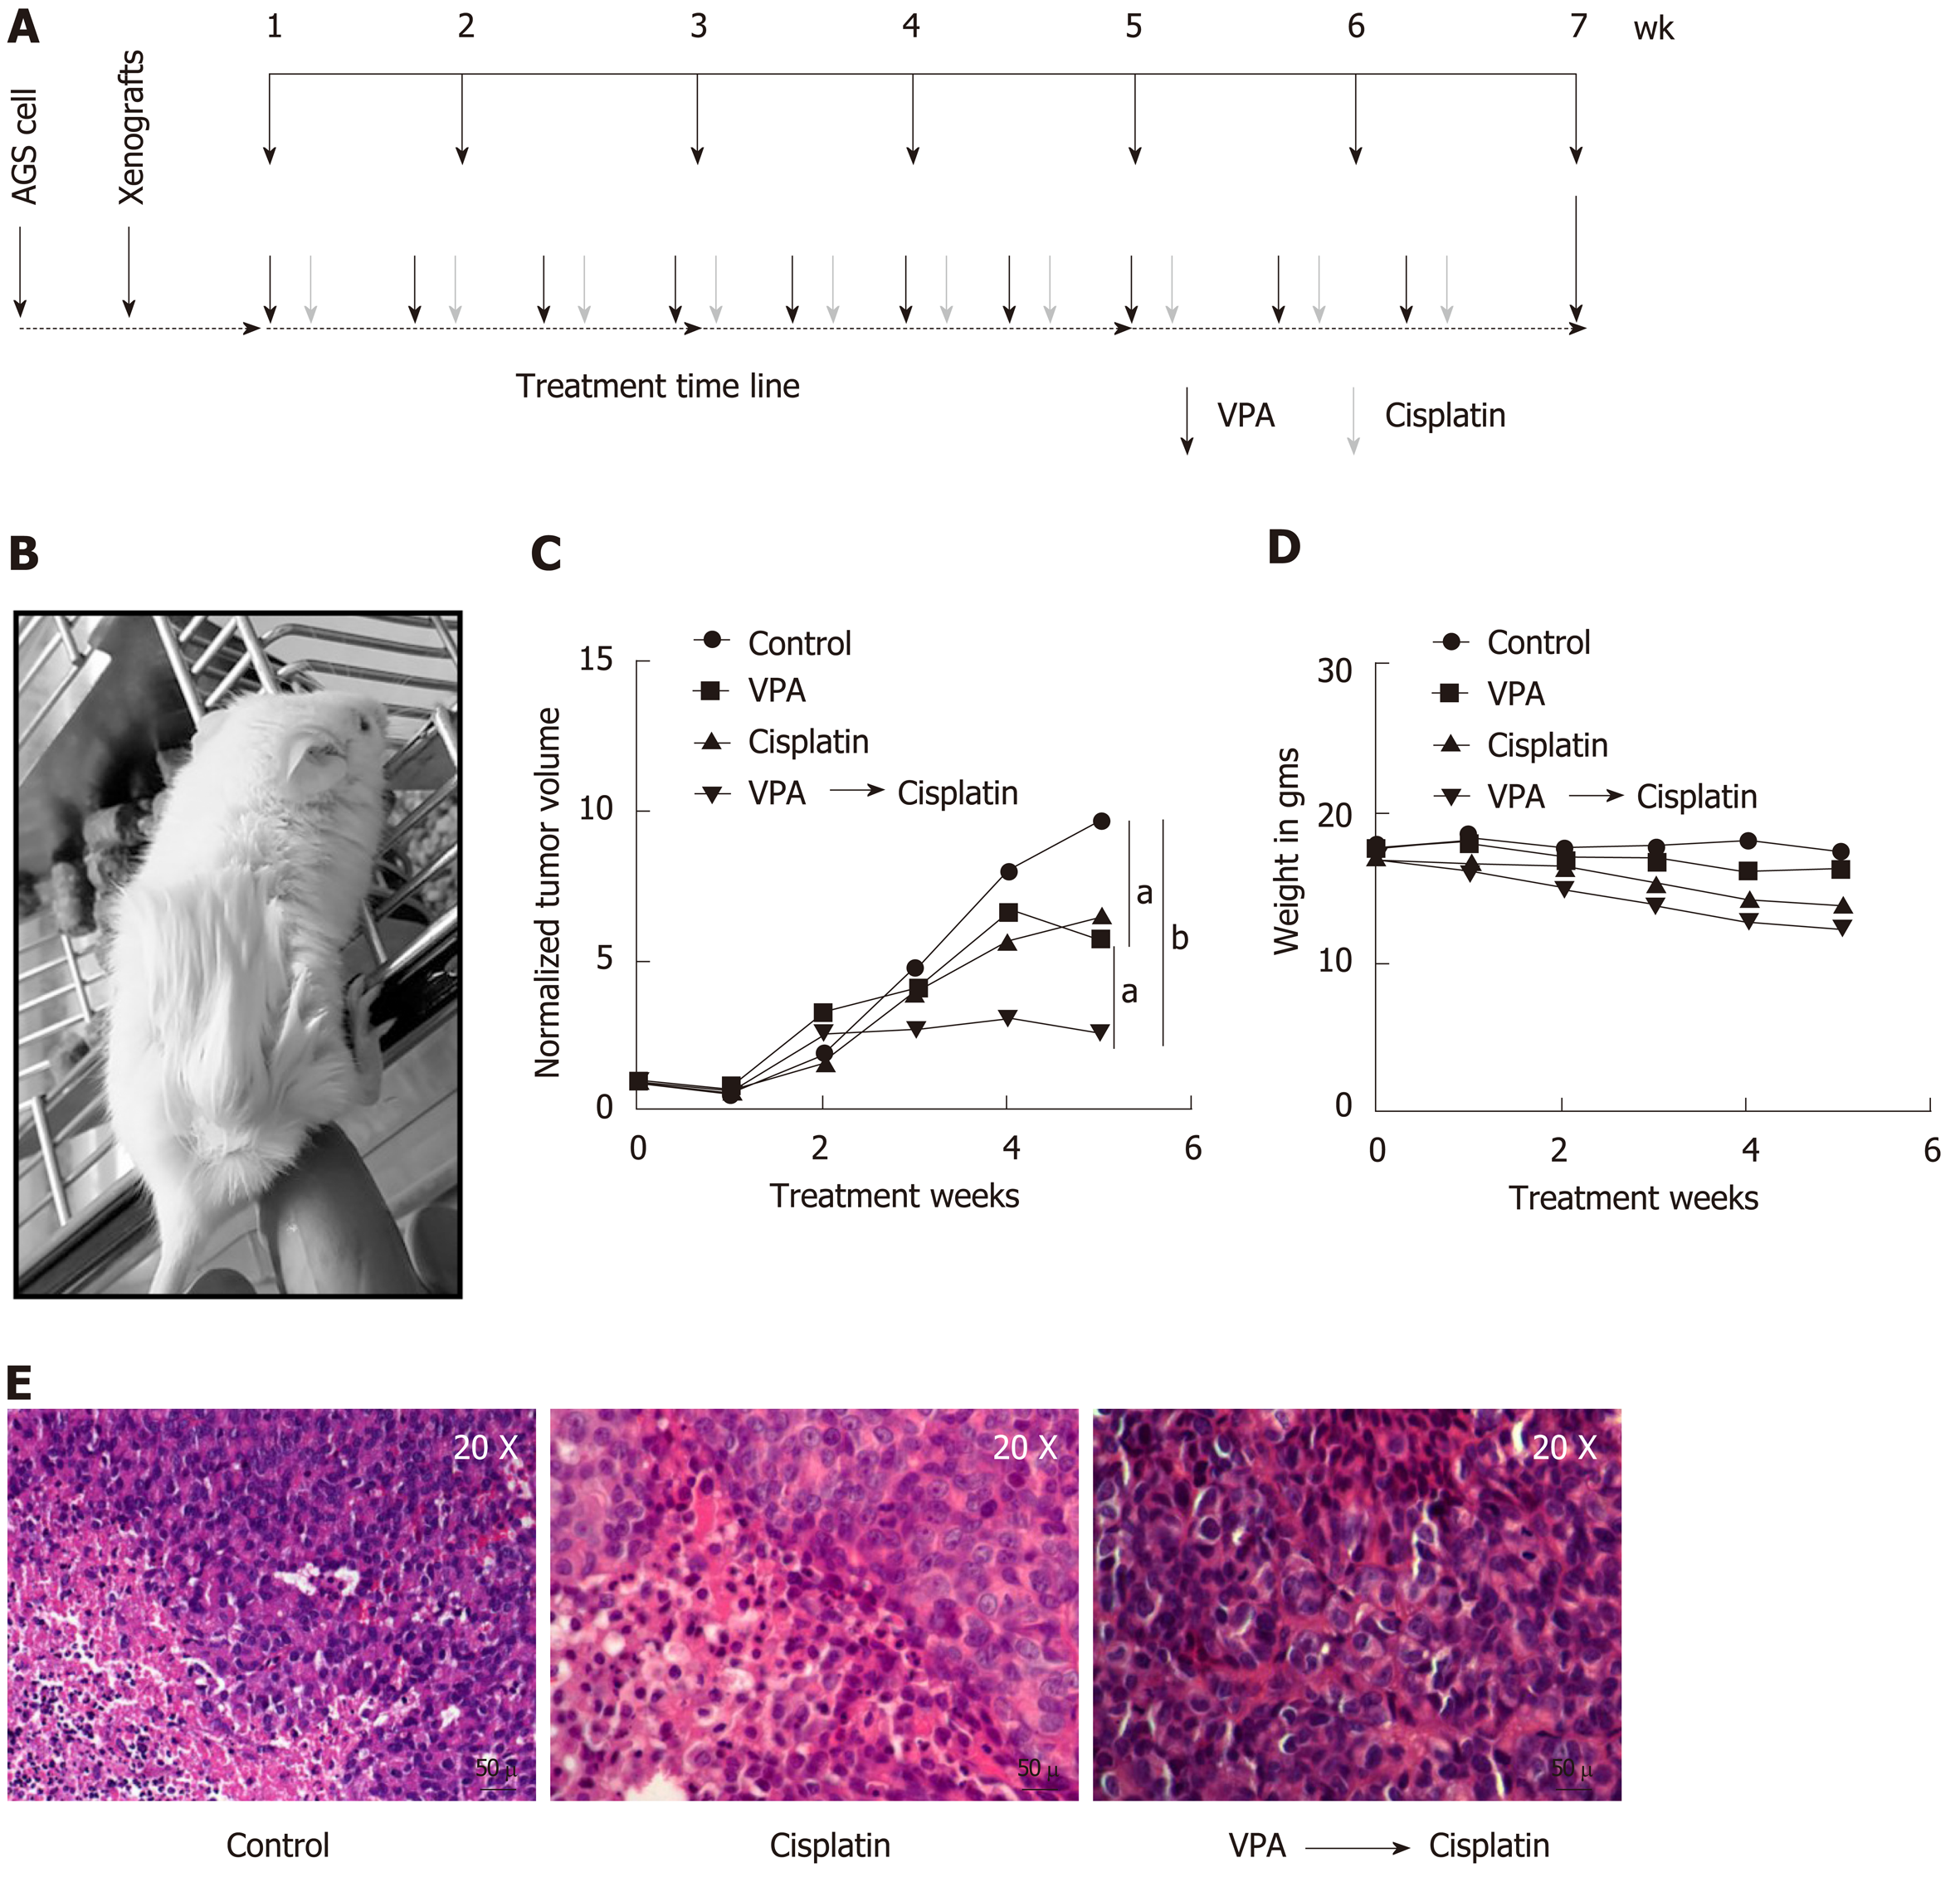
Figure 6 Valproic sensitizes AGS cell xenografts to cisplatin in an in vivo mice model.
A: Schematic diagram depicting timeline of in vivo drug administration. AGS cells were injected into NOD-SCID mice. After tumors reached approximately 100 mm3; B: Mice were divided into four groups (n = 3), (1) control, (2) valproic acid (300 mg/kg/d), (3) cisplatin (2 mg/kg/d), and (4) combinatorial treatment of valproic acid followed by cisplatin at the same dose mentioned above; C: Average tumor volumes of groups normalized to the initial tumor volumes (before treatment) are plotted over a period of 5 wk of drug treatment. The outcome of the different treatment regimens was statistically validated by performing unpaired t-tests (aP < 0.05; bP < 0.005); D: Mean weight of animals in a group measured over the treatment period to assess toxicity; E: Histopathology of tumor sections by hematoxylin and eosin staining of different groups following 5 wk of treatment. VPA: Valproic acid.
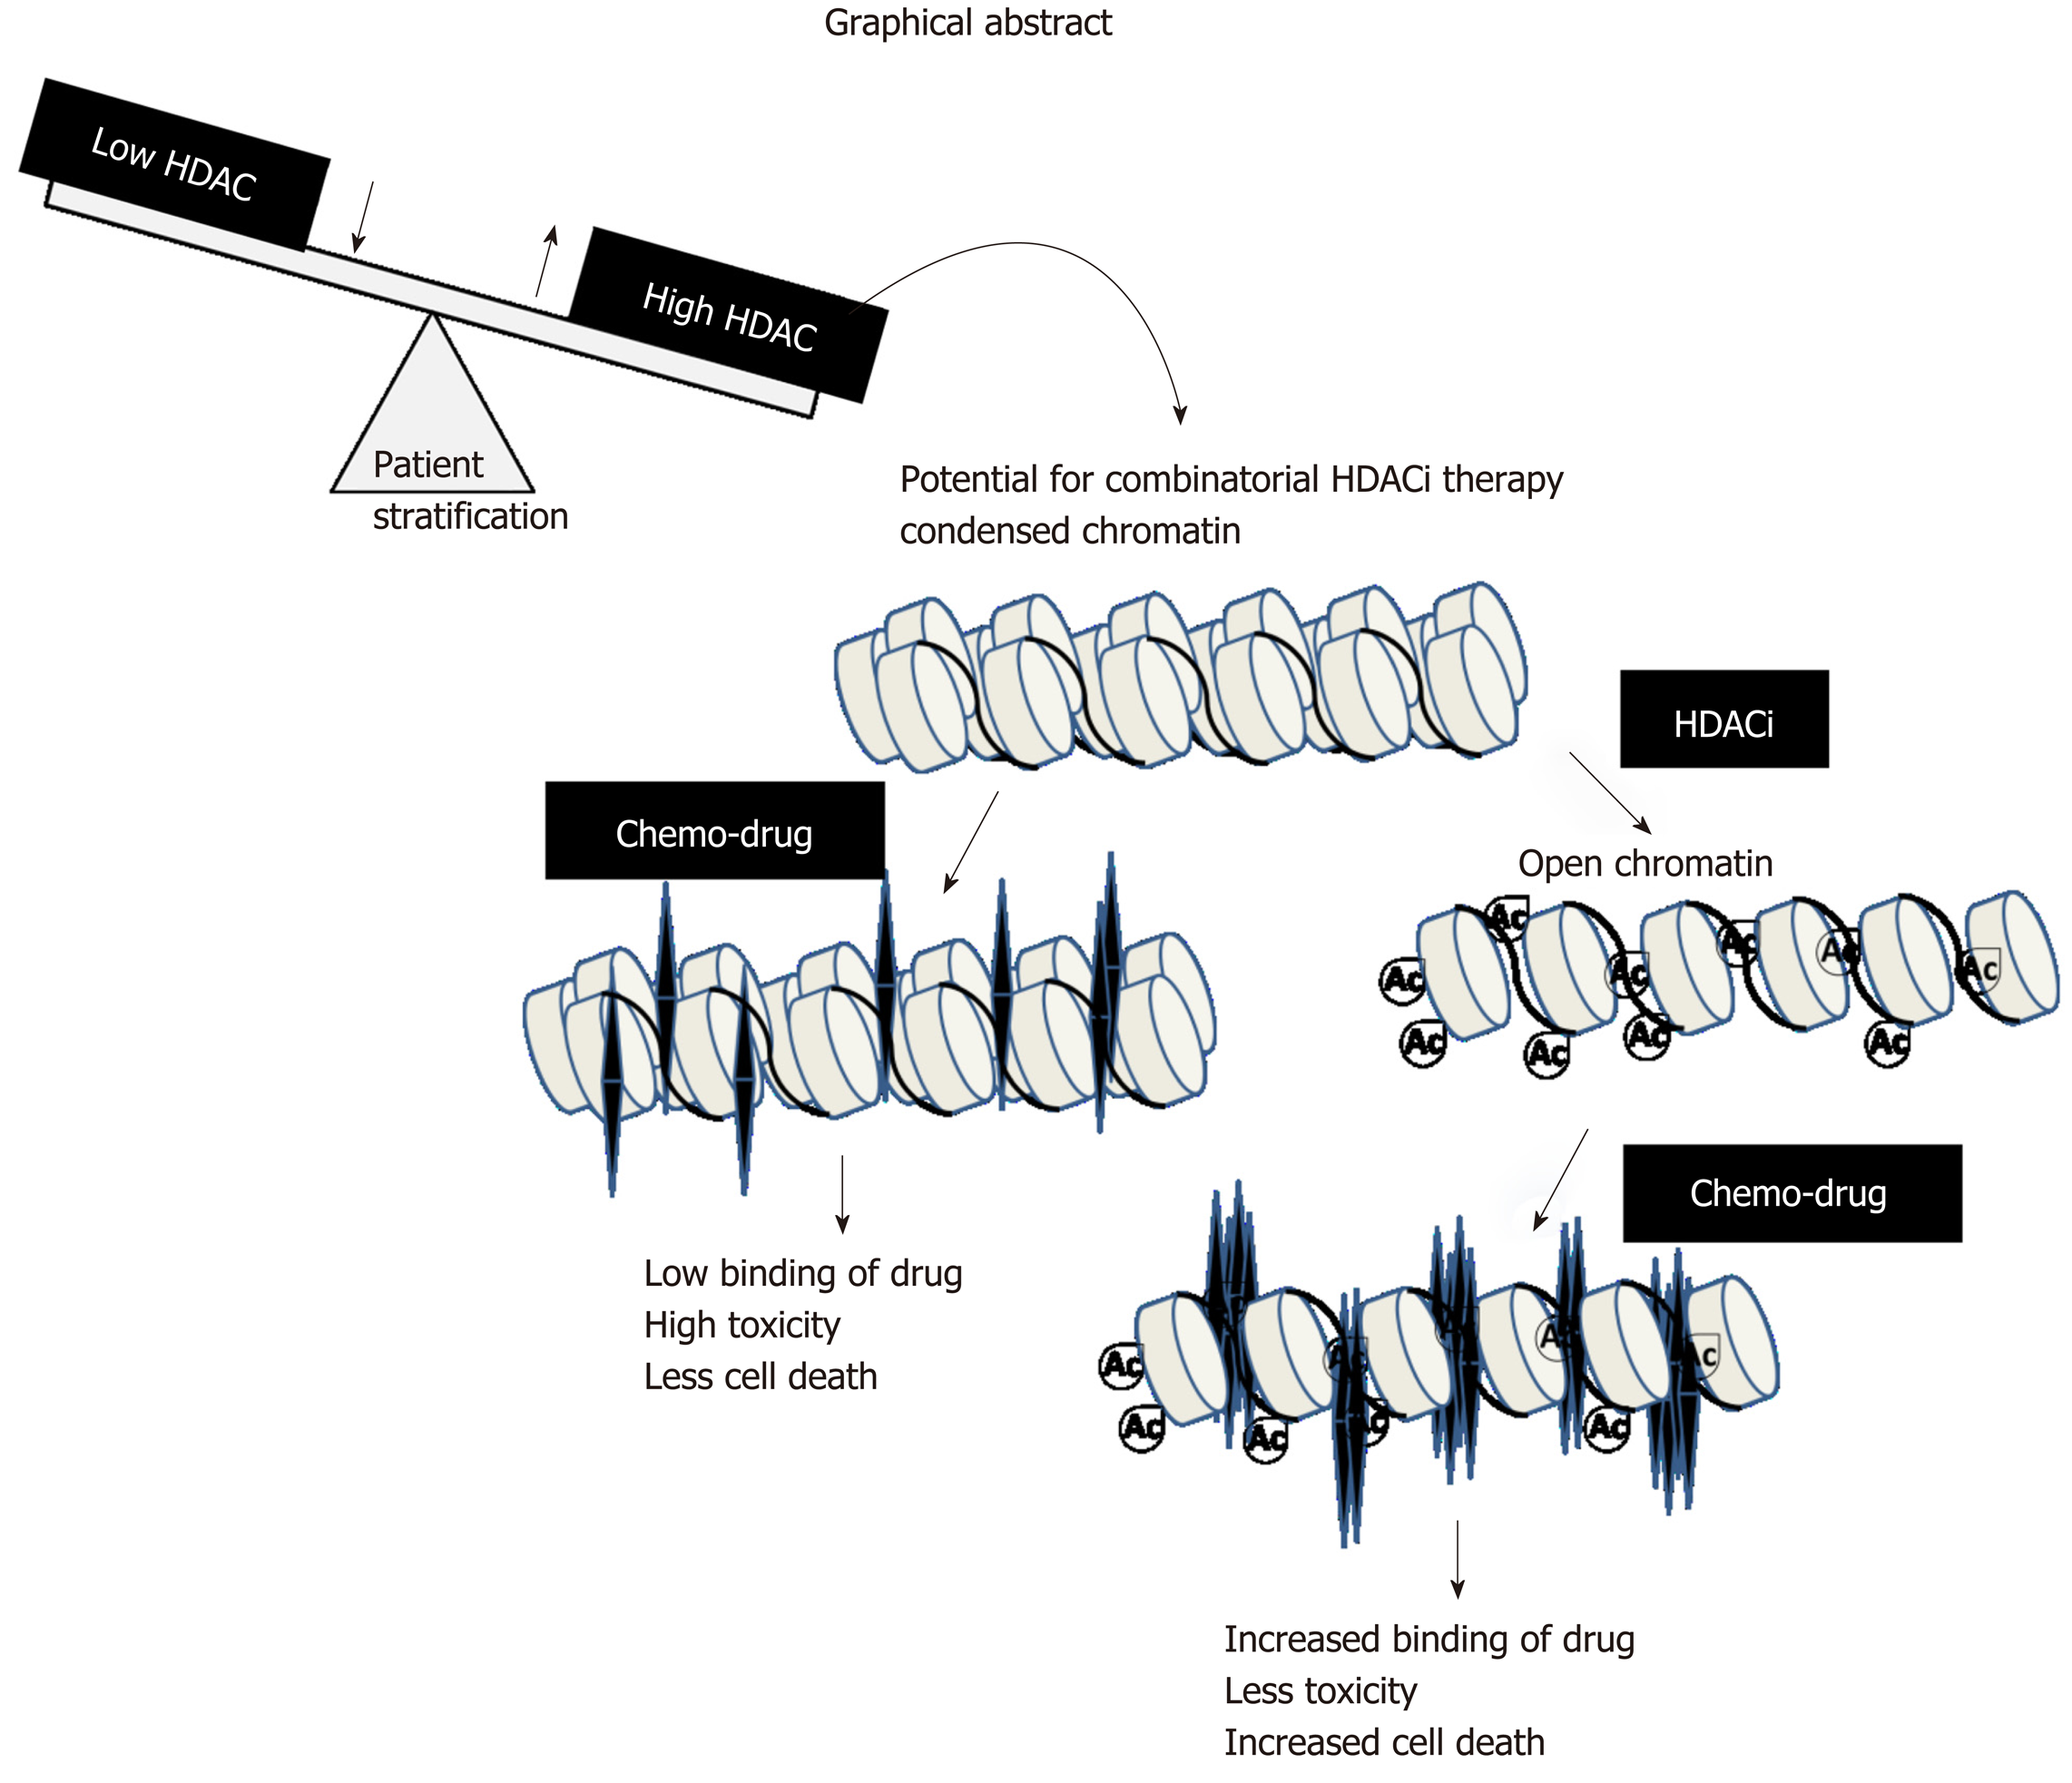
Figure 7 Graphical abstract: Model depicting stratification of patients with high histone deacetylase activity/levels of histone deacetylase inhibitor therapy.
A prior treatment of histone deacetylase inhibitors would relax the condensed chromatin of a stratified patient group, making it more accessible and increasing its interaction with chemotherapeutic drugs compared to only first-line chemo treatment. This would enhance the number of cells killed at lower drug concentrations with a decrease in side-effects and toxicity. HDAC: Histone deacetylase; HAT: Histone acetyl transferase.
- Citation: Amnekar RV, Khan SA, Rashid M, Khade B, Thorat R, Gera P, Shrikhande SV, Smoot DT, Ashktorab H, Gupta S. Histone deacetylase inhibitor pre-treatment enhances the efficacy of DNA-interacting chemotherapeutic drugs in gastric cancer. World J Gastroenterol 2020; 26(6): 598-613
- URL: https://www.wjgnet.com/1007-9327/full/v26/i6/598.htm
- DOI: https://dx.doi.org/10.3748/wjg.v26.i6.598


