Copyright
©The Author(s) 2020.
World J Gastroenterol. Feb 14, 2020; 26(6): 598-613
Published online Feb 14, 2020. doi: 10.3748/wjg.v26.i6.598
Published online Feb 14, 2020. doi: 10.3748/wjg.v26.i6.598
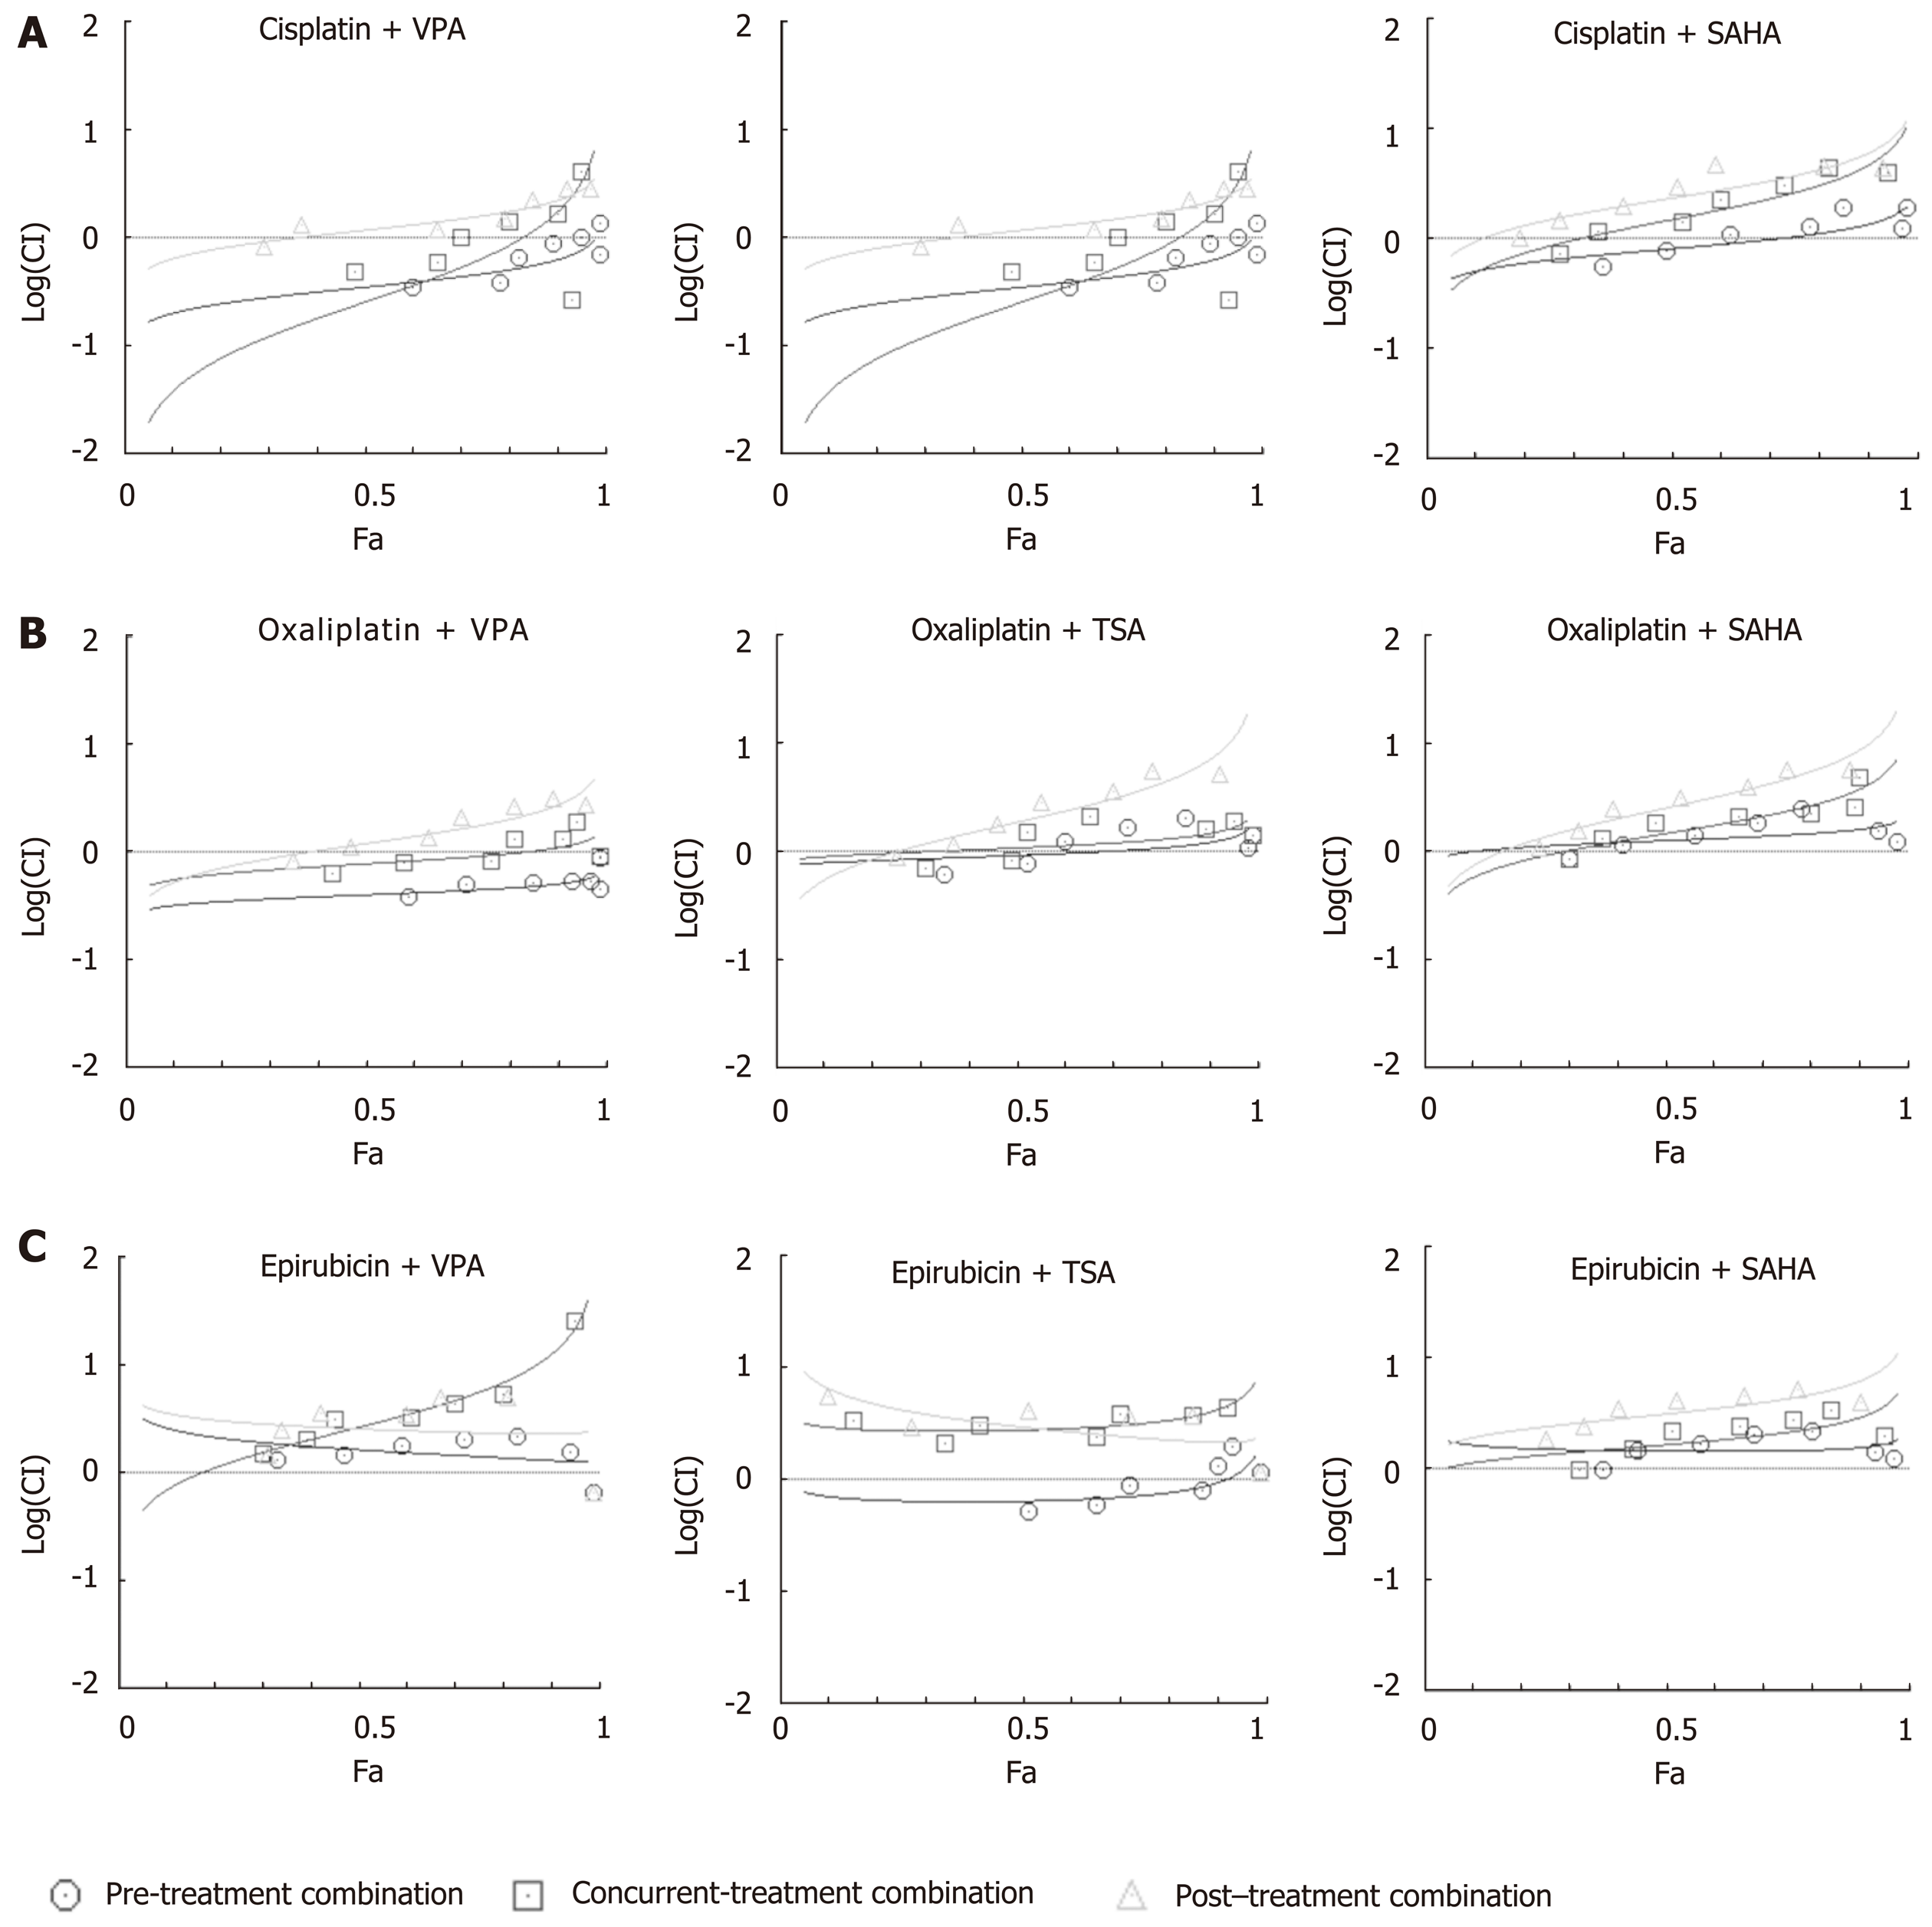
Figure 4 Median effect plot analysis for drug combinations (chemotherapeutic drugs and histone deacetylase inhibitors) as synergistic, additive or antagonistic.
AGS cells were treated with chemotherapeutic drugs (cisplatin, oxaliplatin and epirubicin) and histone deacetylase inhibitors (HDACi) [valproic acid (VPA), trichostatin A (TSA) and suberoylanilide hydroxamic acid (SAHA)] for 24 h each in three different combinations - concurrent (HDACi + Drug), pre- (HDACi Drug) and post- (Drug HDACi) at the combined dose (as mentioned in Supplementary Table 1), and : 3-(4,5-Dimethylthiazol-2-yl)-2,5-diphenyltetrazolium bromide assays were performed. Median effect plot shows the combination index (CI) on the Y-axis and fraction-affected values on the X-axis; A: Cisplatin; B: Oxaliplatin; and C: Epirubicin in different combinations with VPA (left panel), TSA (middle panel) and SAHA (right panel). For a particular fraction affected value, the combination index values range from 0 to 1; CI < 0.8, CI = 0.8-1.2, and CI > 1.2 represents the synergistic, additive or antagonistic nature of drug combinations, respectively. GC: Gastric cancer; HDACi: Histone deacetylase inhibitor; HDAC: Histone deacetylase; Drug: Chemotherapy drugs; VPA: Valproic acid; SAHA: Suberanilohydroxamic acid; TSA: Trichostatin A; MTT: 3-(4,5-Dimethylthiazol-2-yl)-2,5-diphenyltetrazolium bromide; CI: Combination index.
- Citation: Amnekar RV, Khan SA, Rashid M, Khade B, Thorat R, Gera P, Shrikhande SV, Smoot DT, Ashktorab H, Gupta S. Histone deacetylase inhibitor pre-treatment enhances the efficacy of DNA-interacting chemotherapeutic drugs in gastric cancer. World J Gastroenterol 2020; 26(6): 598-613
- URL: https://www.wjgnet.com/1007-9327/full/v26/i6/598.htm
- DOI: https://dx.doi.org/10.3748/wjg.v26.i6.598


