Copyright
©The Author(s) 2020.
World J Gastroenterol. Feb 7, 2020; 26(5): 499-513
Published online Feb 7, 2020. doi: 10.3748/wjg.v26.i5.499
Published online Feb 7, 2020. doi: 10.3748/wjg.v26.i5.499
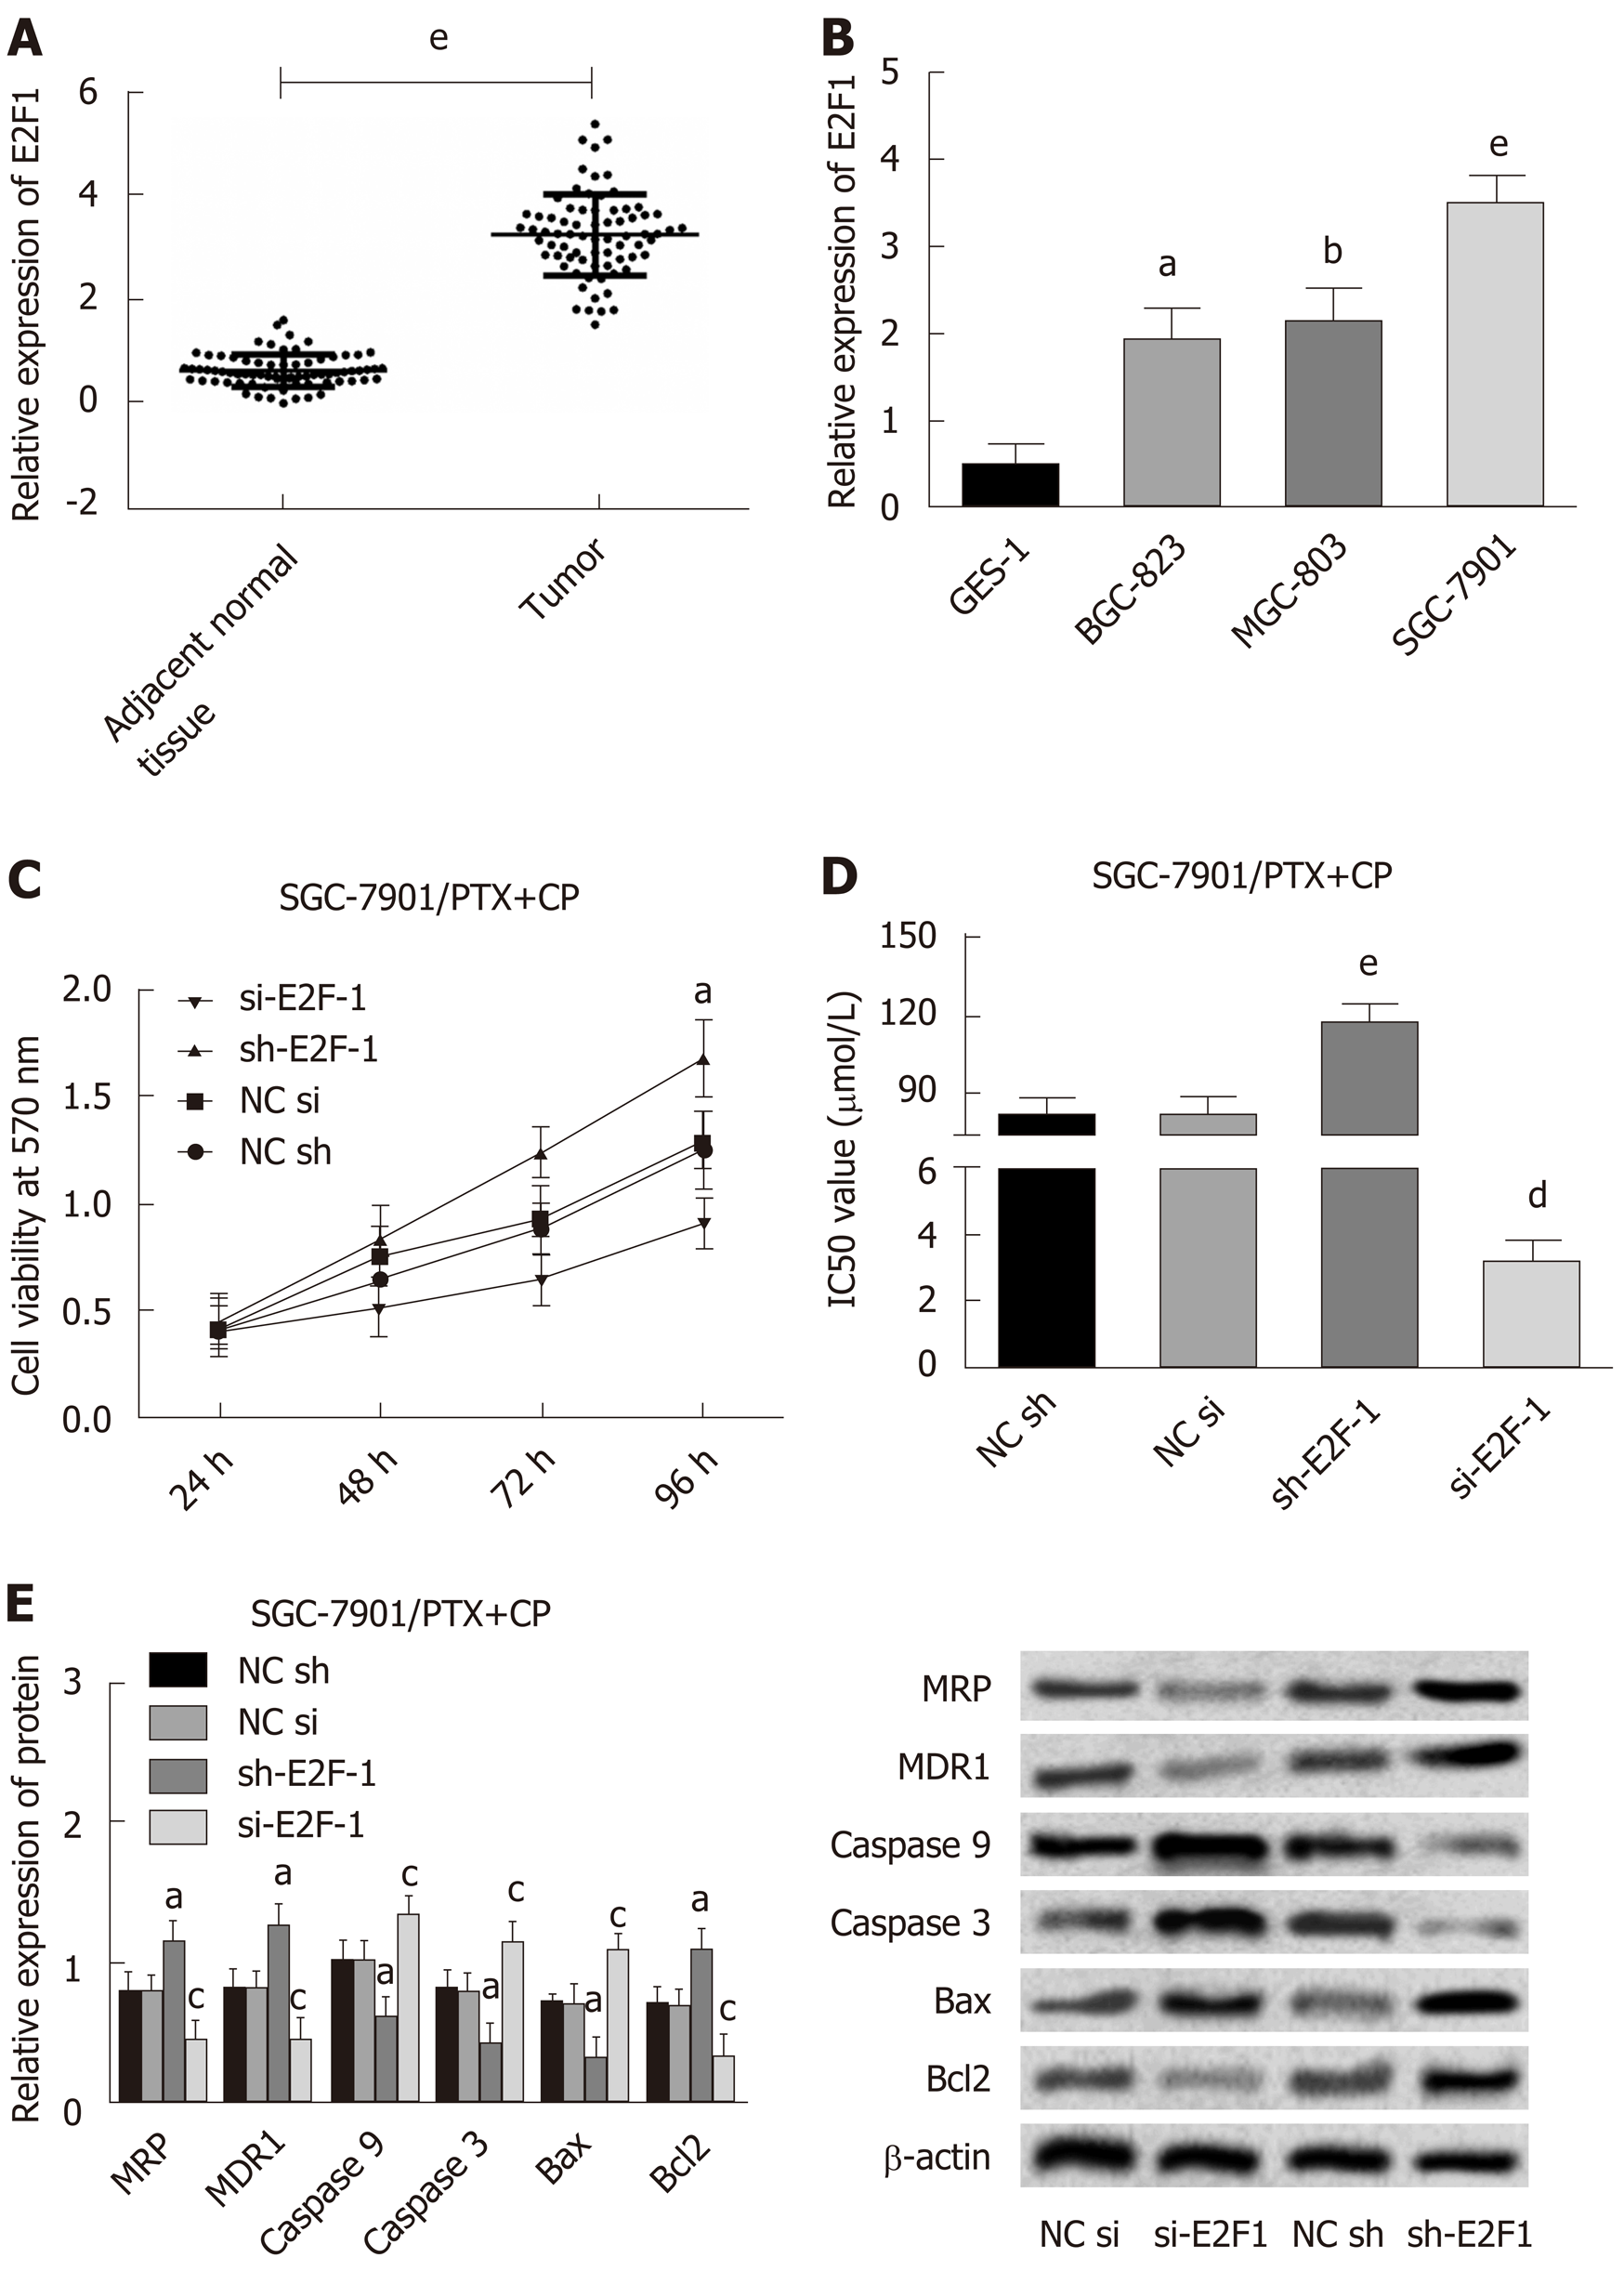
Figure 1 E2F transcription factor 1 enhances cell activity and promotes the formation of drug resistance.
A: E2F1 was highly expressed in GC tissues, eP < 0.001; B: E2F1 was highly expressed in GC cells. aP < 0.05, bP < 0.01, and eP < 0.001 when compared with GES-1; C: E2F1 enhanced cell activity, a indicated aP < 0.05 when compared between groups; D: E2F1 promoted cell resistance. eP < 0.001 vs the NC sh group, and dP < 0.01 vs the NC si group; E: E2F1 promoted the expression levels of MRP, MDR-1, Bcl2, and inhibited the expression levels of Caspase 9, Caspase 3, and Bax. aP < 0.05 vs the NC sh group, and cP < 0.05 vs the NC si group.
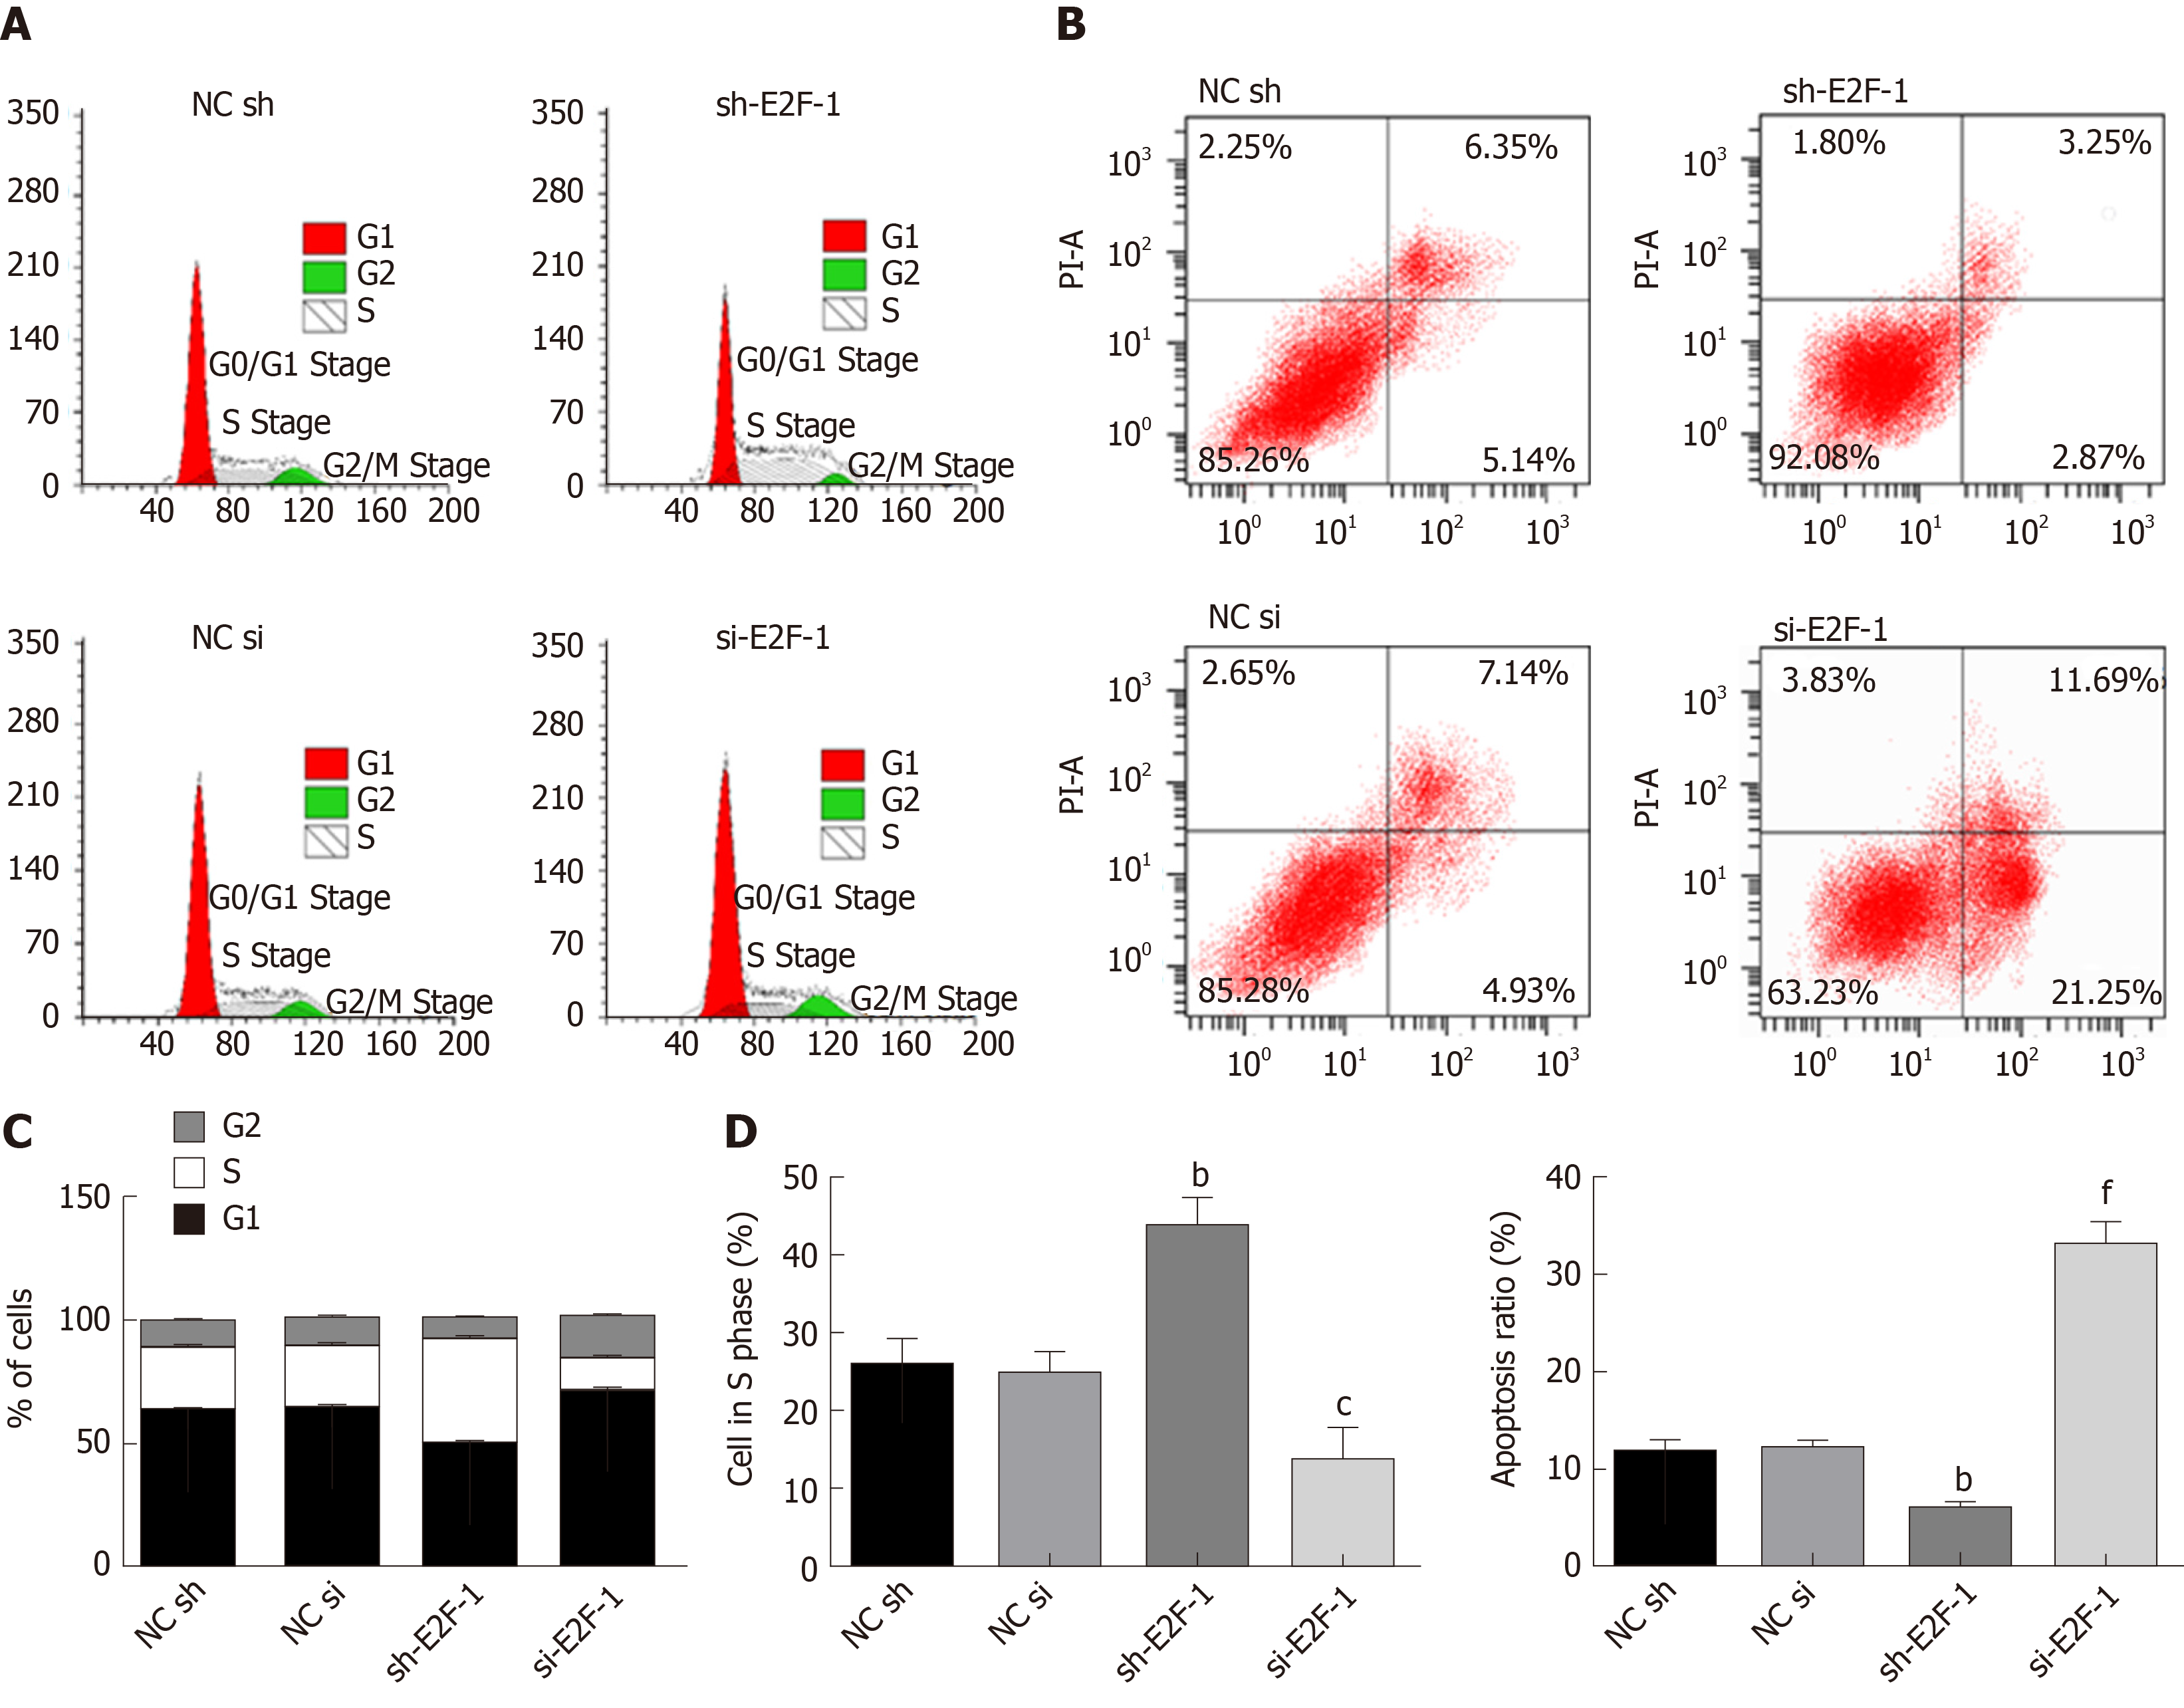
Figure 2 E2F transcription factor 1 promotes the proliferation and inhibits the apoptosis of gastric cancer cells.
A: Cell cycle of each group was measured by flow cytometry; B: Cell apoptosis of each group was detected by flow cytometry; C: E2F1 promoted S-phase cell proliferation; D: E2F1 inhibited apoptosis. bP < 0.01 vs the NC sh group, cP < 0.05 vs the NC si group; and fP < 0.001 vs the NC si group.
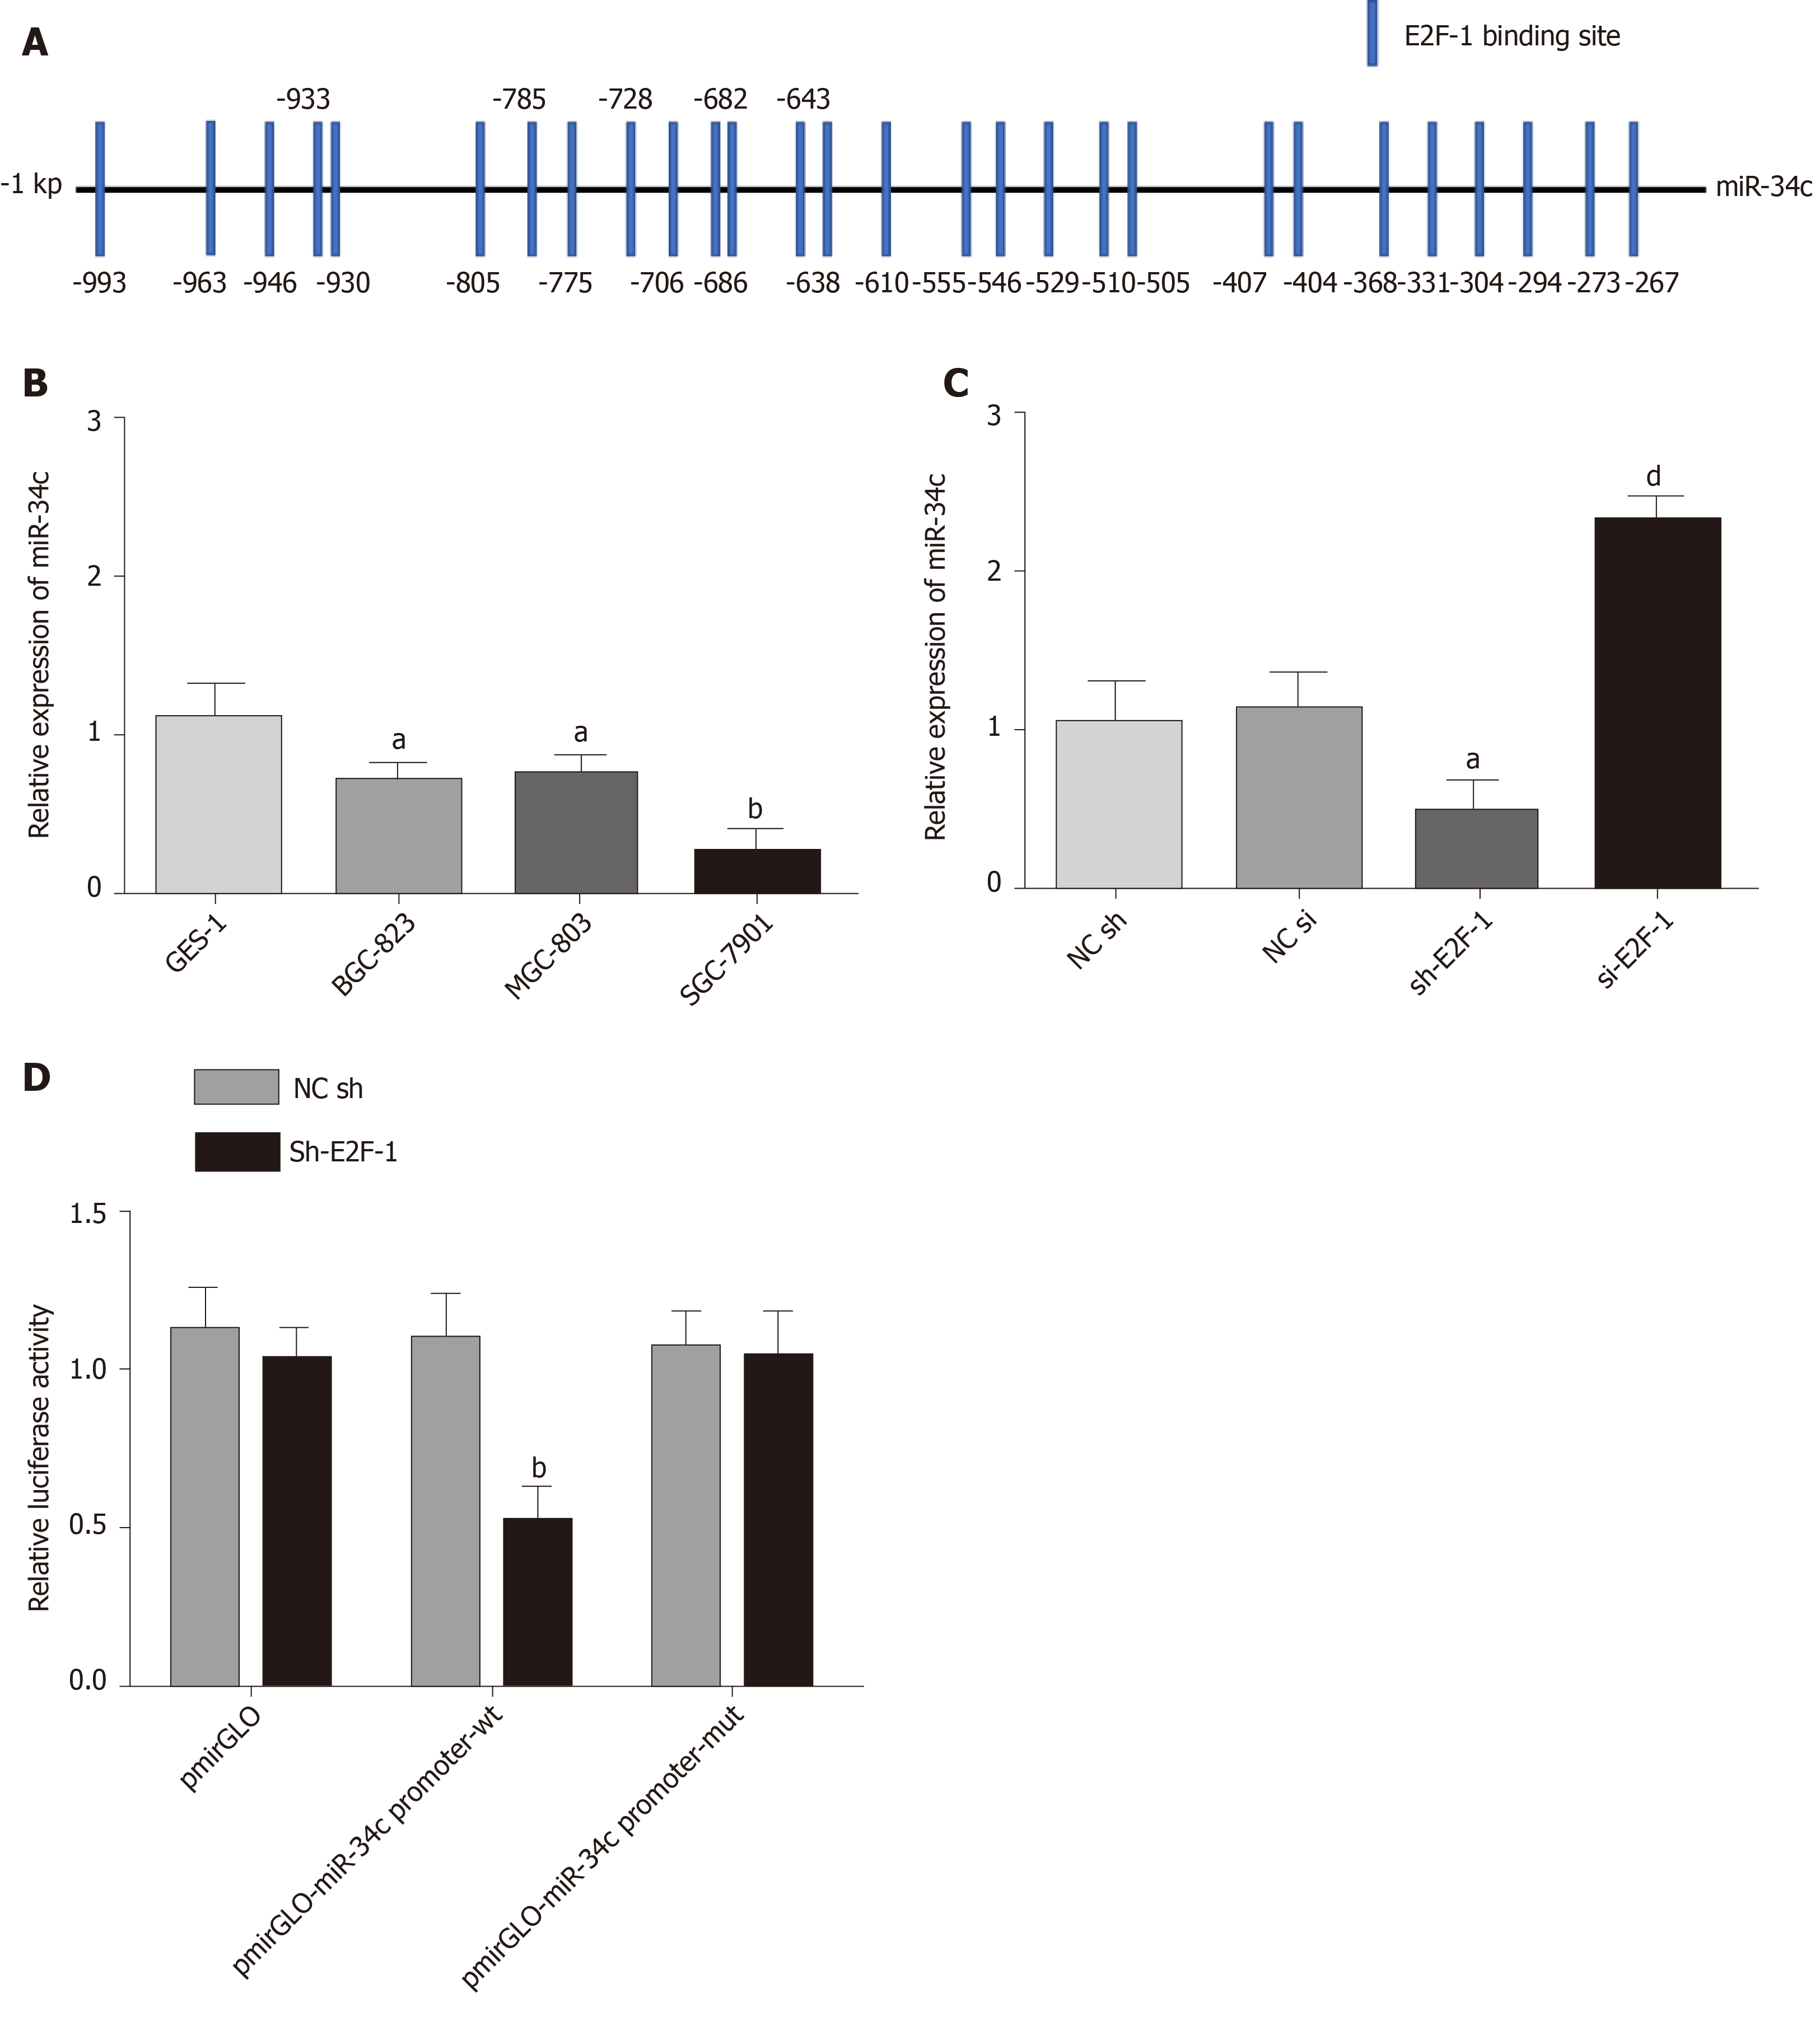
Figure 3 E2F transcription factor 1 targeted inhibition of microRNA 34c transcription.
A: There were binding sites in the promoter region between E2F1 and miR-34c; B: miR-34c presented low expression in GC cells. aP < 0.05 and bP < 0.01 vs GES-1; C: E2F1 might inhibit the expression of miR-34c. aP < 0.05, and dP < 0.01; D: Double luciferase reporter gene validated the targeting relationship between E2F1 and miR-34c. bP < 0.01 vs NC mimcs.
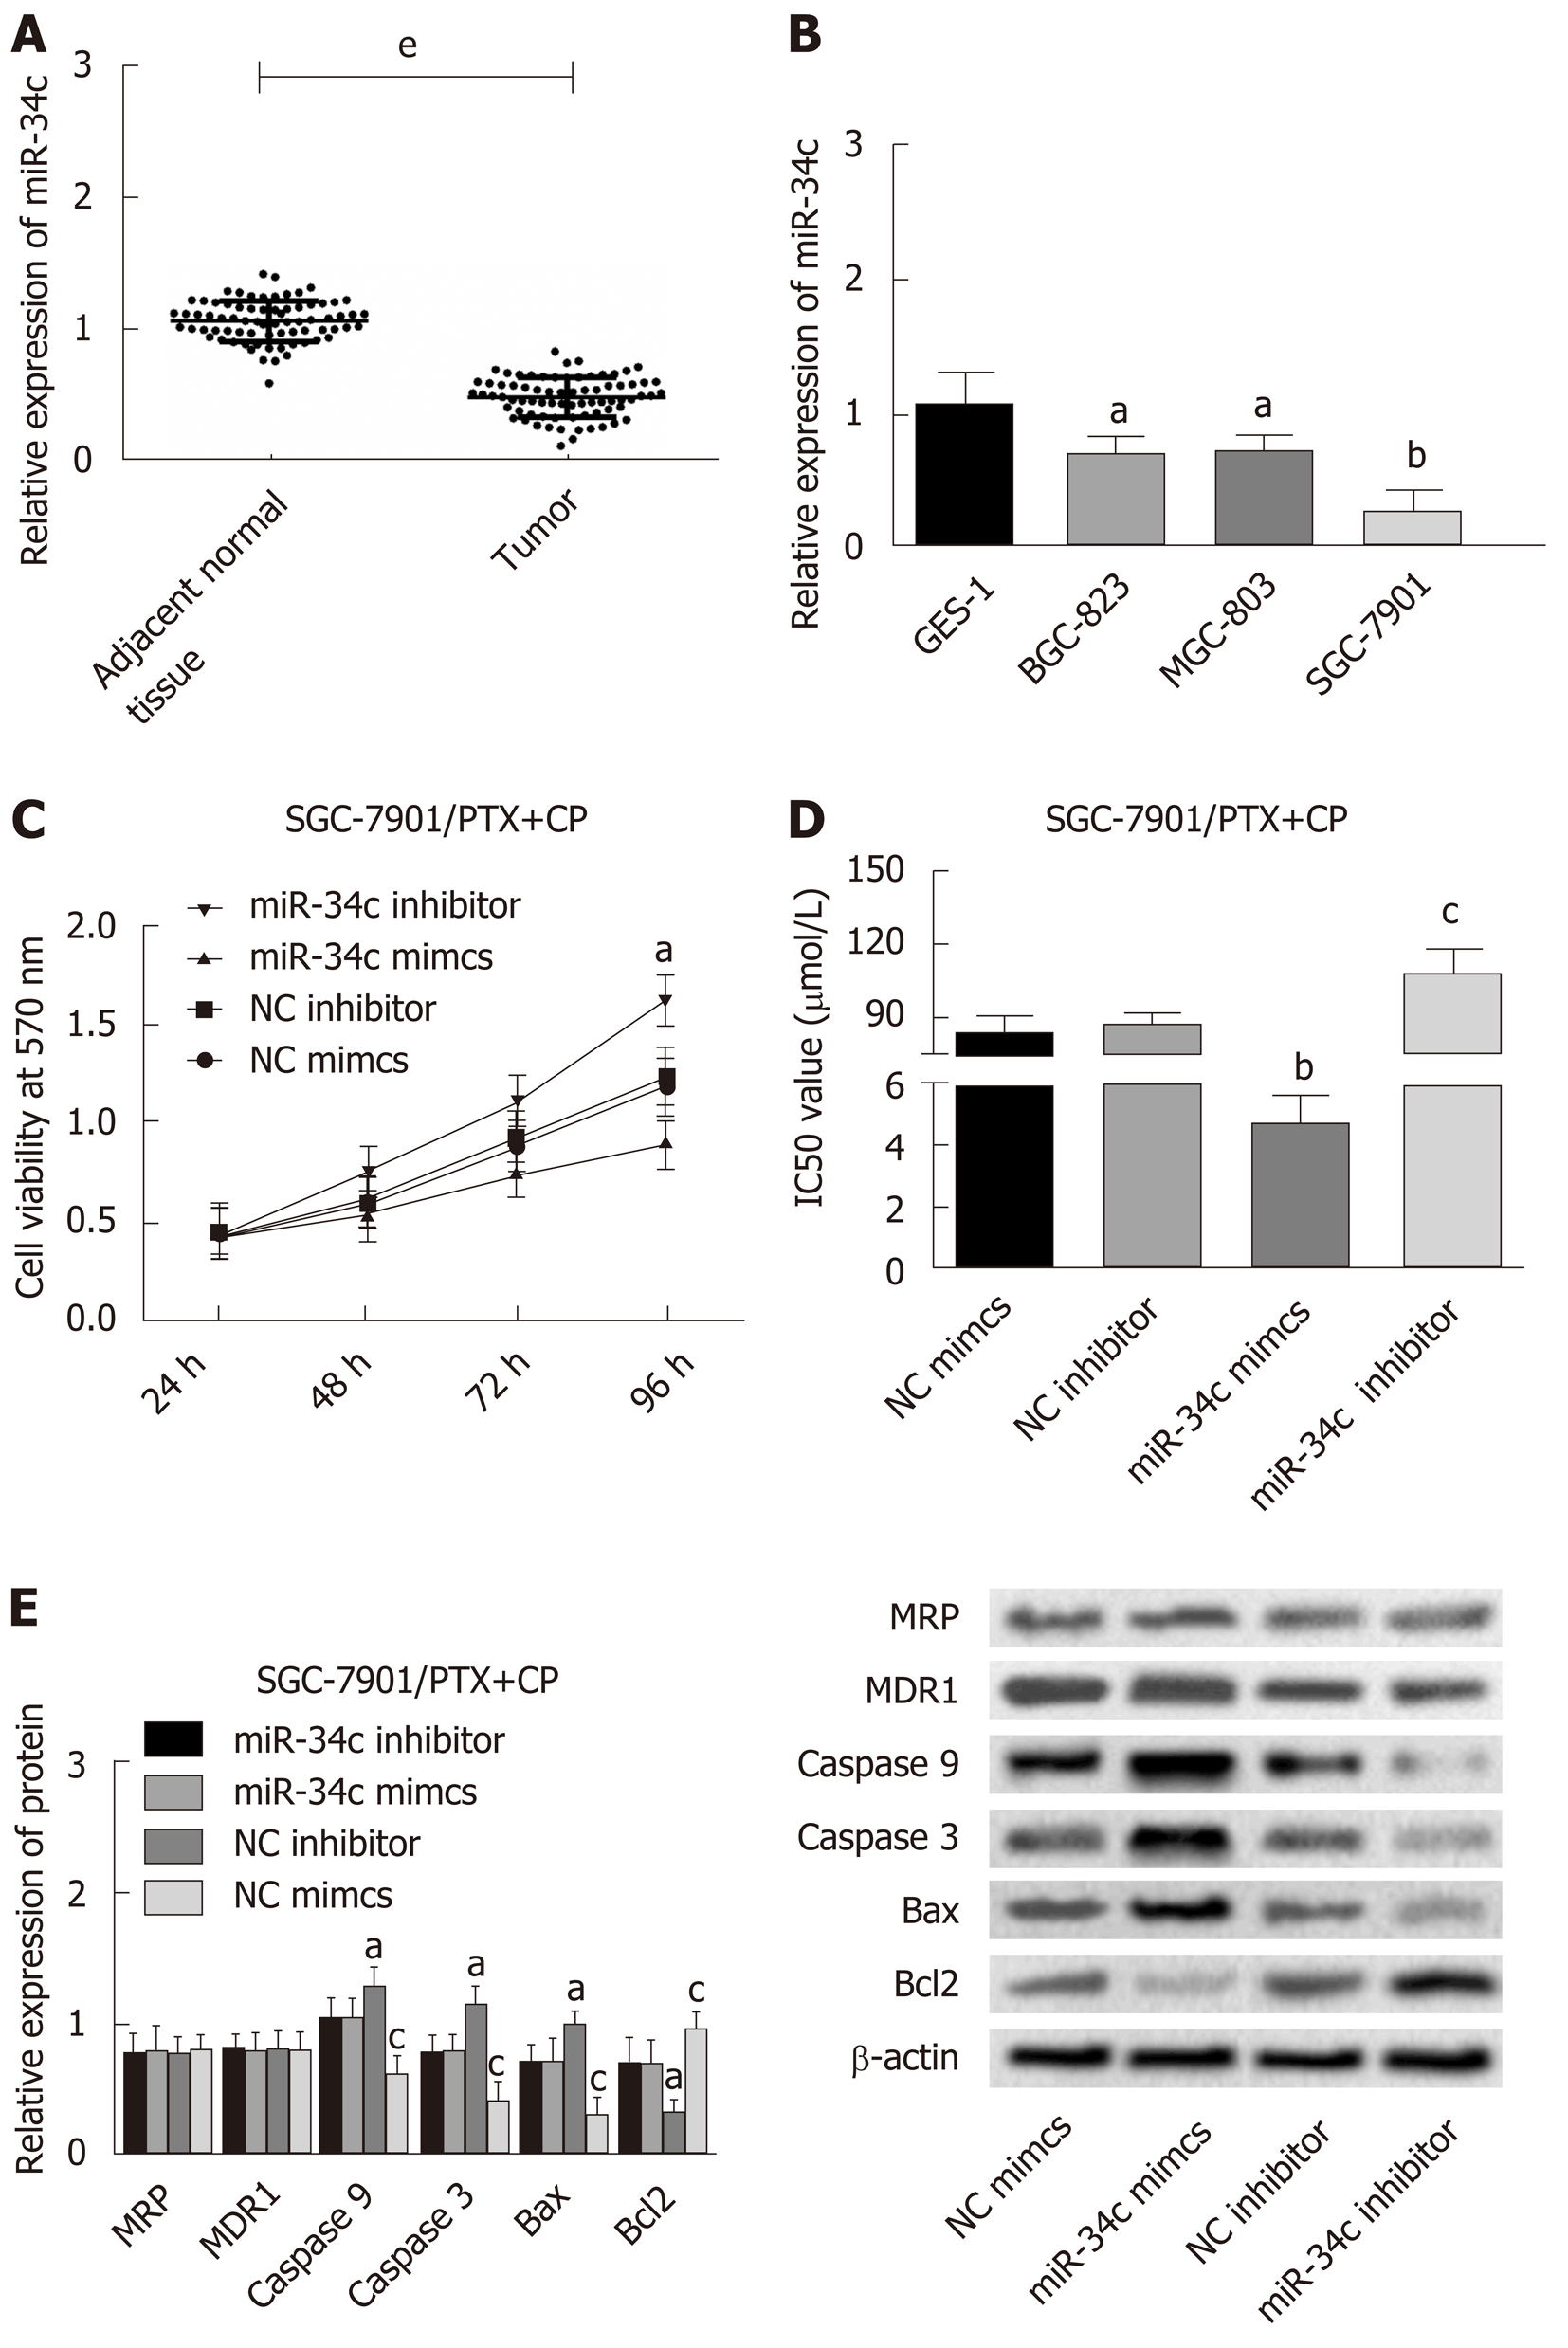
Figure 4 microRNA-34c inhibits drug resistance and the activity of gastric cancer cells.
A: miR-34c was underexpressed in GC tissues. eP < 0.001 vs adjacent normal tissues; B: miR-34c was underexpressed in cancer cells. aP < 0.05 and bP < 0.01 vs GES-1 cells; C: miR-34c inhibited cell activity. aP < 0.05 in multi-group comparisons; D: miR-34c inhibited cell resistance. bP < 0.01 vs the NC mimics group and cP < 0.05 vs the NC inhibitor group; E: miR-34c inhibited the expression of Bcl2 and promoted the expression levels of Caspase 9, Caspase 3 and Bax. aP < 0.05 vs the NC mimc group and cP < 0.05 vs the NC inhibitor group.
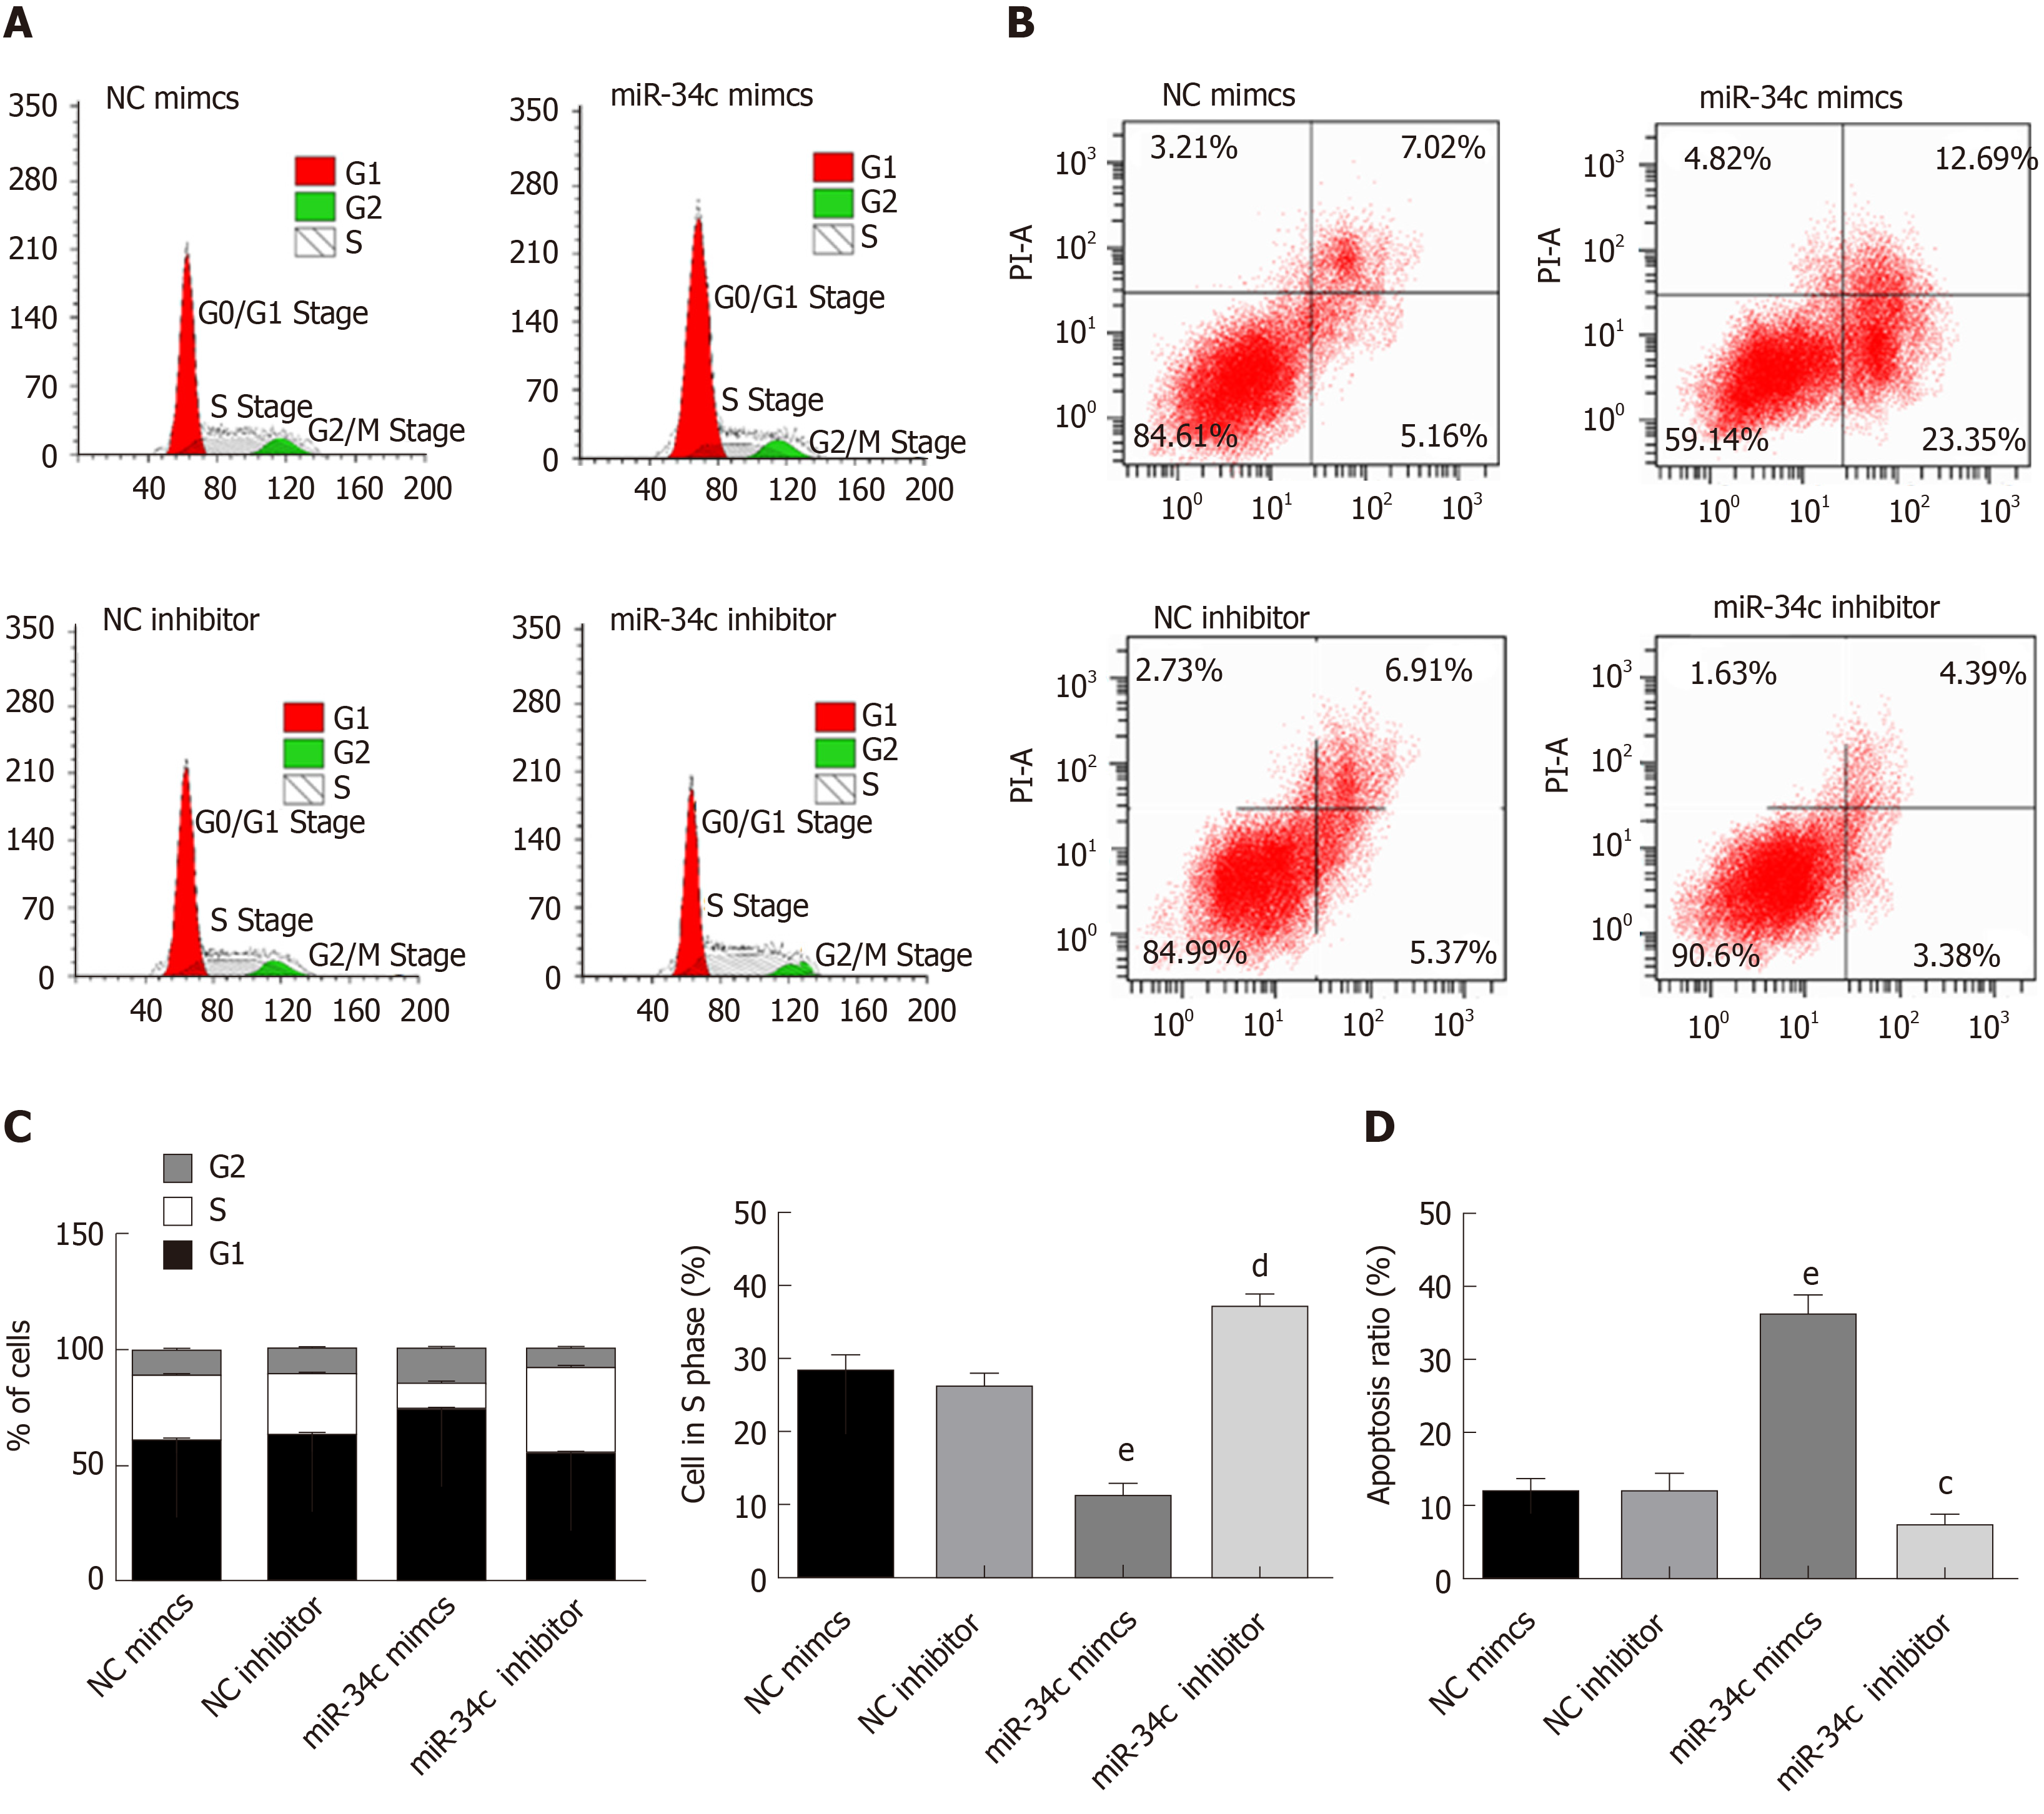
Figure 5 microRNA-34c promotes cell apoptosis and inhibits cell proliferation.
A: Flow cytometry analysis for cell cycle of each group; B: Flow cytometry analysis for cell apoptosis of each group; C: E2F1 promoted S-phase cell proliferation. eP < 0.001 vs the NC sh group, and dP < 0.01 vs the NC si group; D: E2F1 inhibited cell apoptosis. eP < 0.001 vs the NC sh group and cP < 0.05 vs the NC si group.
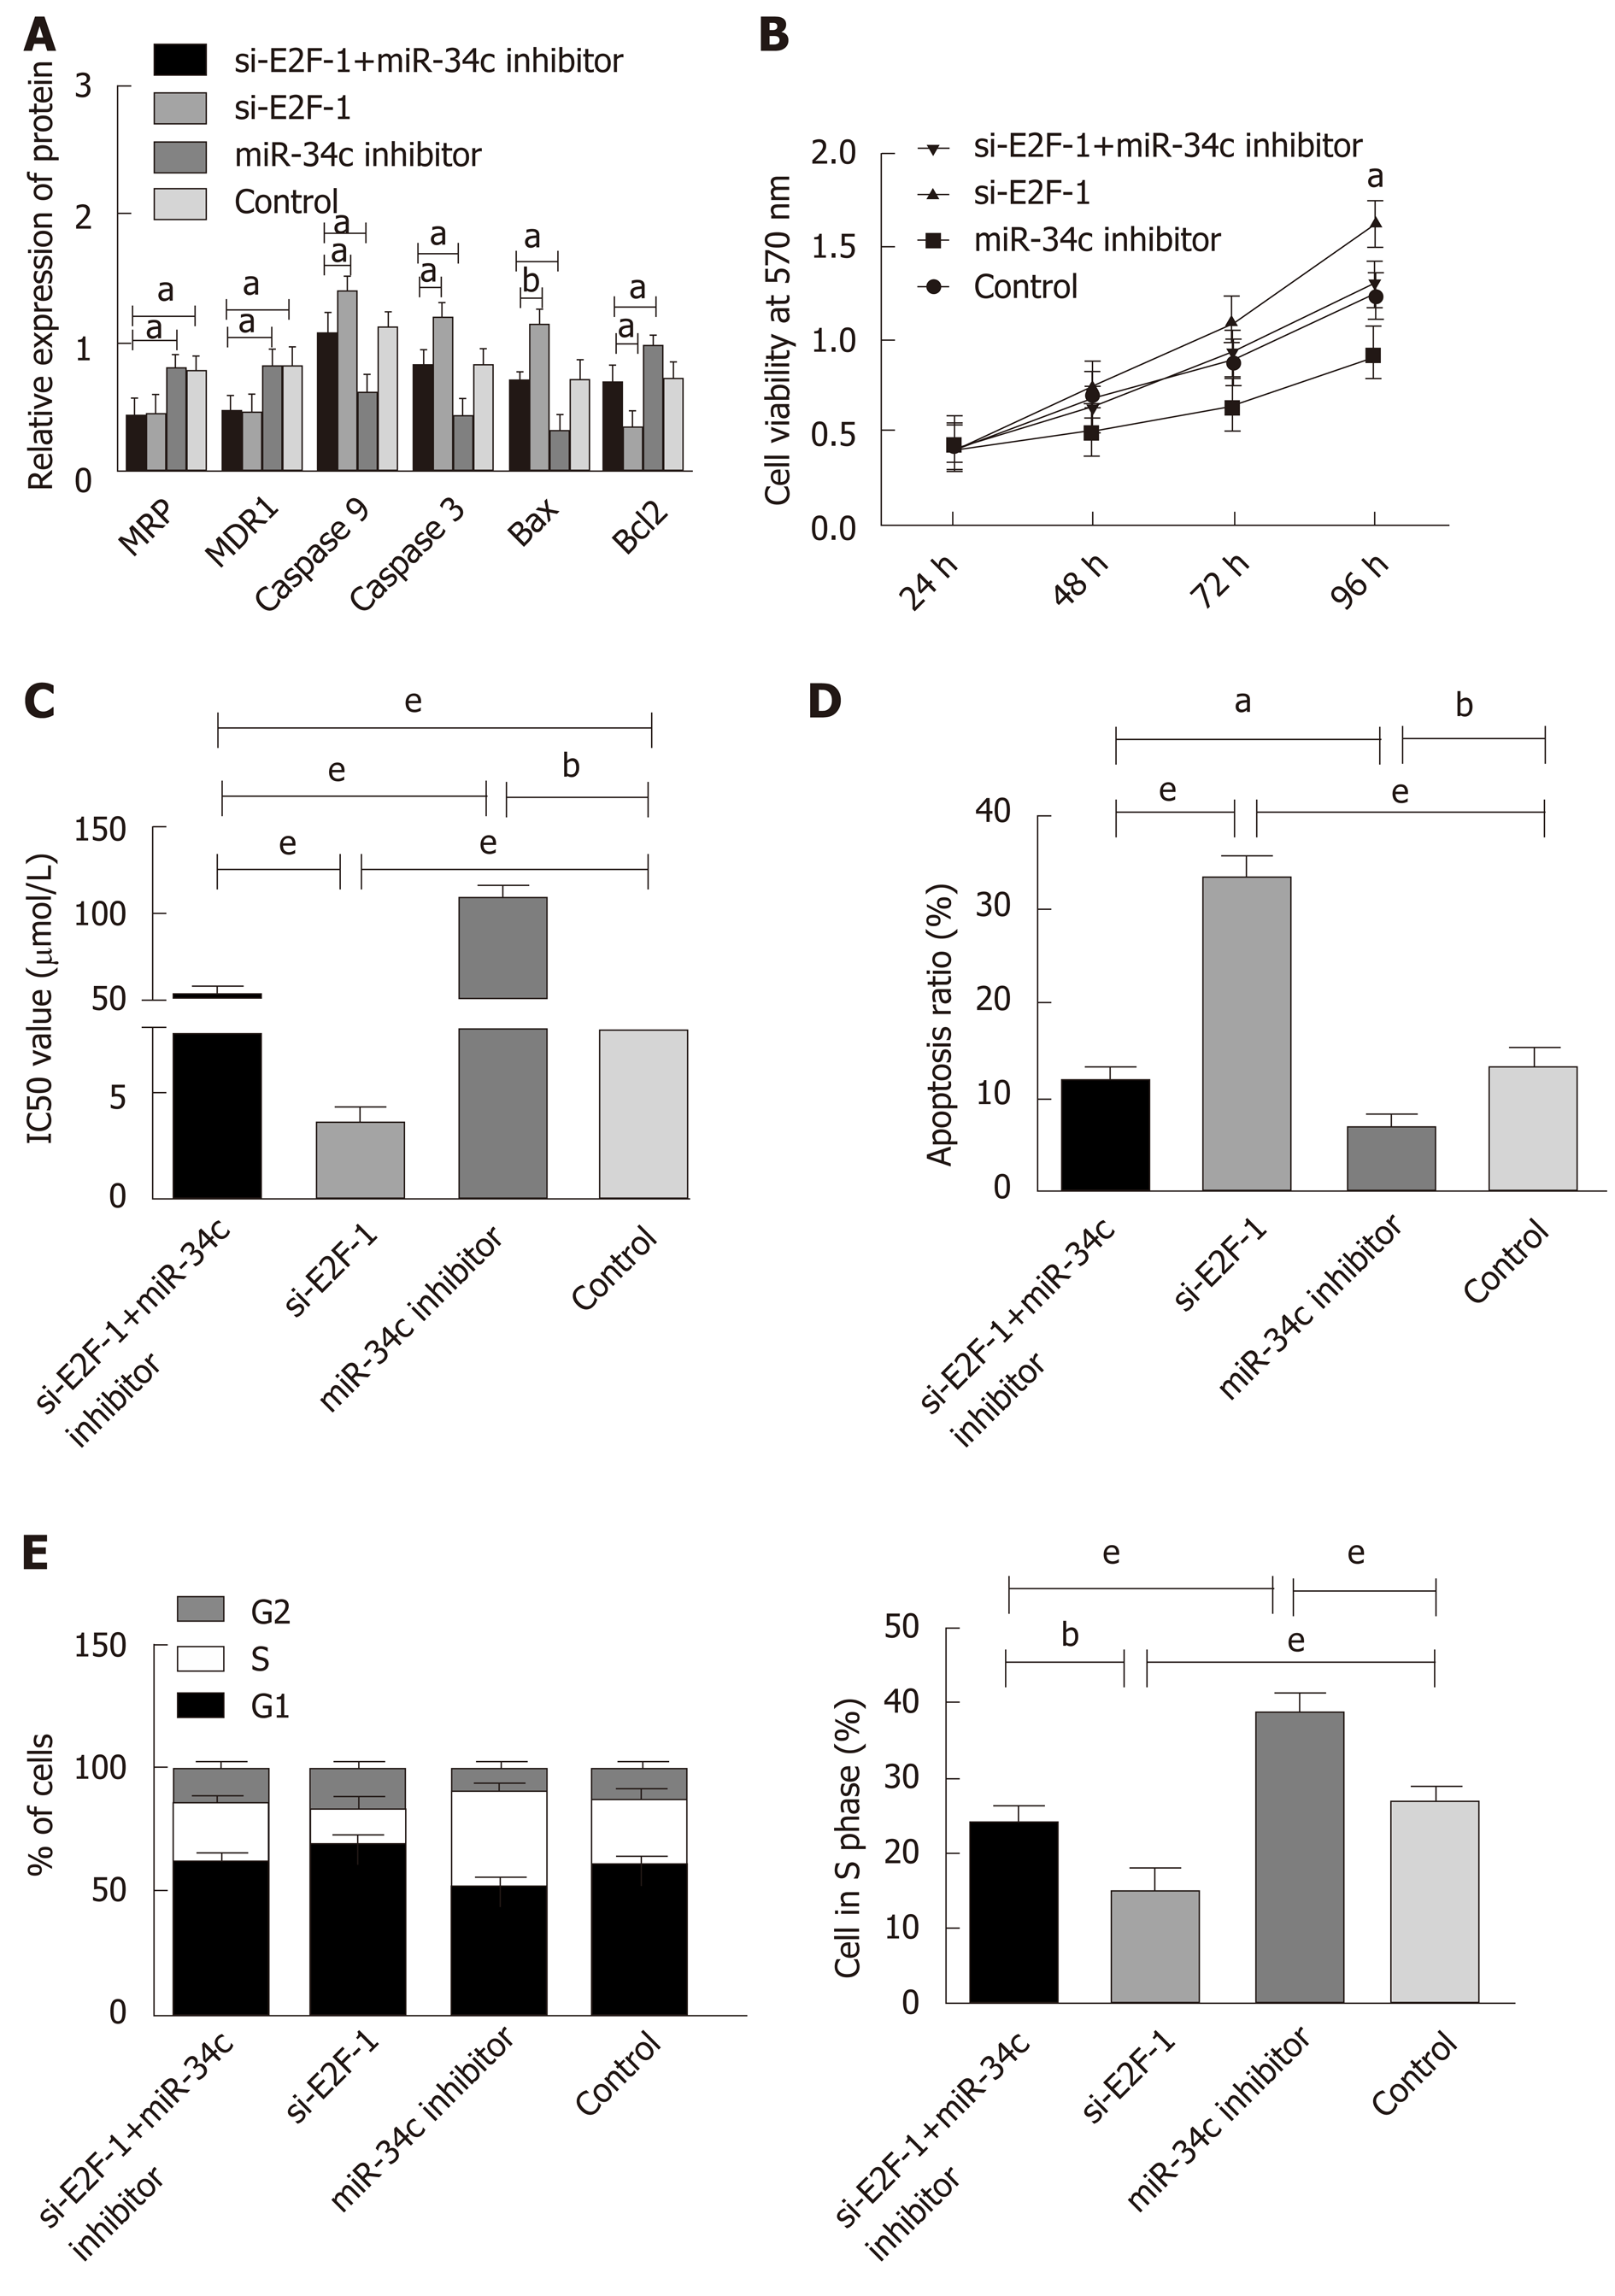
Figure 6 Rescue experiment.
A: miR-34c inhibitor could counteract the effect of si E2F1 on related proteins. aP < 0.05, and bP < 0.01; B: miR-34c inhibitor could offset the inhibitory effect of si E2F1 on cell activity. aP < 0.05 vs other groups; C: miR-34c inhibitor neutralized the sensitization effect of si-E2FL on cell resistance. bP < 0.01, and eP < 0.001; D: miR-34c inhibitor inhibited the effect of si-E2FL on apoptosis. aP < 0.05, bP < 0.01, and eP < 0.001; E: miR-34c inhibitor inhibited the inhibitory effect of si-E2FL on S-phase cells. bP < 0.01 and eP < 0.001.
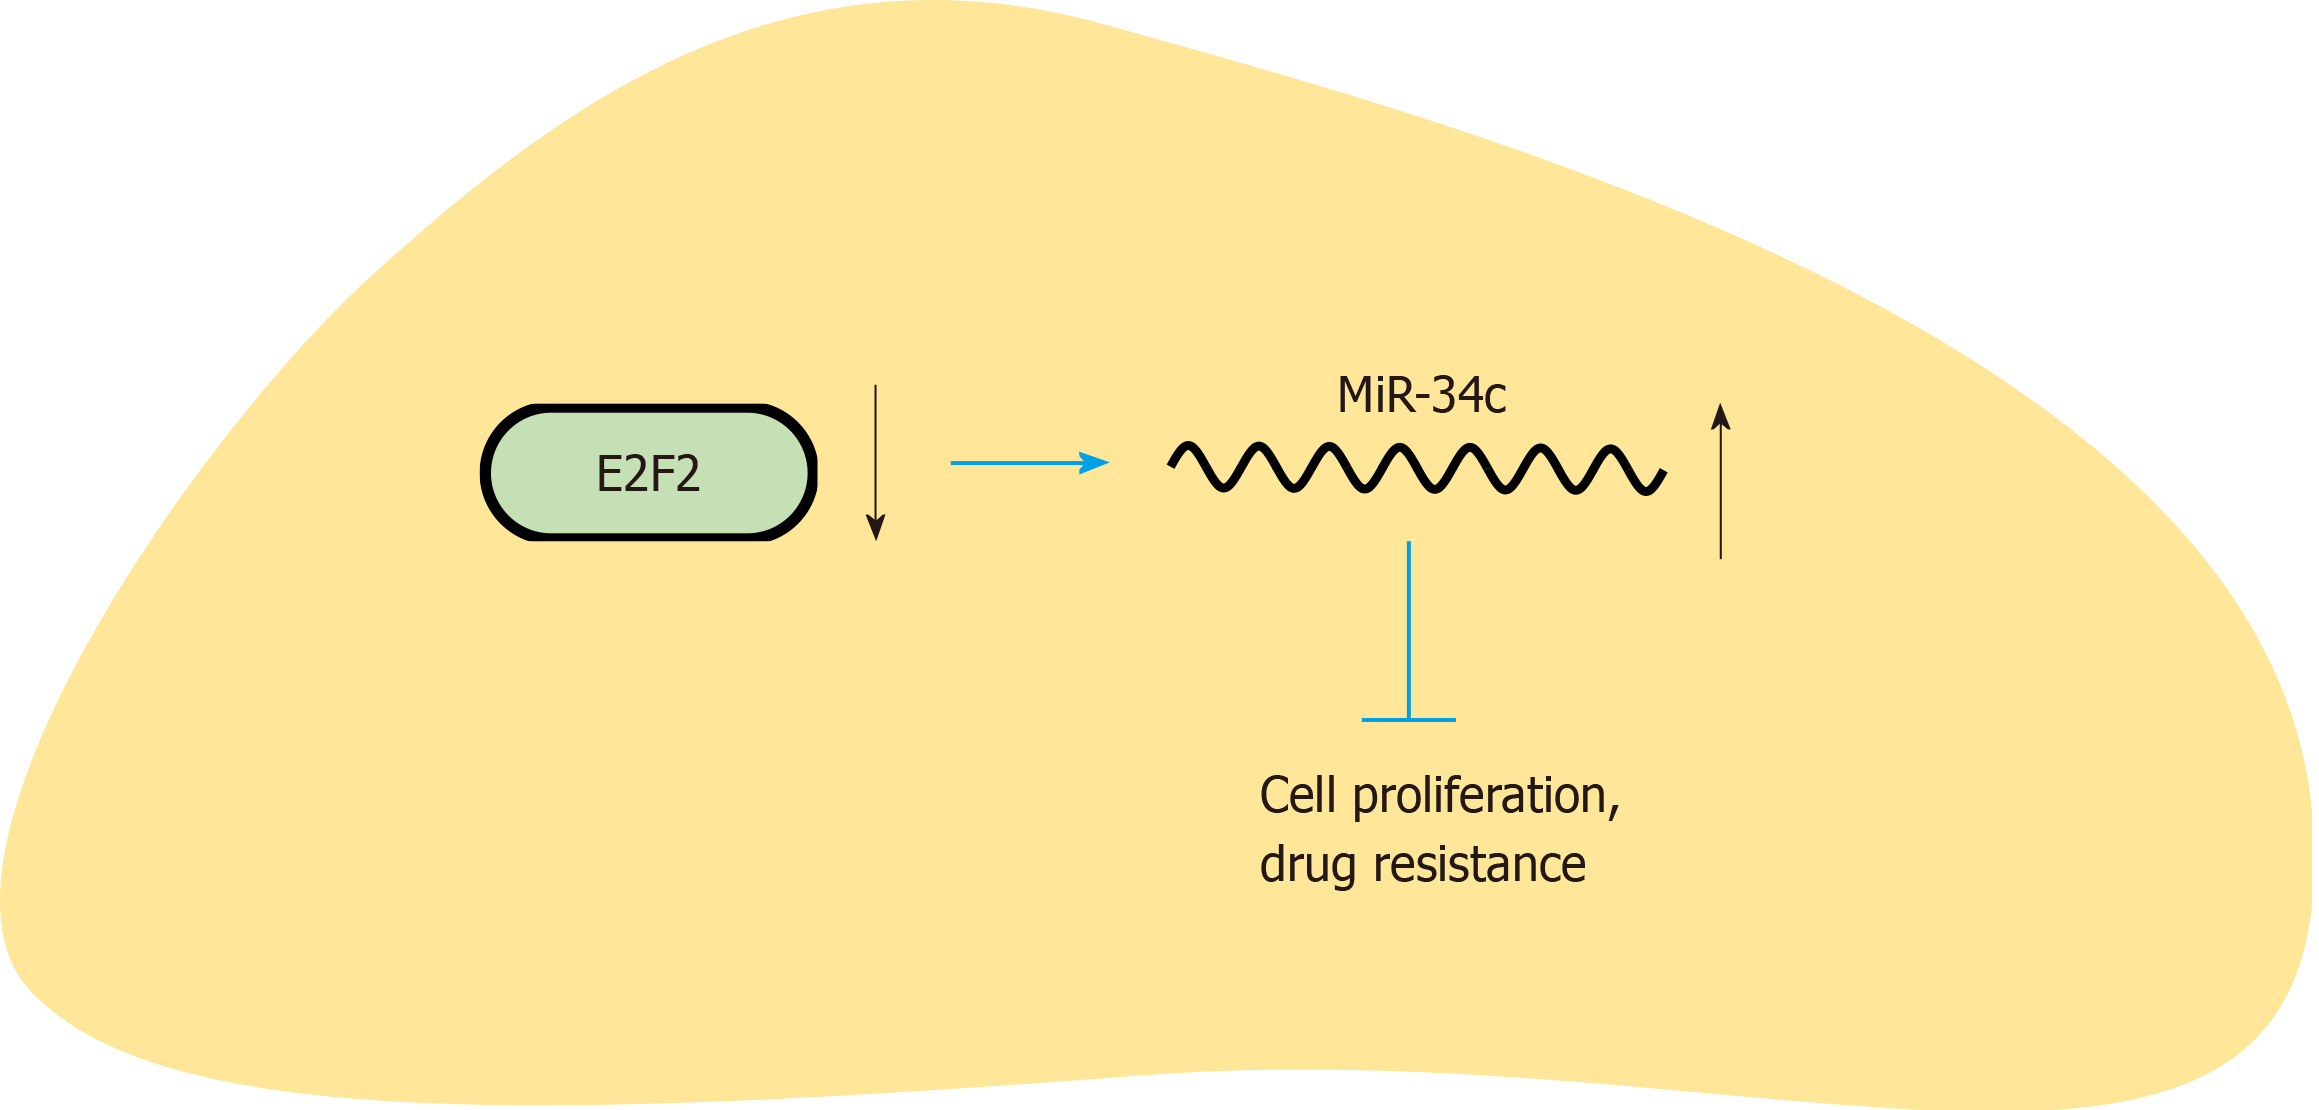
Figure 7 The function of the E2F transcription factor 1/ microRNA 34c axis on gastric cancer cells.
As illustrated in this figure, slicing E2F1 inhibits cell proliferation and drug resistance via upregulating miR-34c.
- Citation: Zheng H, Wang JJ, Yang XR, Yu YL. Upregulation of miR-34c after silencing E2F transcription factor 1 inhibits paclitaxel combined with cisplatin resistance in gastric cancer cells. World J Gastroenterol 2020; 26(5): 499-513
- URL: https://www.wjgnet.com/1007-9327/full/v26/i5/499.htm
- DOI: https://dx.doi.org/10.3748/wjg.v26.i5.499


