Copyright
©The Author(s) 2020.
World J Gastroenterol. Dec 7, 2020; 26(45): 7204-7221
Published online Dec 7, 2020. doi: 10.3748/wjg.v26.i45.7204
Published online Dec 7, 2020. doi: 10.3748/wjg.v26.i45.7204
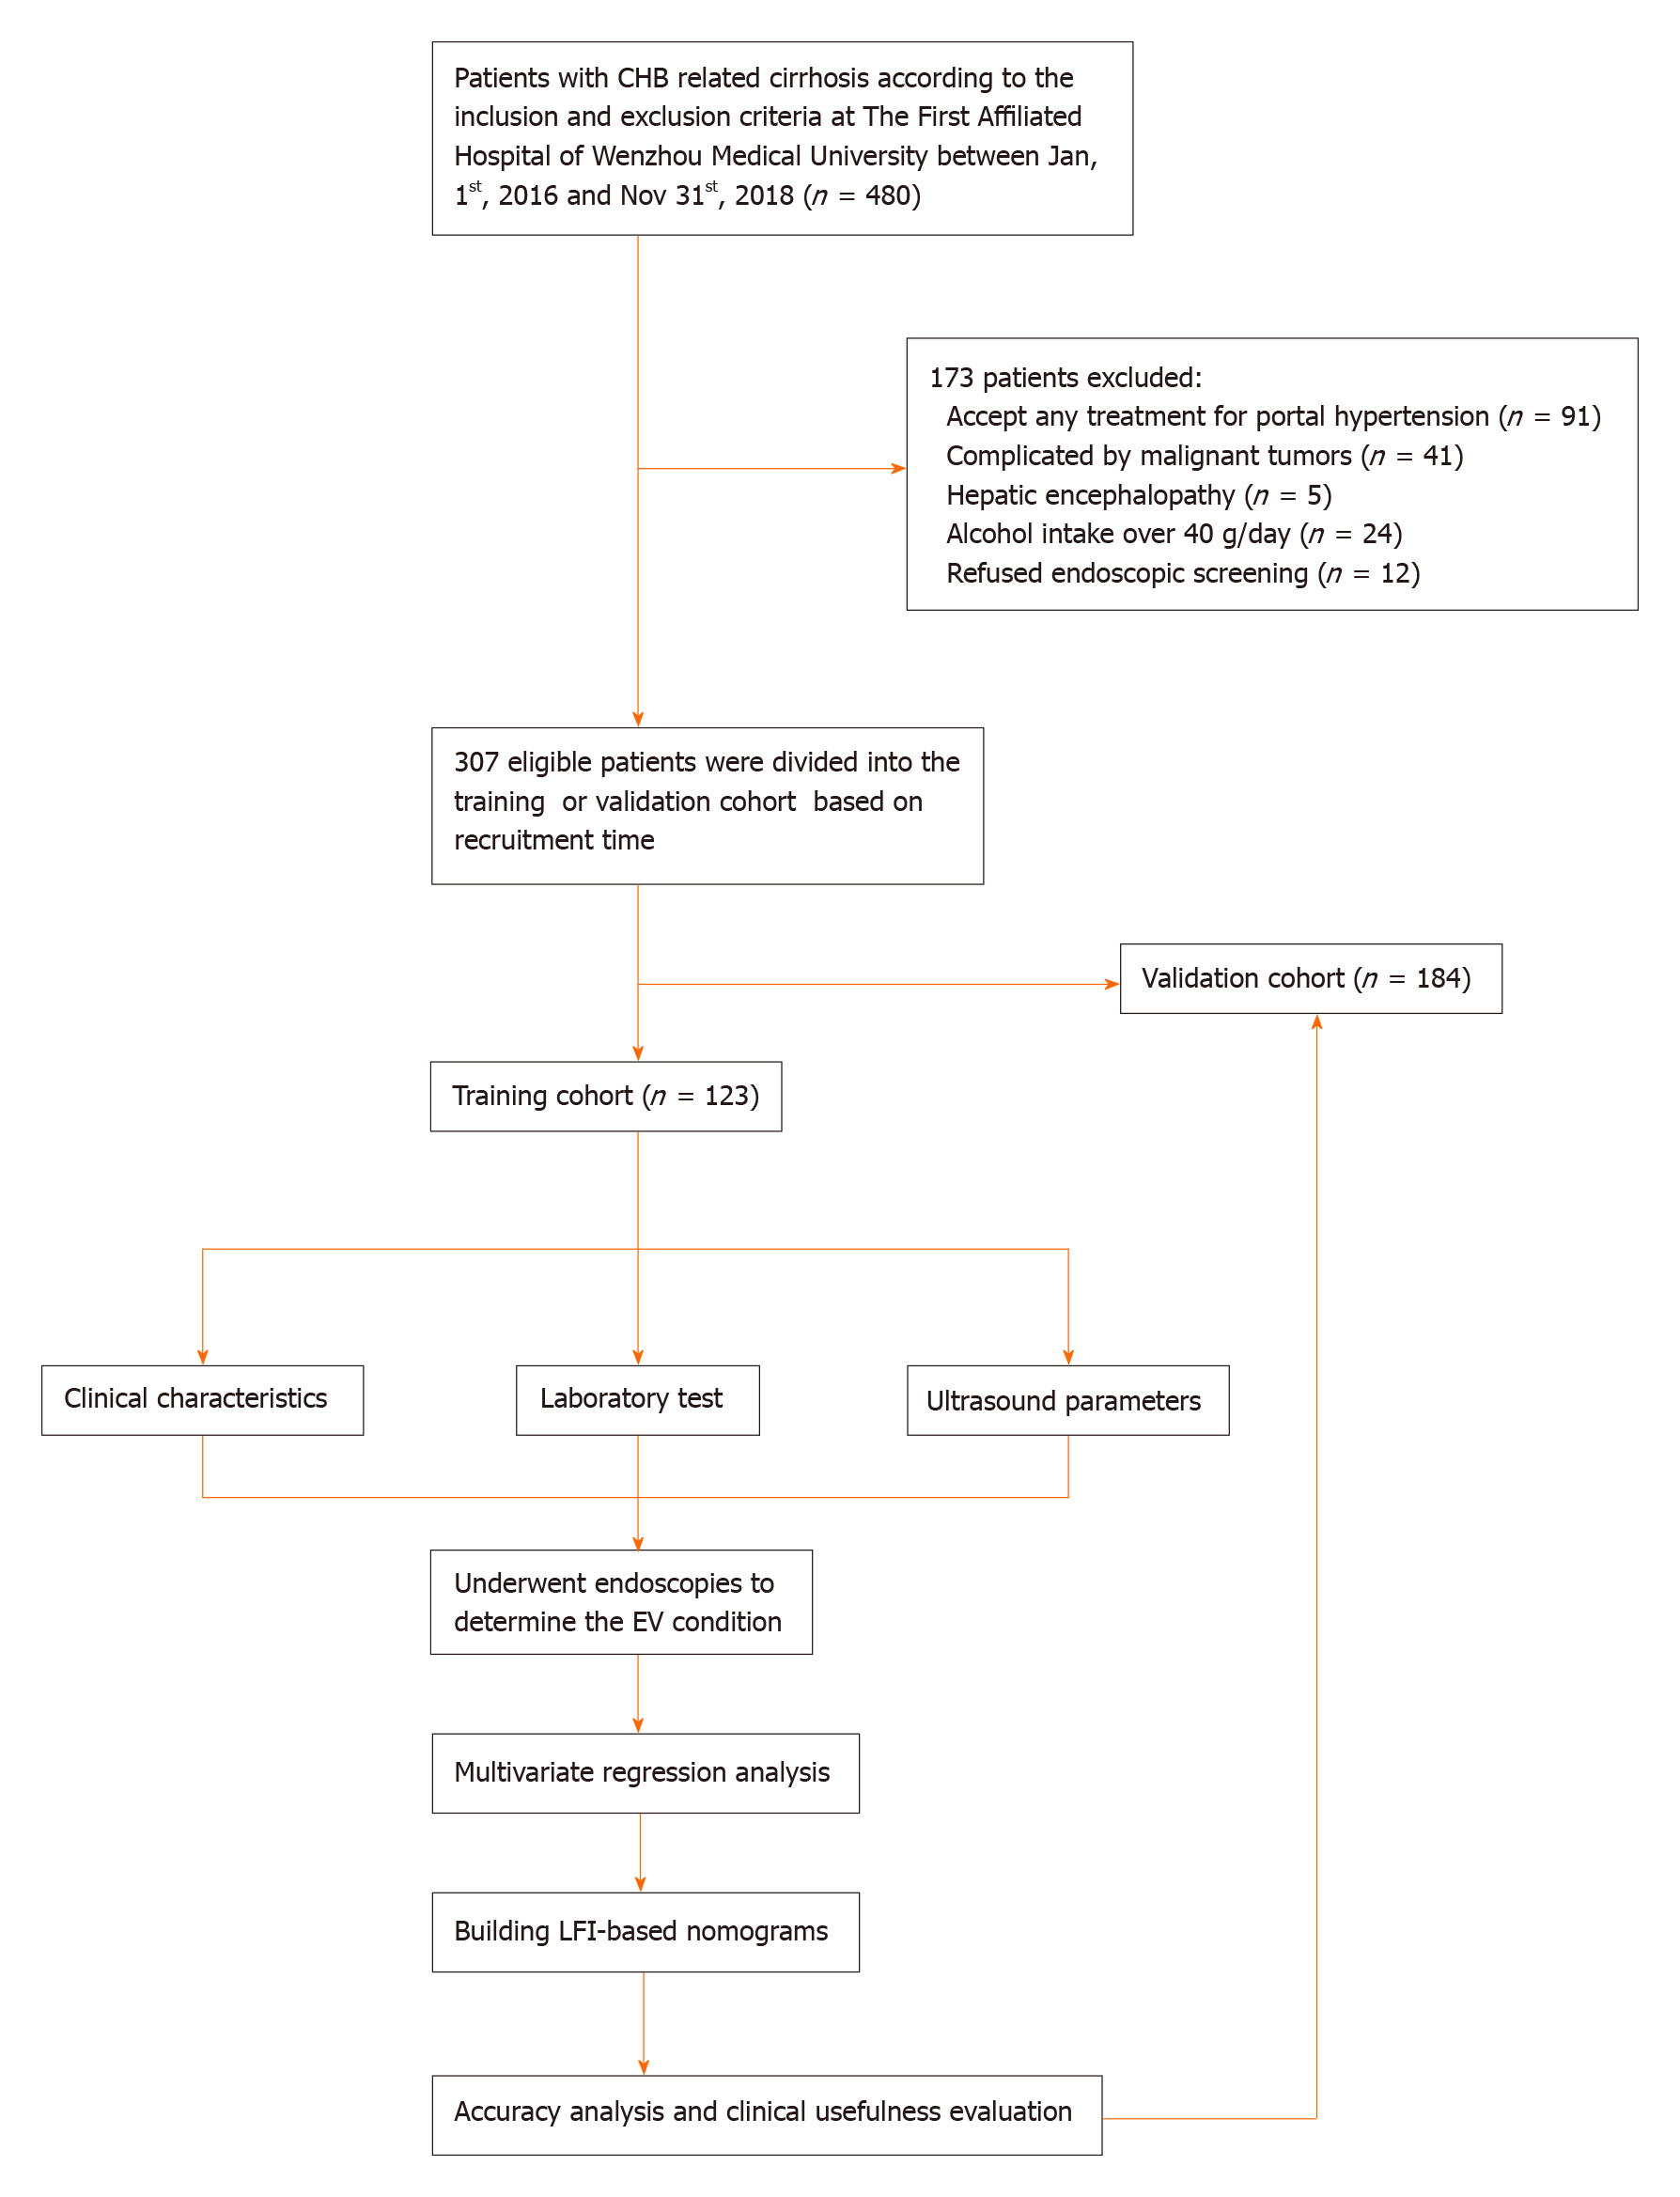
Figure 1 Study workflow.
CHB: Chronic hepatitis B; EV: Esophageal varices; LFI: Liver fibrosis index.
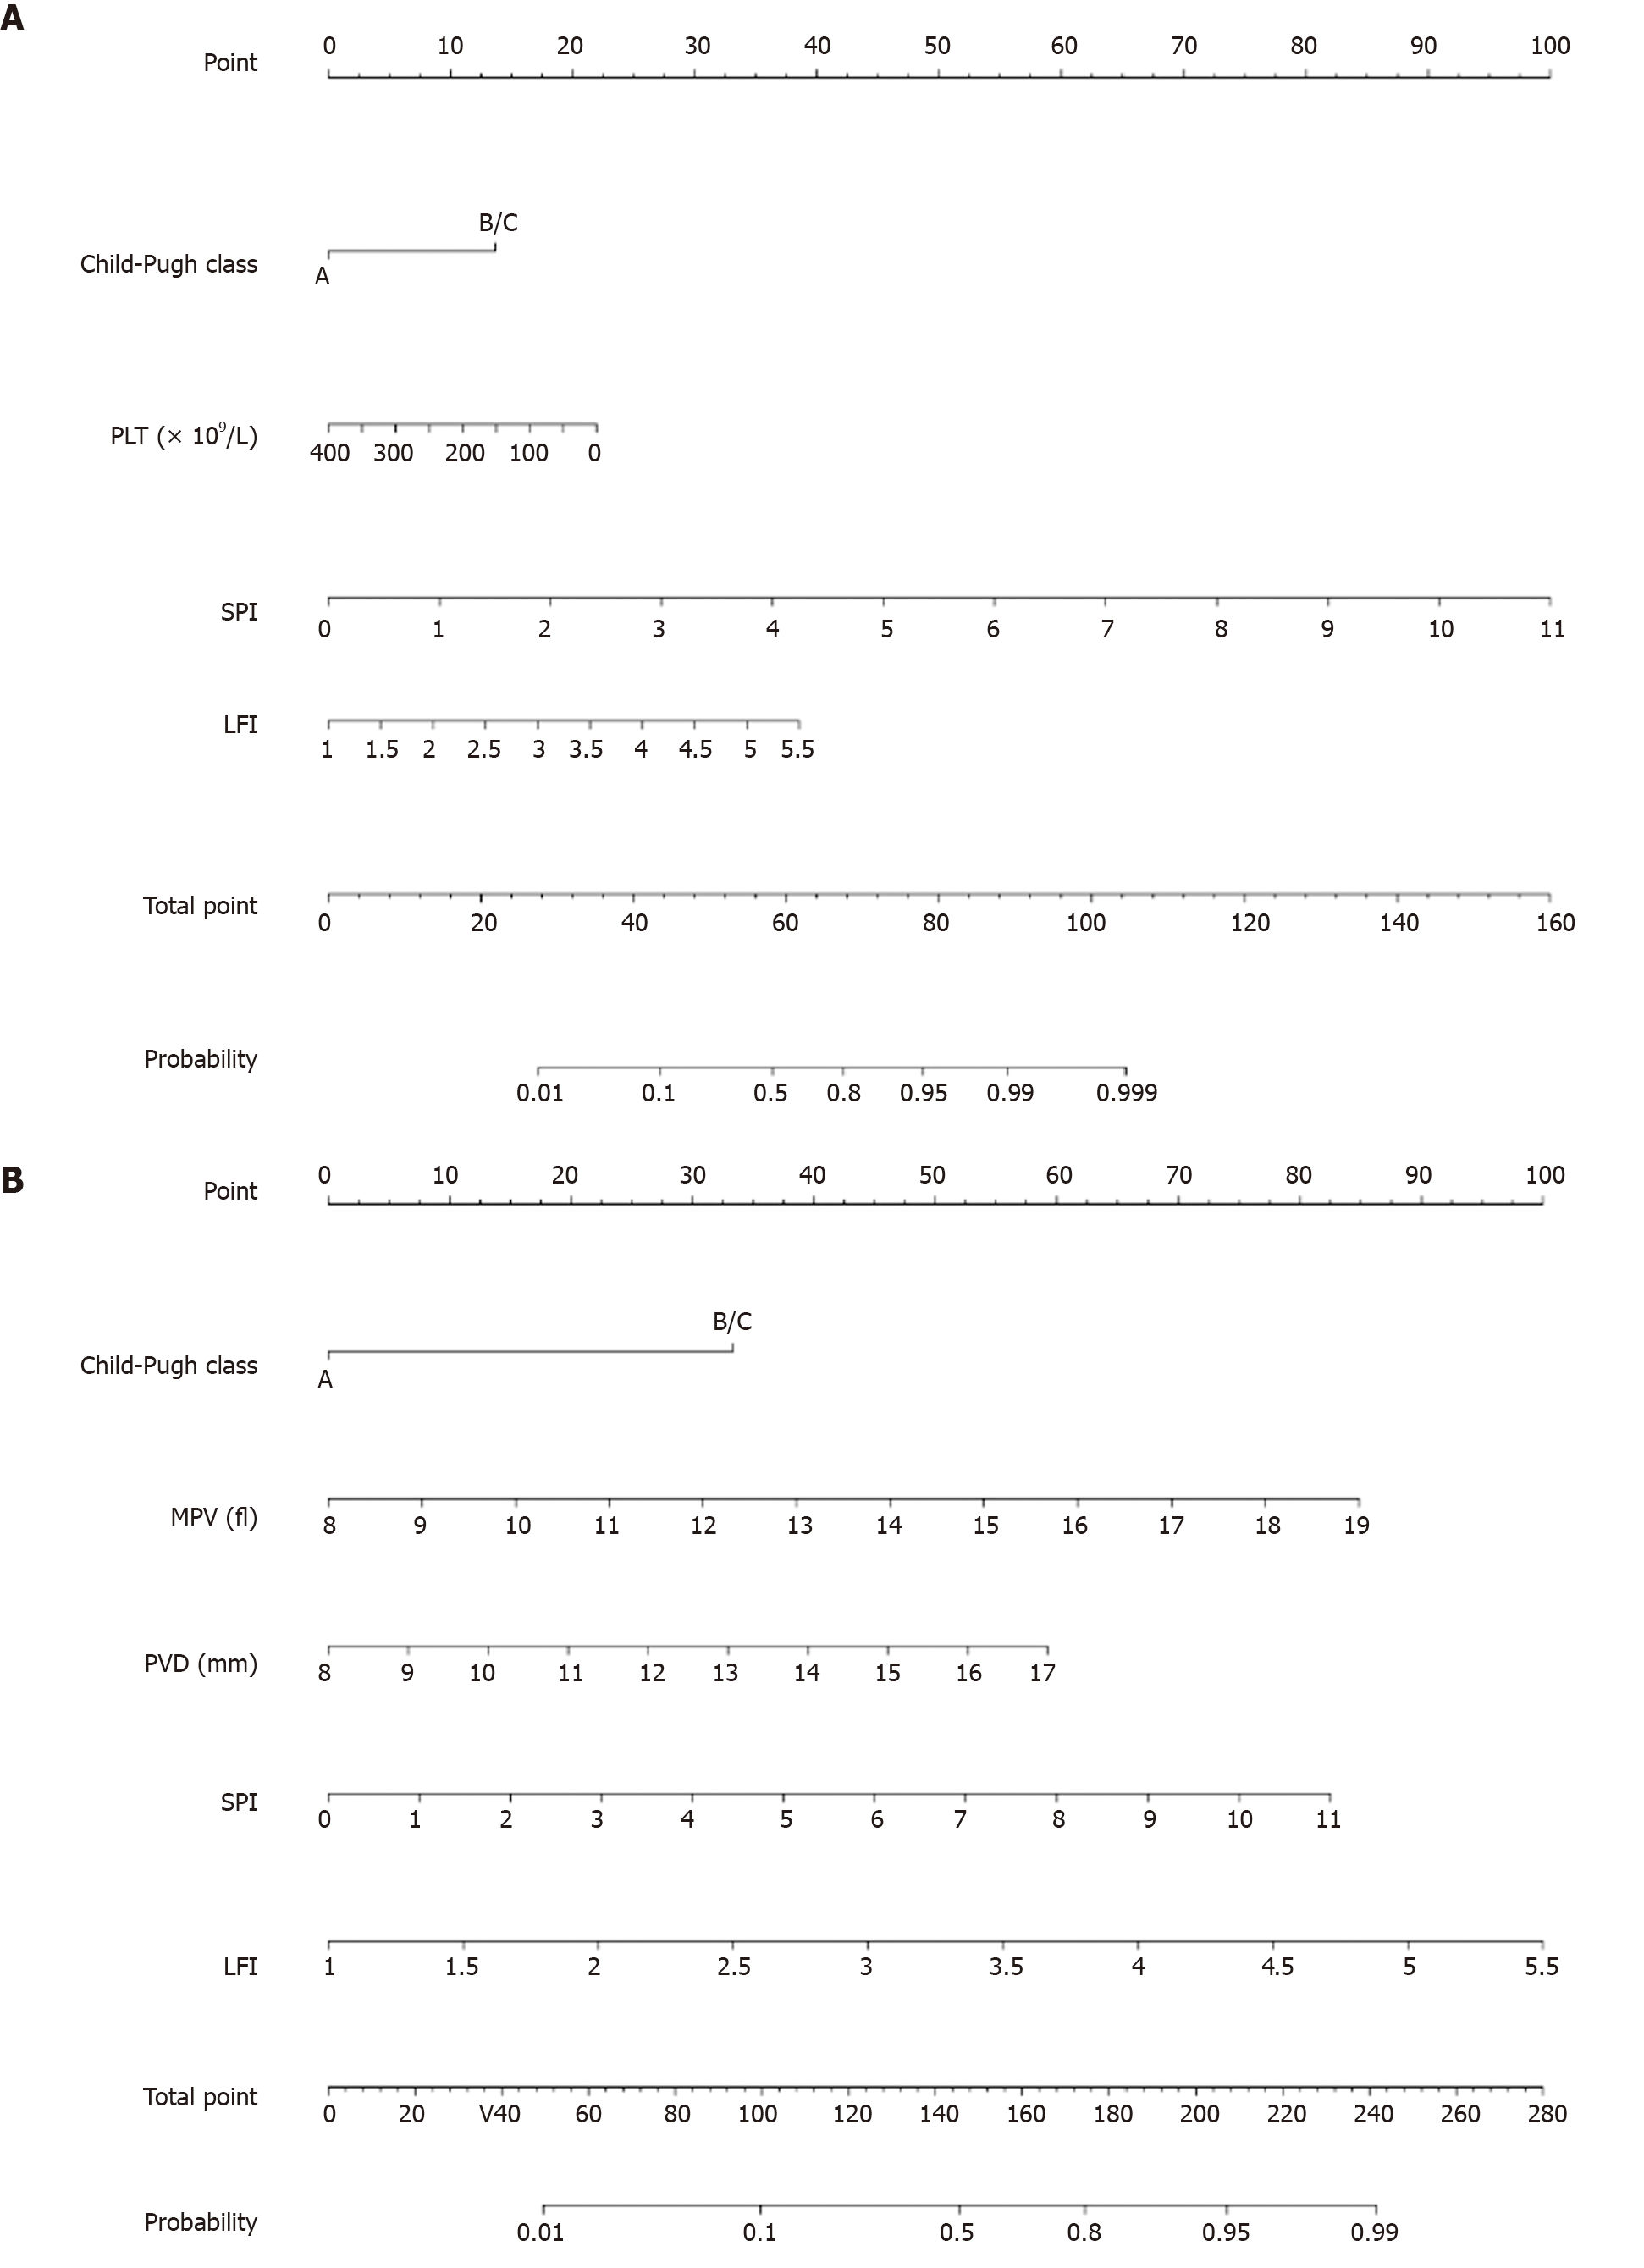
Figure 2 Nomograms for predicting the risk and severity of esophageal varices in patients with chronic hepatitis B related cirrhosis.
A: Nomogram for predicting esophageal varices (EV) risk; B: Nomogram for predicting EV severity. PLT: Platelet count; SPI: Splenic portal index; LFI: Liver fibrosis index; MPV: Mean platelet volume; PVD: Portal vein diameter.
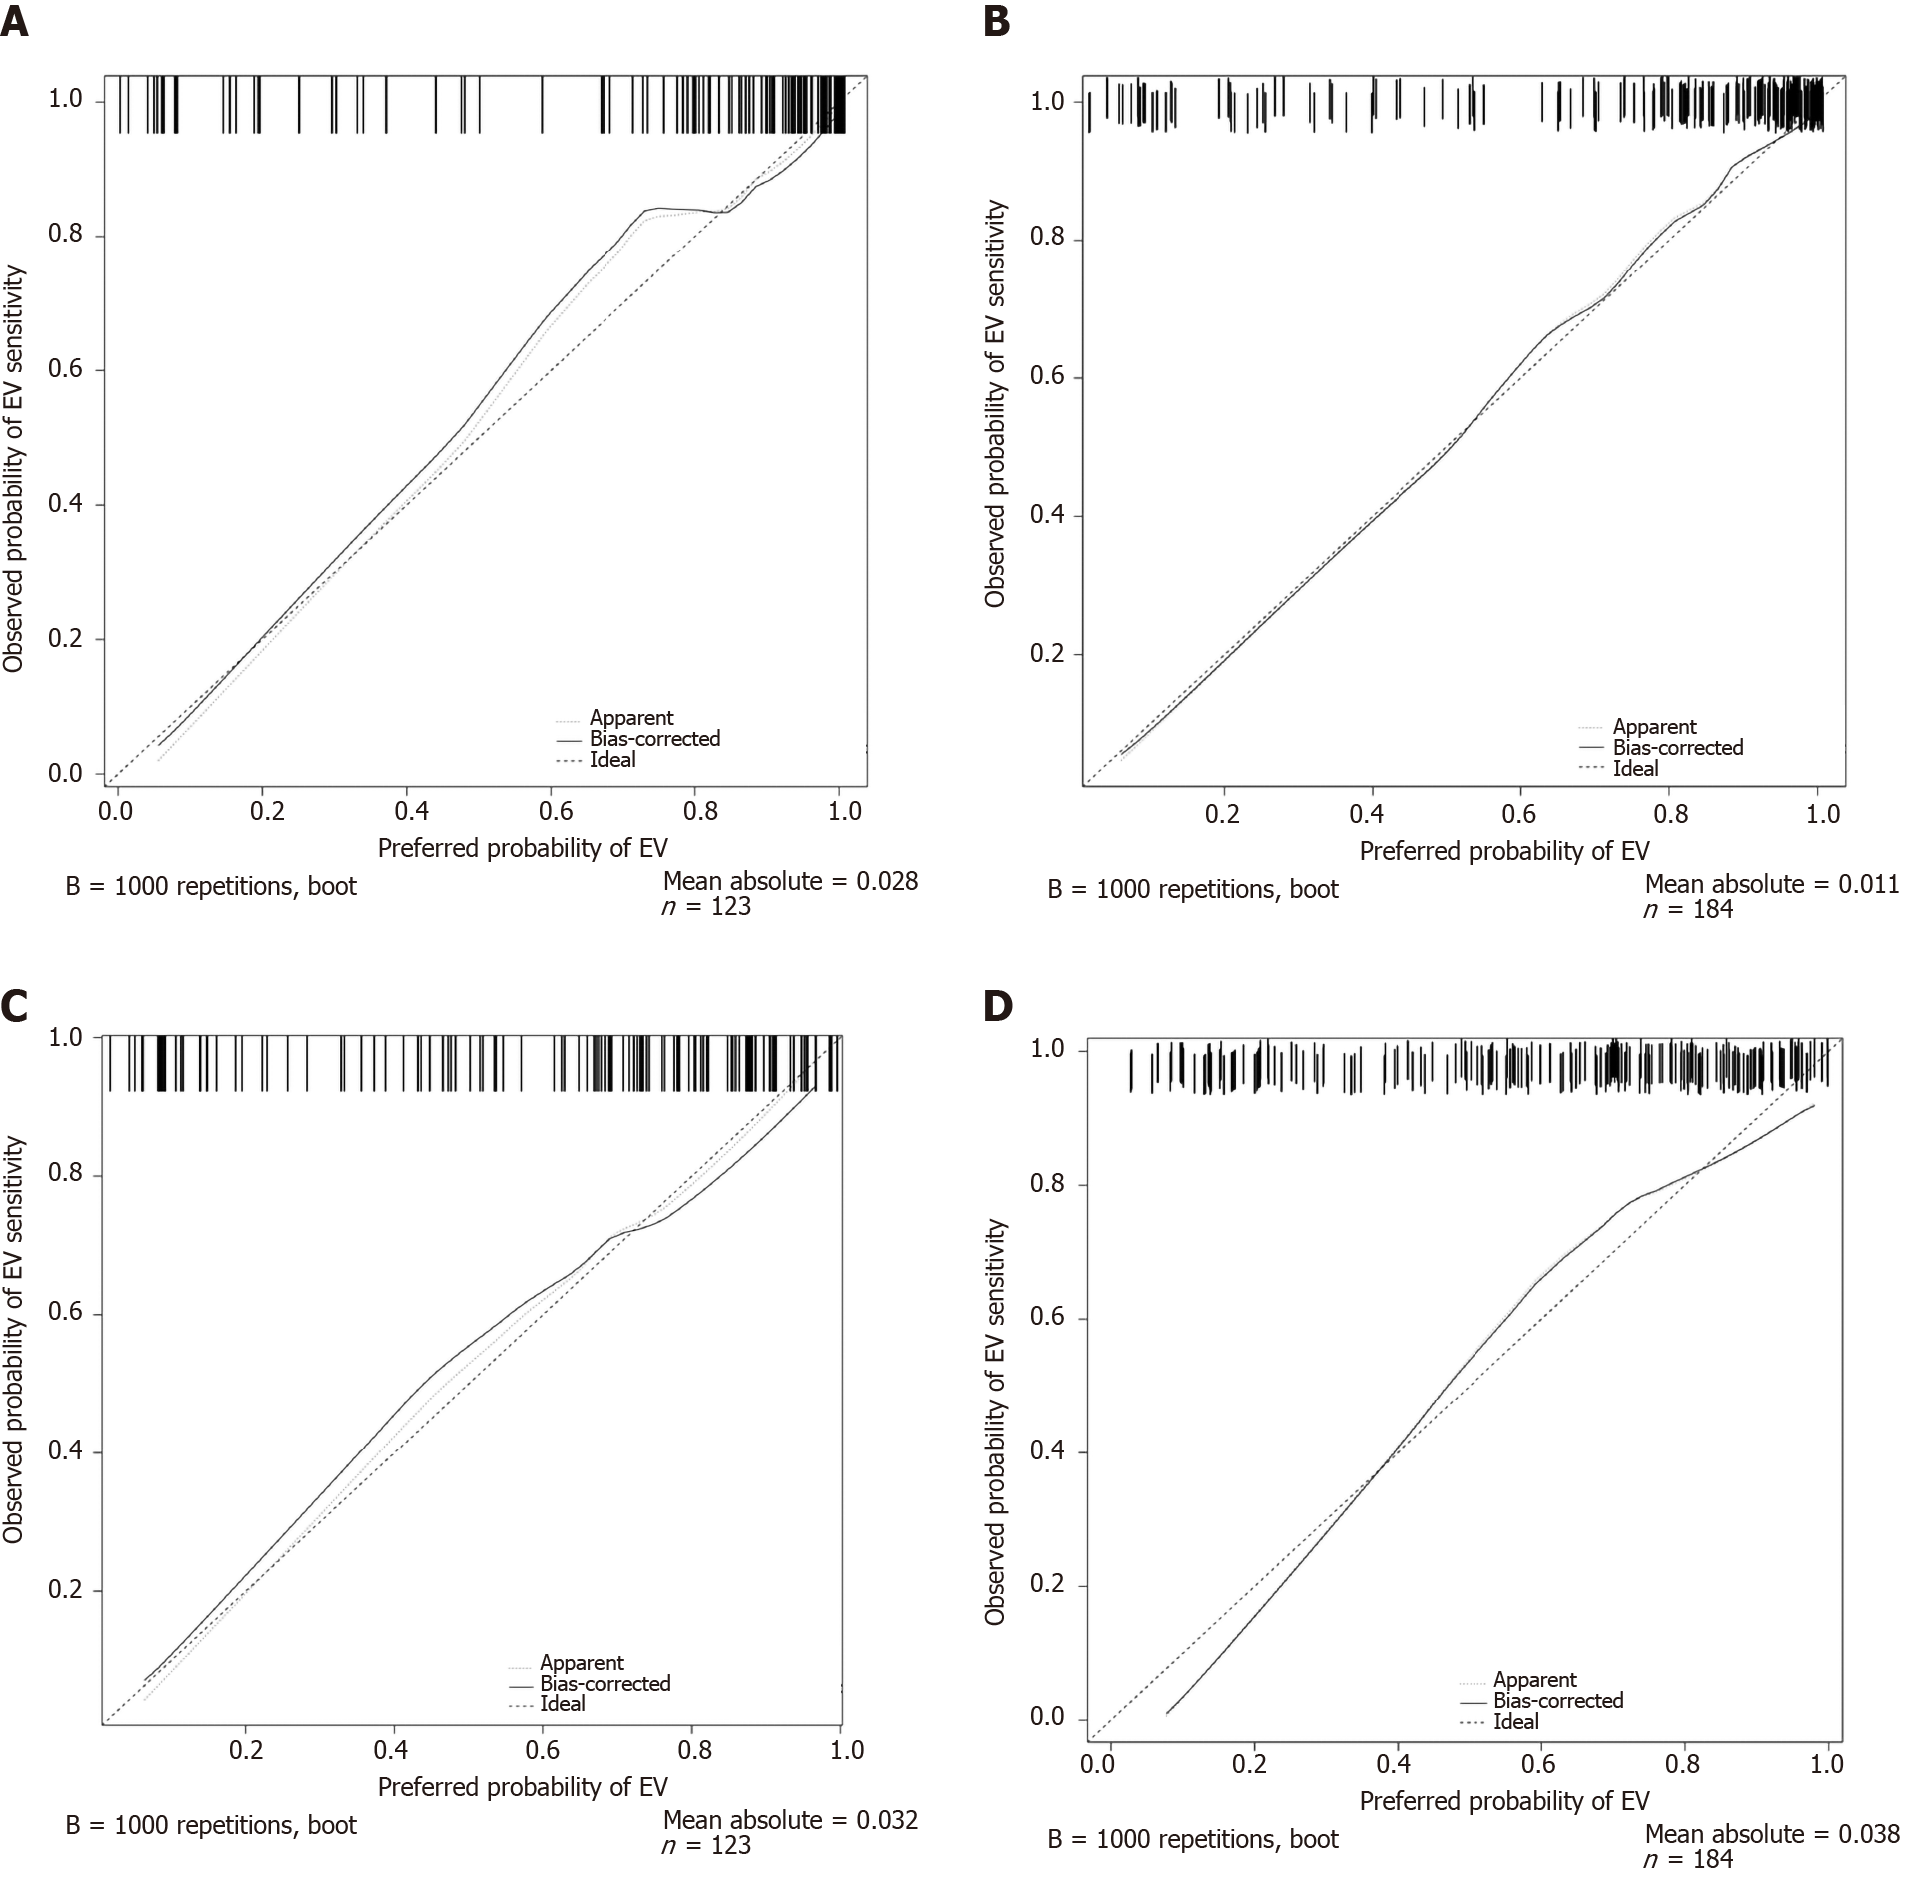
Figure 3 Calibration plots.
A: The calibration curve of nomogram for esophageal varices (EV) risk in the training cohort; B: The calibration curve of nomogram for EV risk in the validation cohort; C: The calibration curve of nomogram for EV severity in the training cohort; D: The calibration curve of nomogram for EV severity in the validation cohort. EV: Esophageal varices.
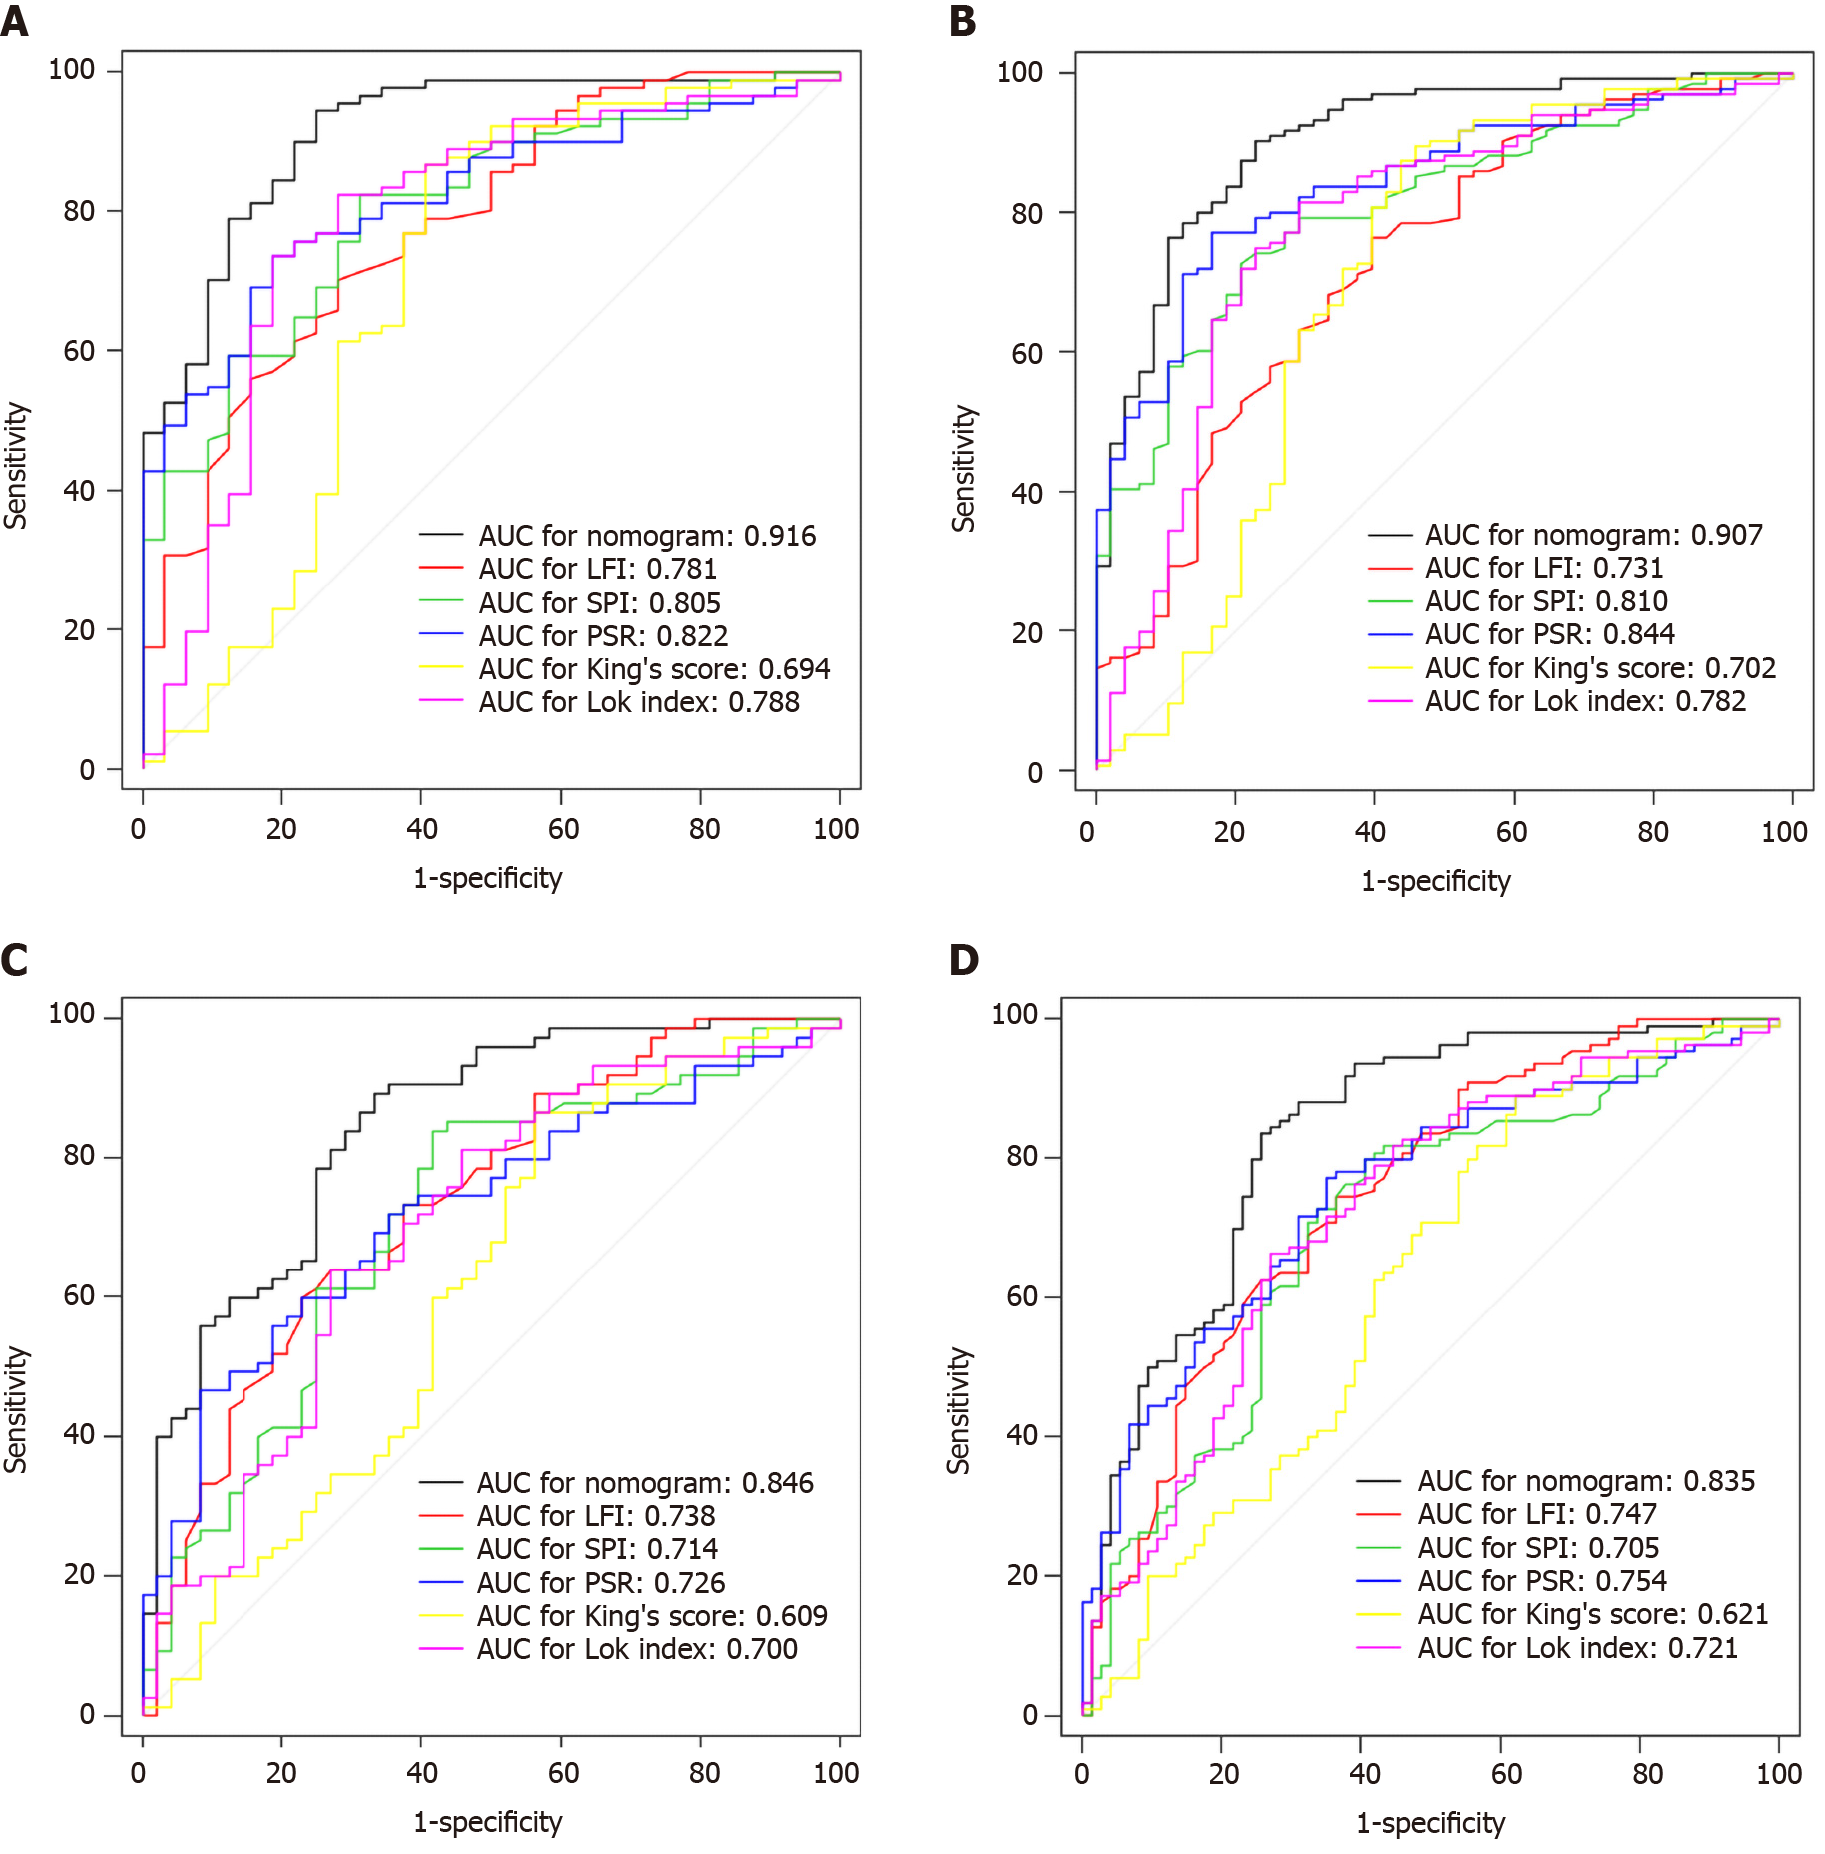
Figure 4 The areas under the curves of the nomograms, liver fibrosis index, splenic portal index, ratio of platelet count to spleen diameter, King’s score, and Lok index to predict the risk or severity of esophageal varices in the training and validation cohorts.
A: The areas under the curves (AUCs) of esophageal varices (EV) risk prediction nomogram, liver fibrosis index (LFI), splenic portal index (SPI), ratio of platelet count to spleen diameter (PSR), King’s score, and Lok index in the training cohort; B: The AUCs of EV risk prediction nomogram, LFI, SPI, PSR, King’s score, and Lok index in the validation cohort; C: The AUCs of EV severity prediction nomogram, LFI, SPI, PSR, King’s score, and Lok index in the training cohort; D: The AUCs of EV severity prediction nomogram, LFI, SPI, PSR, King’s score, and Lok index in the validation cohort. AUC: Area under the curve; LFI: Liver fibrosis index; SPI: Splenic portal index; PSR: Ratio of platelet count to spleen diameter.
Figure 5 Decision curves of the nomograms, liver fibrosis index, splenic portal index, ratio of platelet count to spleen diameter, King’s score, and Lok index to predict the risk or severity of esophageal varices in the training and validation cohorts.
A: The decision curve of esophageal varices (EV) risk prediction nomogram, liver fibrosis index (LFI), splenic portal index (SPI), ratio of platelet count to spleen diameter (PSR), King’s score, and Lok index in the training cohort; B: The decision curve of EV risk prediction nomogram, LFI, SPI, PSR, King’s score, and Lok index in the validation cohort; C: The decision curve of EV severity prediction nomogram, LFI, SPI, PSR, King’s score, and Lok index in the training cohort; D: The decision curve of EV severity prediction nomogram, LFI, SPI, PSR, King’s score, and Lok index in the validation cohort. LFI: Liver fibrosis index; SPI: Splenic portal index; PSR: Ratio of platelet count to spleen diameter.
- Citation: Xu SH, Wu F, Guo LH, Zhang WB, Xu HX. Liver fibrosis index-based nomograms for identifying esophageal varices in patients with chronic hepatitis B related cirrhosis. World J Gastroenterol 2020; 26(45): 7204-7221
- URL: https://www.wjgnet.com/1007-9327/full/v26/i45/7204.htm
- DOI: https://dx.doi.org/10.3748/wjg.v26.i45.7204


