Copyright
©The Author(s) 2020.
World J Gastroenterol. Nov 28, 2020; 26(44): 6929-6944
Published online Nov 28, 2020. doi: 10.3748/wjg.v26.i44.6929
Published online Nov 28, 2020. doi: 10.3748/wjg.v26.i44.6929
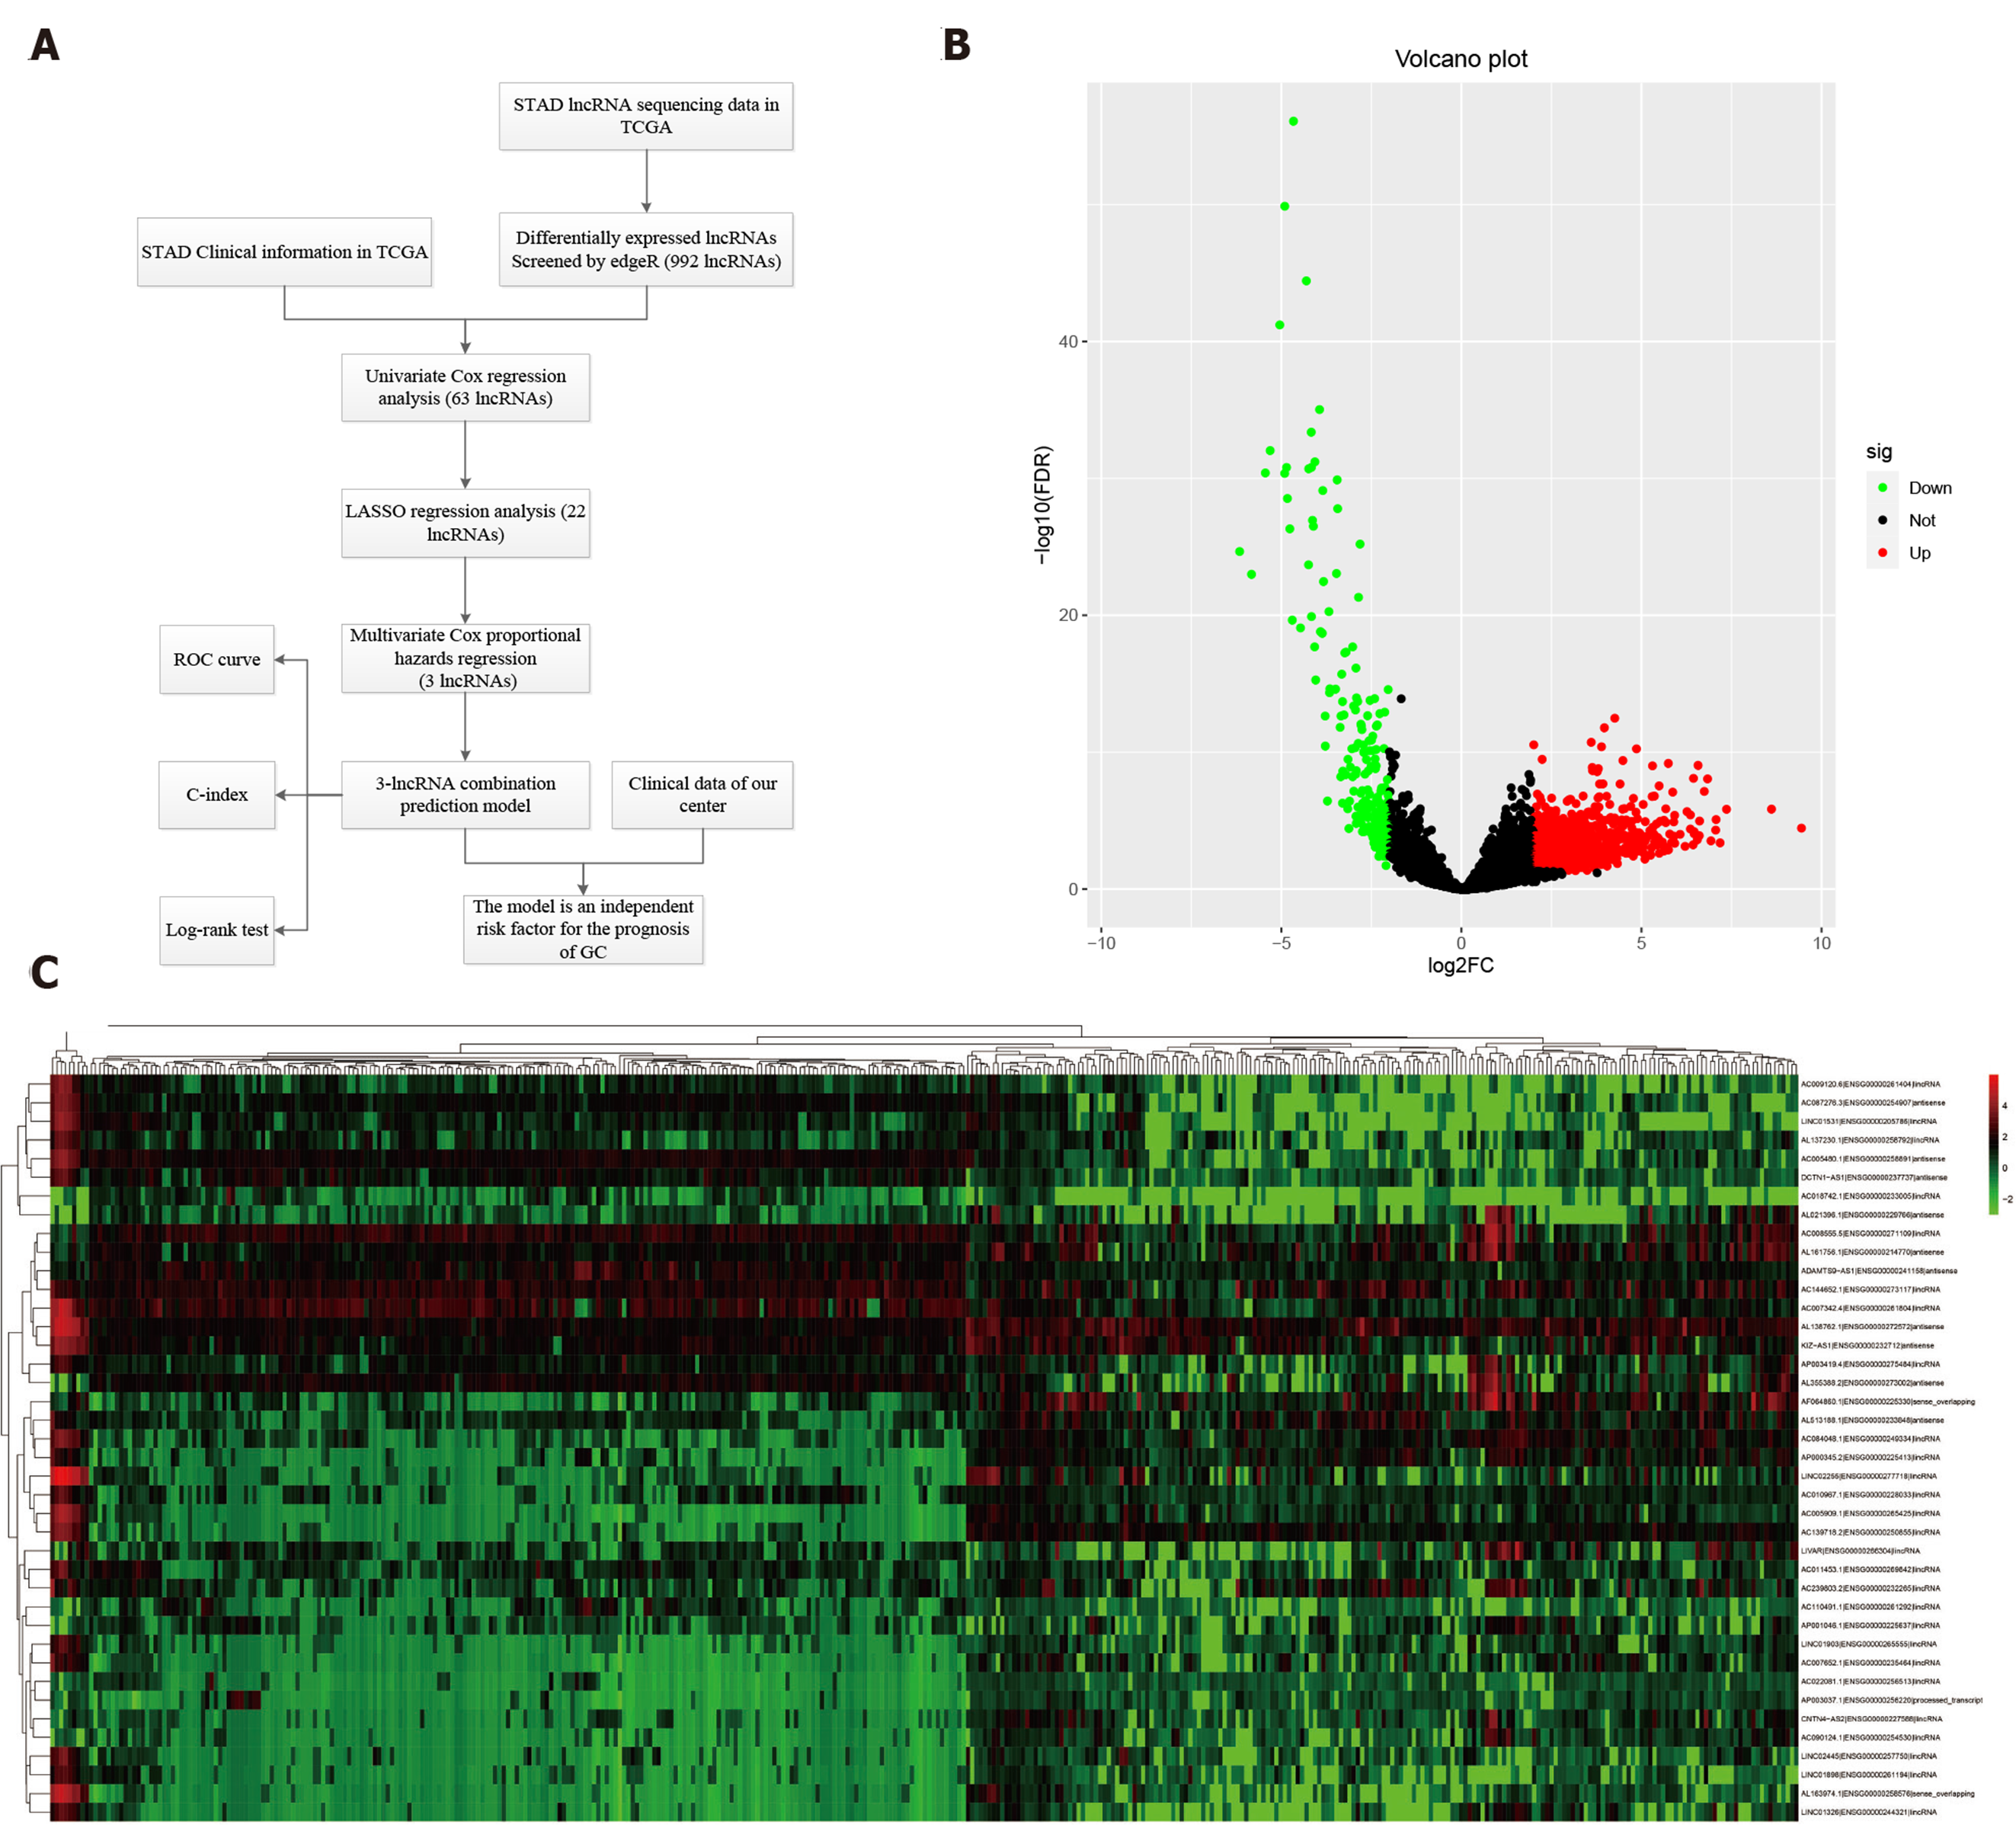
Figure 1 Differentially expressed long noncoding RNAs in The Cancer Genome Atlas-STAndards for development.
A: The workflow of the study; B: Volcano plots showing the differentially expressed long noncoding RNAs (DELs) screened with edgeR. The 772 up-regulated DELs are marked in red, and the 220 down-regulated DELs are marked in green; C: Heatmap showing the top 50 DELs in 375 gastric cancer and 32 para-carcinoma tissues. LncRNAs: Long noncoding RNAs; DELs: Differentially expressed long noncoding RNAs; TCGA: The Cancer Genome Atlas; STAD: STAndards for development; COX: Cyclooxygenase; LASSO: Least absolute shrinkage and selection operator; ROC: Receiver operating characteristic.
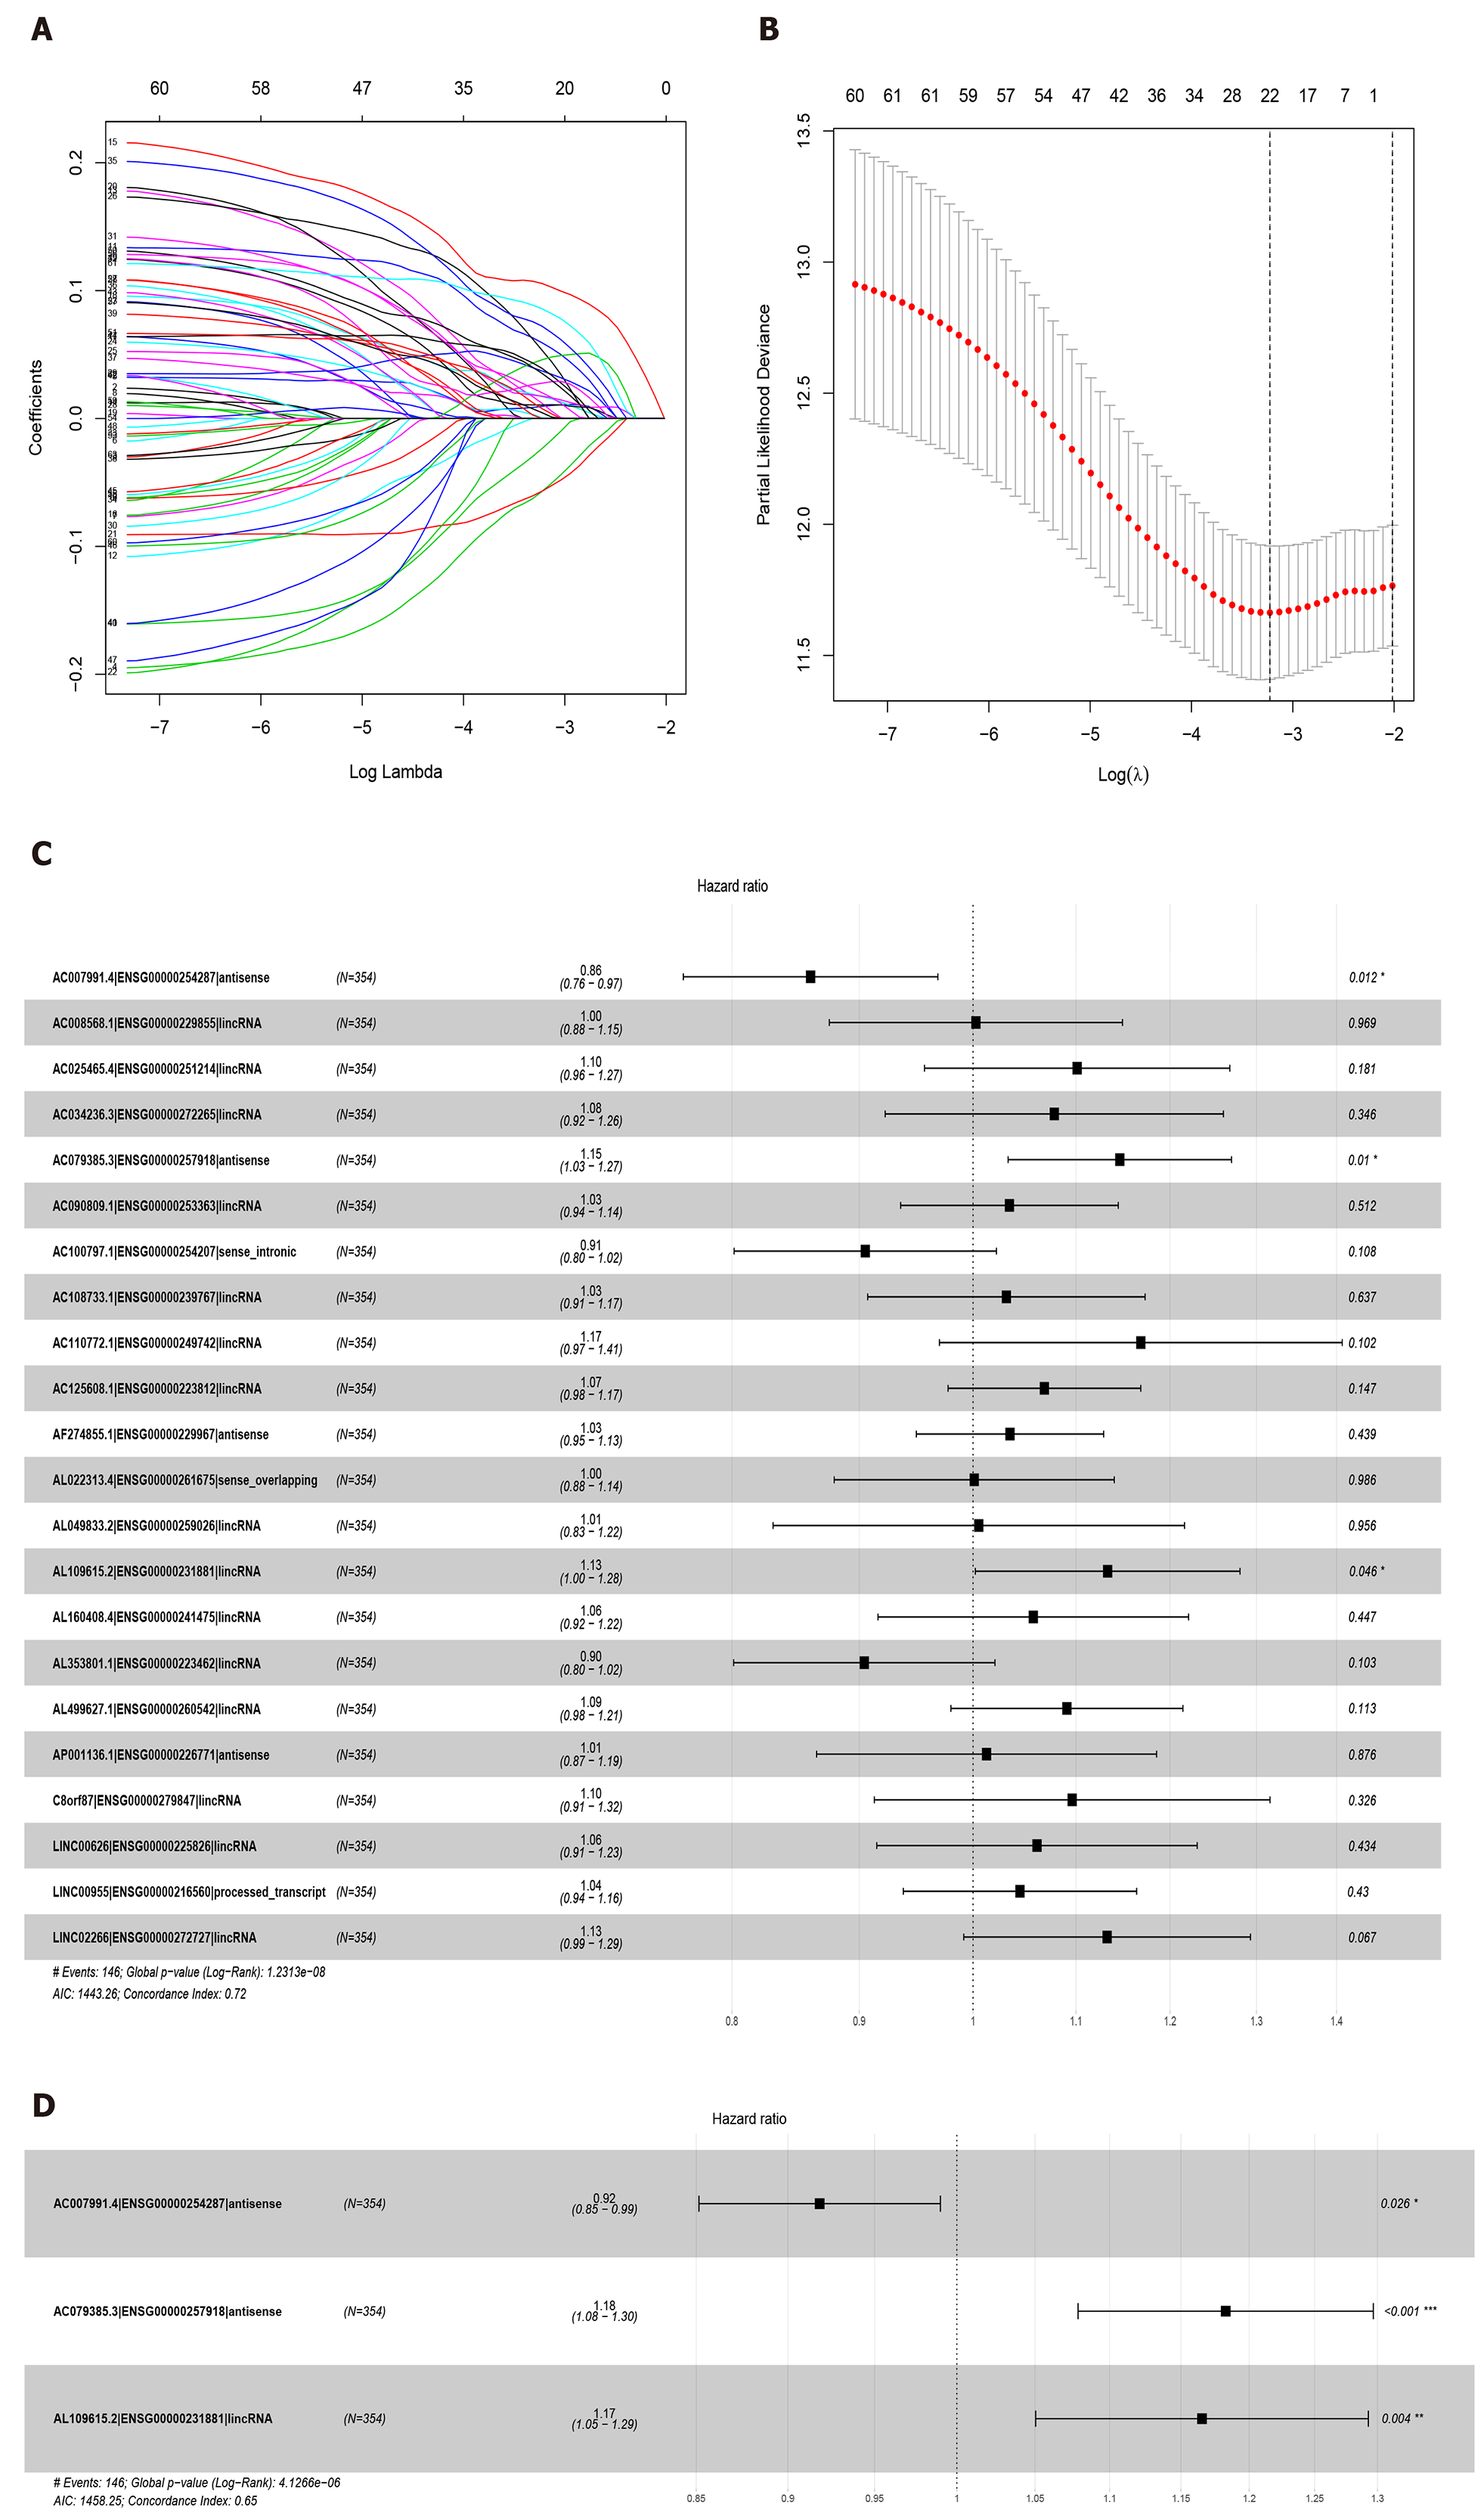
Figure 2 Least absolute shrinkage and selection operator and COX regression screened prognosis associated long noncoding RNAs.
A: Least absolute shrinkage and selection operator coefficient values of the 22 prognosis-related long noncoding RNAs in The Cancer Genome Atlas cohort; B: L1-penalty of least absolute shrinkage and selection operator-COX regression; C: Forest plotshowing the correlations between the 22 long noncoding RNAs and the survival of gastric cancer patients in The Cancer Genome Atlas; D: AC007991.4, AC079385.3, and AL109615.2 are all independent prognostic risk factors for gastric cancer.
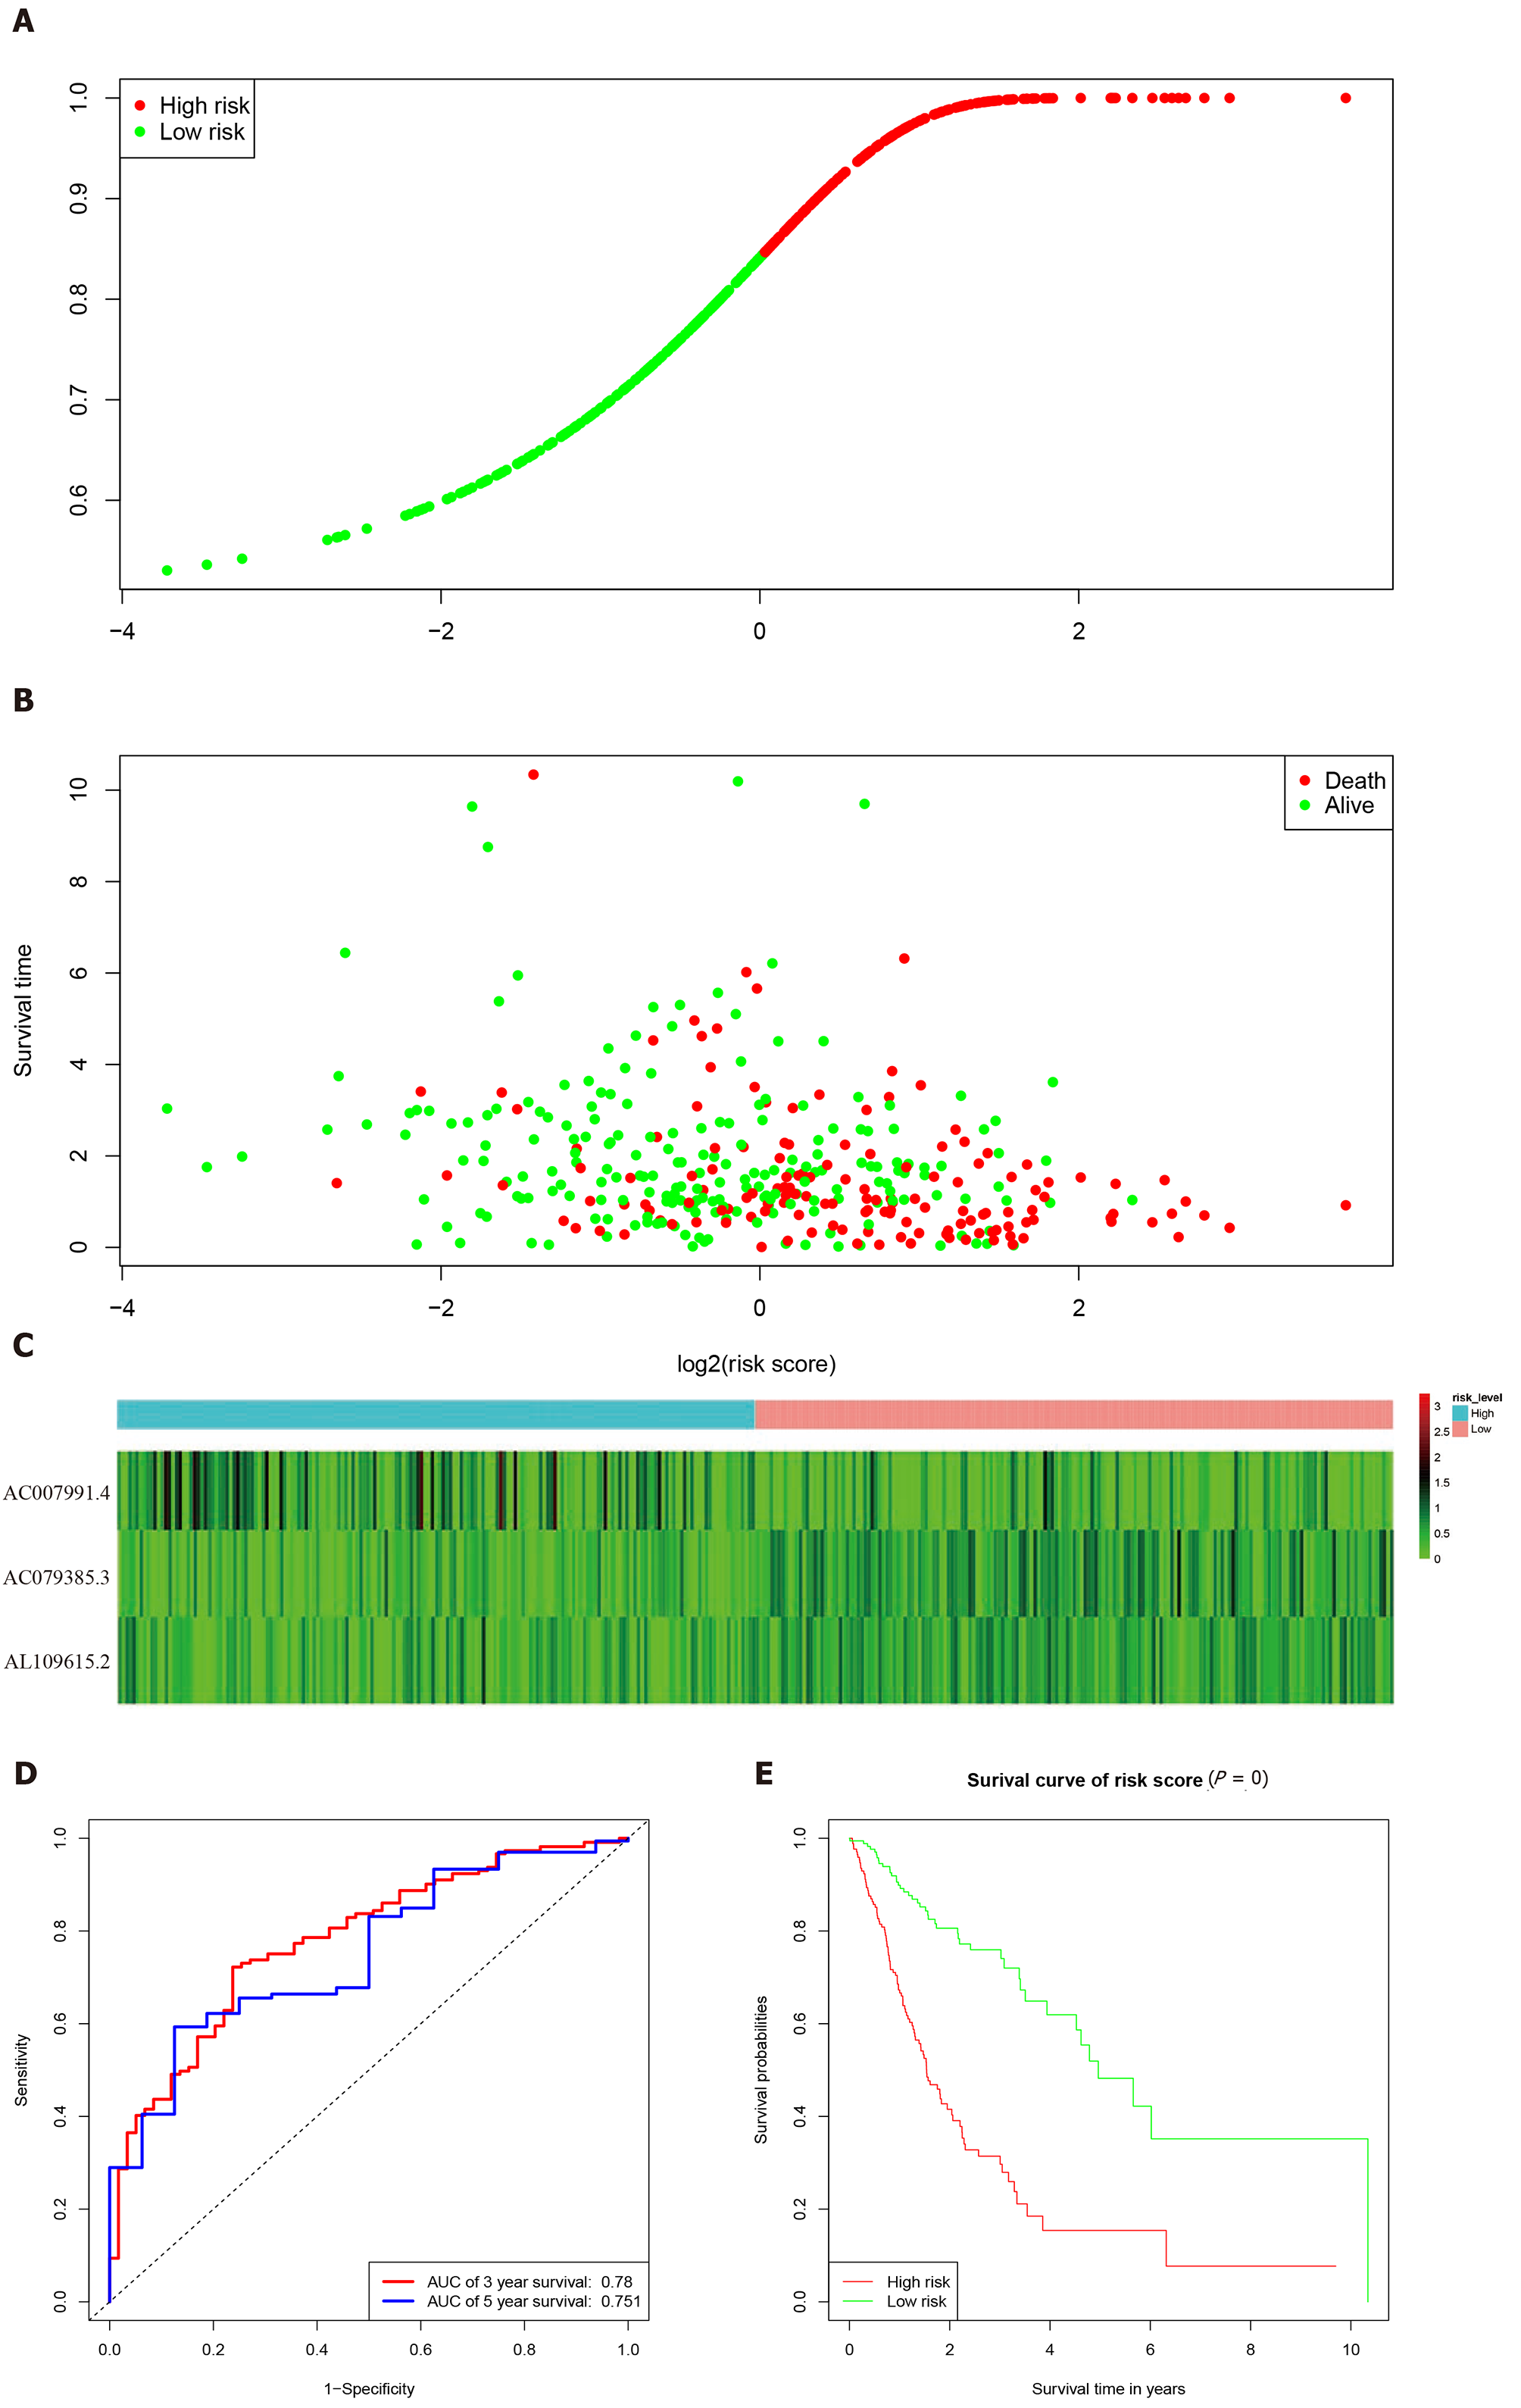
Figure 3 Characteristics of the 3-long noncoding RNA combination in The Cancer Genome Atlas queue.
A: The Cancer Genome Atlas samples arranged according to risk score (the low-risk group, green, the high-risk group, red); B: The Cancer Genome Atlas samples arranged according to survival time in years (red, death; green, alive); C: Heatmap showing the expression of three long noncoding RNAs in samples according to the risk score (blue, low-risk group; pink, high-risk group); D: The receiver operating characteristic curve for evaluating the predictive effectiveness of the model; E: The high-risk group in this model has a worse overall survival. AUC: Area under the curve.
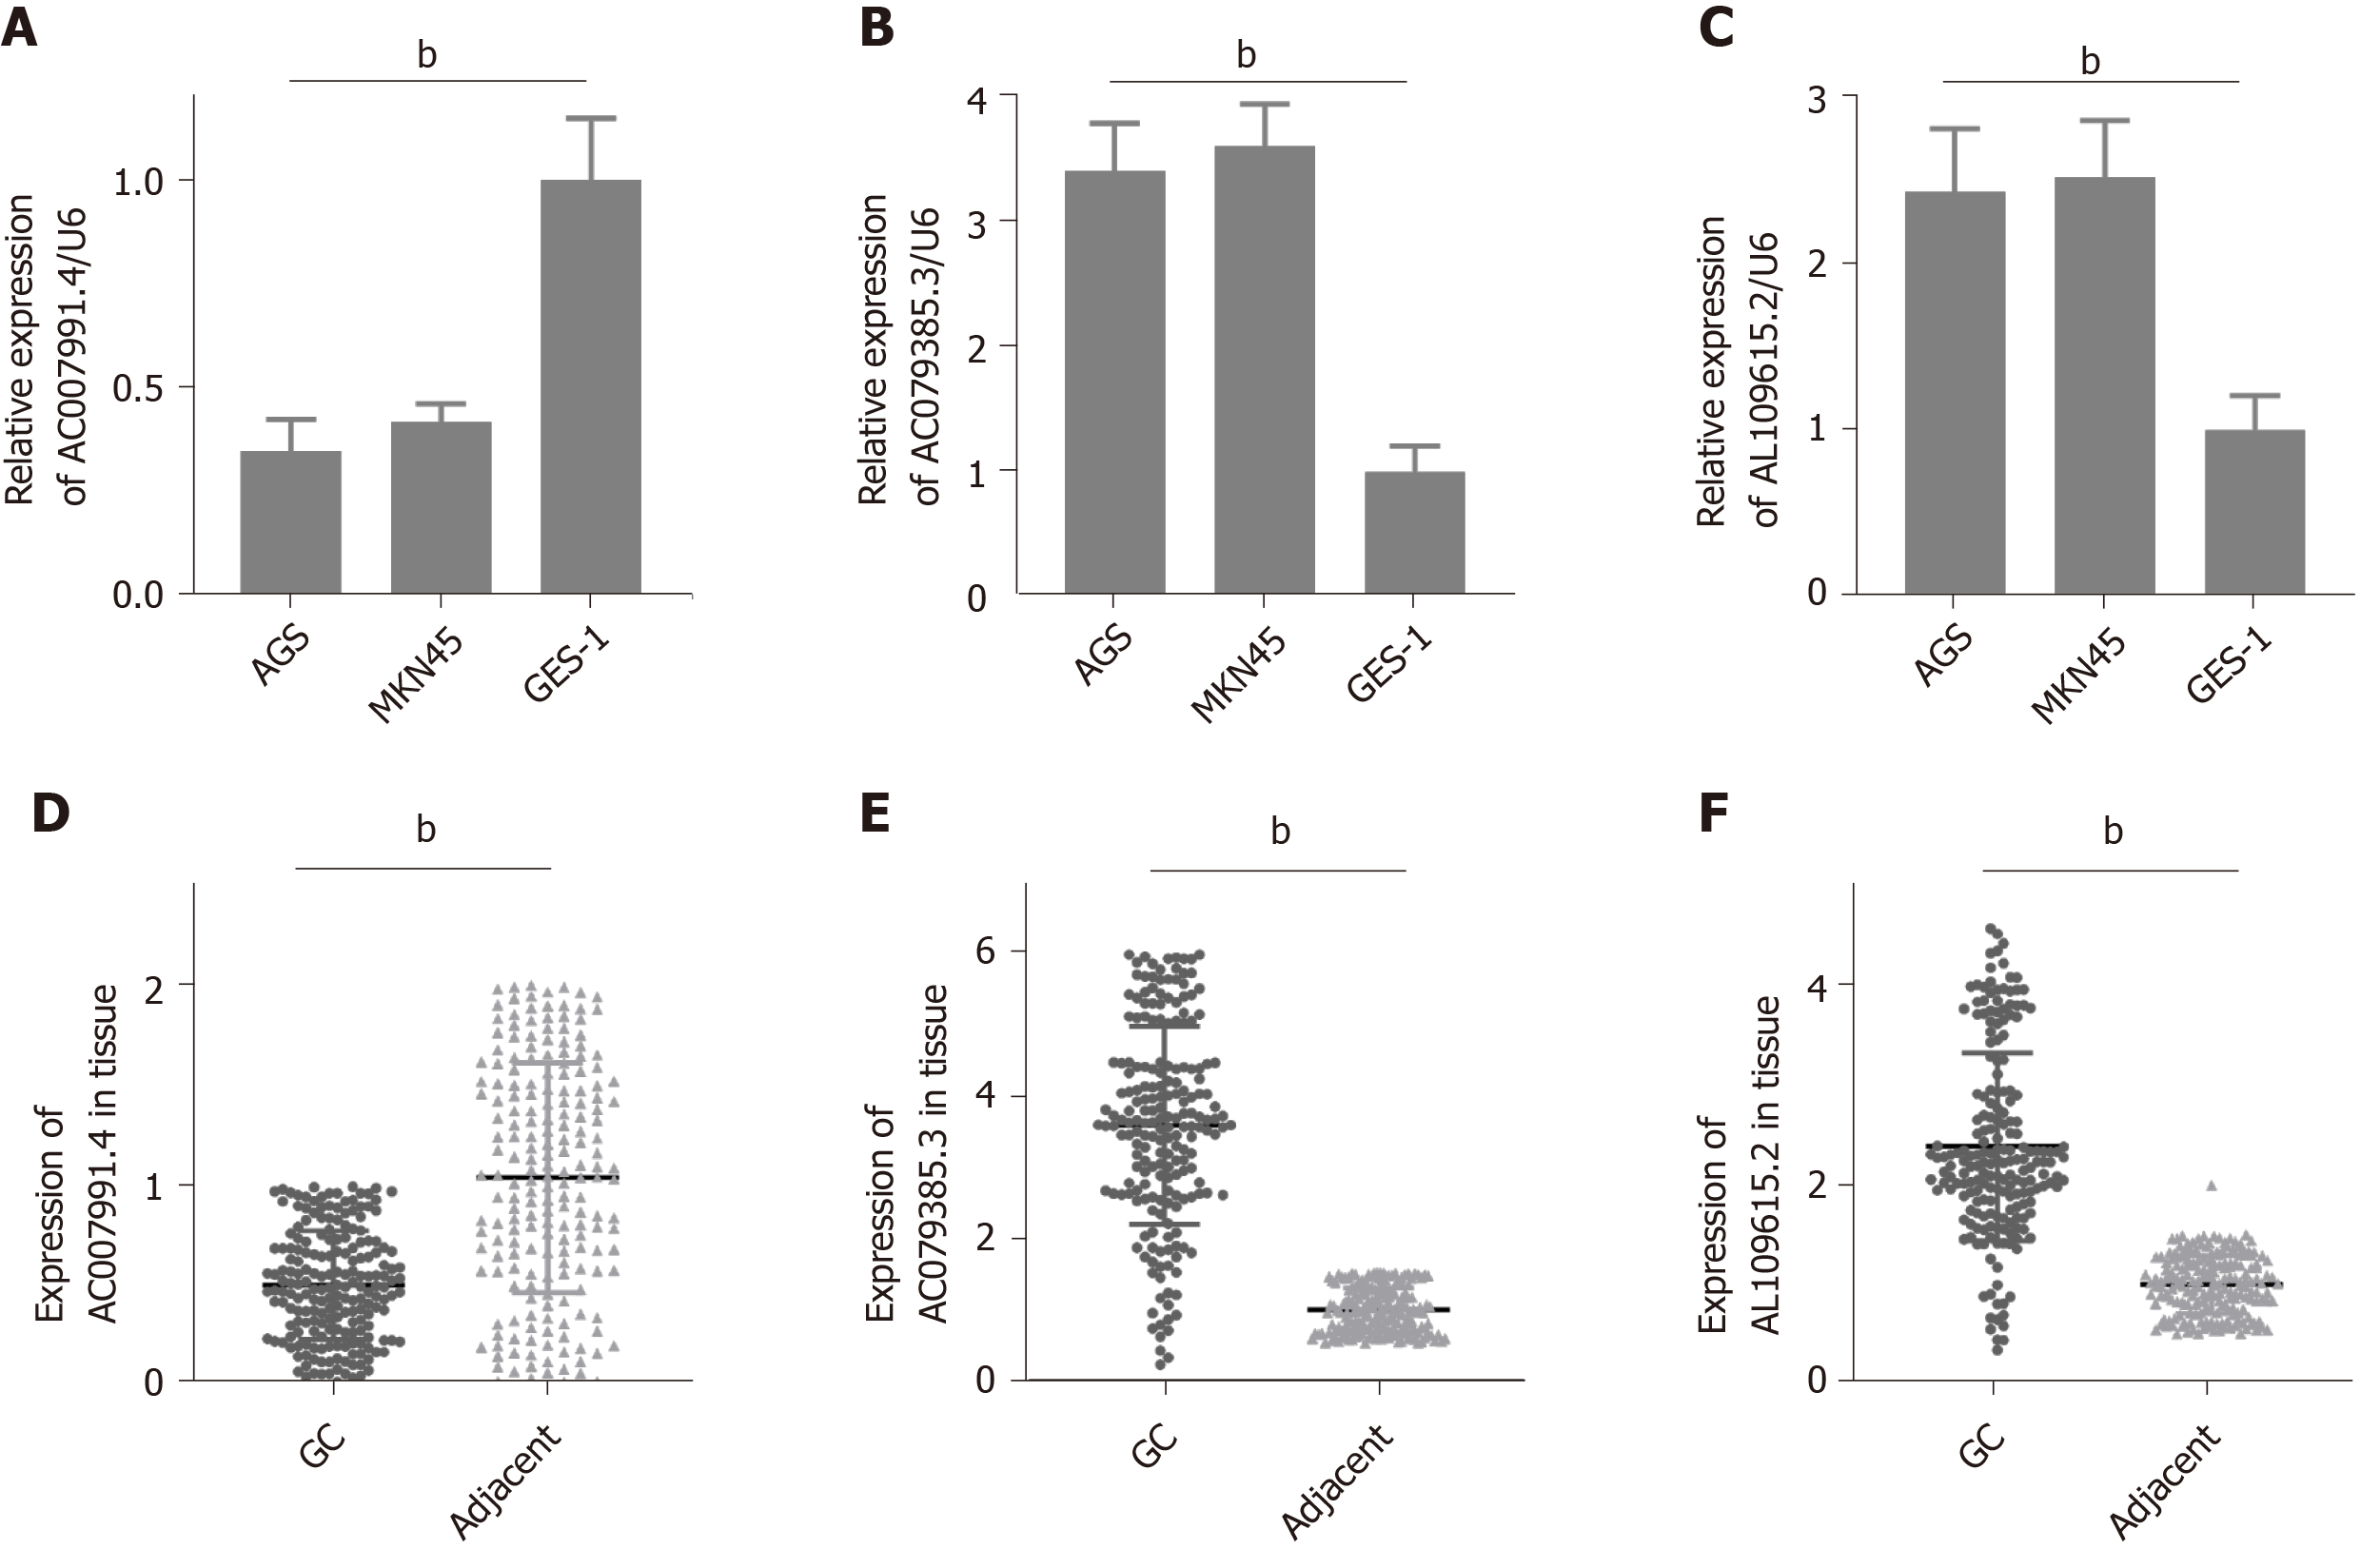
Figure 4 Expression of AC007991.
4, AC079385.3, and AL109615.2 in gastric cancer tissues and cells. A and D: AC007991.4 is weakly expressed in gastric cancer (GC) cells and tissues; B and E: AC079385.3 is overexpressed in GC cells and tissues; C and F: AL109615.2 is overexpressed in GC cells and tissues. bP < 0.01. GC: Gastric cancer.
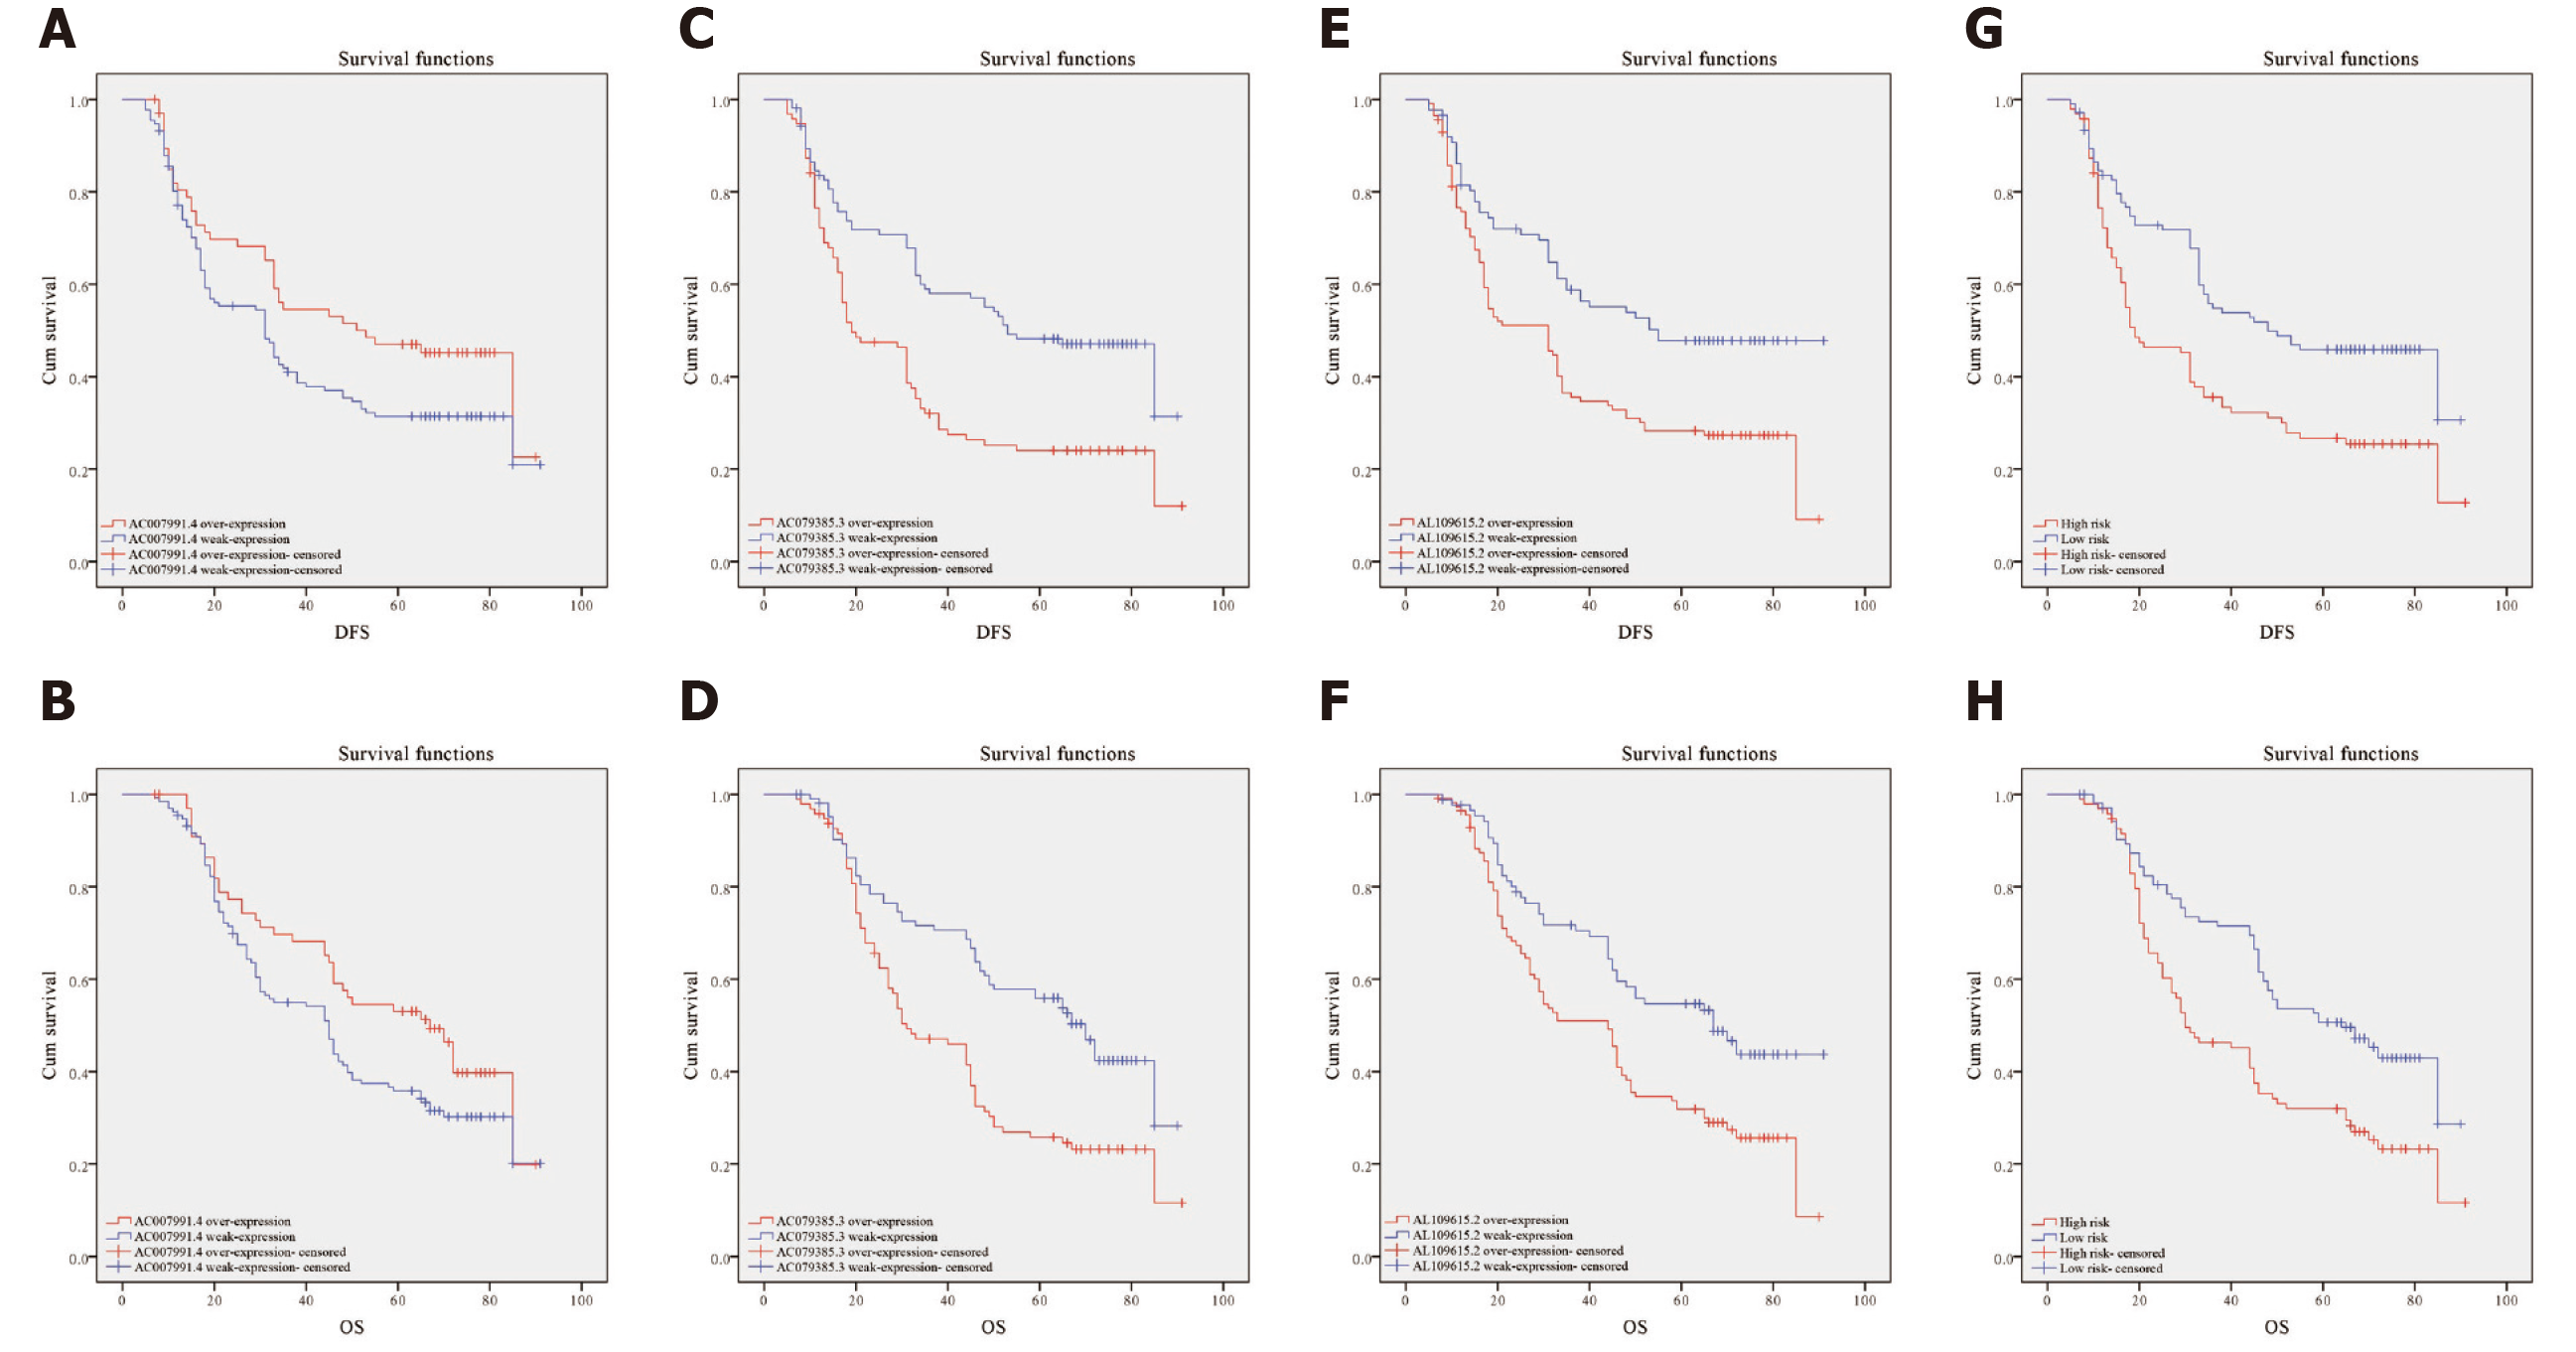
Figure 5 Kaplan-Meier curves for disease-free survival and overall survival.
A and B: Disease-free survival (DFS) and overall survival (OS) curves of 200 gastric cancer (GC) patients stratified by AC007991.4 expression (P = 0.05). The overexpression of AC007991.4 contributed to a good survival; C and D: DFS and OS curves of 200 GC patients stratified by AC079385.3 expression (P = 0.00). The overexpression of AC079385.3 contributed to an excellent survival; E and F: DFS and OS curves of 200 GC patients stratified by AL109615.2 expression (P = 0.00 and P = 0.02). The overexpression of AL109615.2 contributed to an excellent survival; G and H: DFS and OS curves of 200 GC patients stratified by the 3-long noncoding RNA model (P = 0.00). The high score of expression model contributed to a good survival. DFS: Disease-free survival; OS: Overall survival.
- Citation: Zhang J, Piao HY, Wang Y, Lou MY, Guo S, Zhao Y. Development and validation of a three-long noncoding RNA signature for predicting prognosis of patients with gastric cancer. World J Gastroenterol 2020; 26(44): 6929-6944
- URL: https://www.wjgnet.com/1007-9327/full/v26/i44/6929.htm
- DOI: https://dx.doi.org/10.3748/wjg.v26.i44.6929


