Copyright
©The Author(s) 2020.
World J Gastroenterol. Nov 28, 2020; 26(44): 6929-6944
Published online Nov 28, 2020. doi: 10.3748/wjg.v26.i44.6929
Published online Nov 28, 2020. doi: 10.3748/wjg.v26.i44.6929
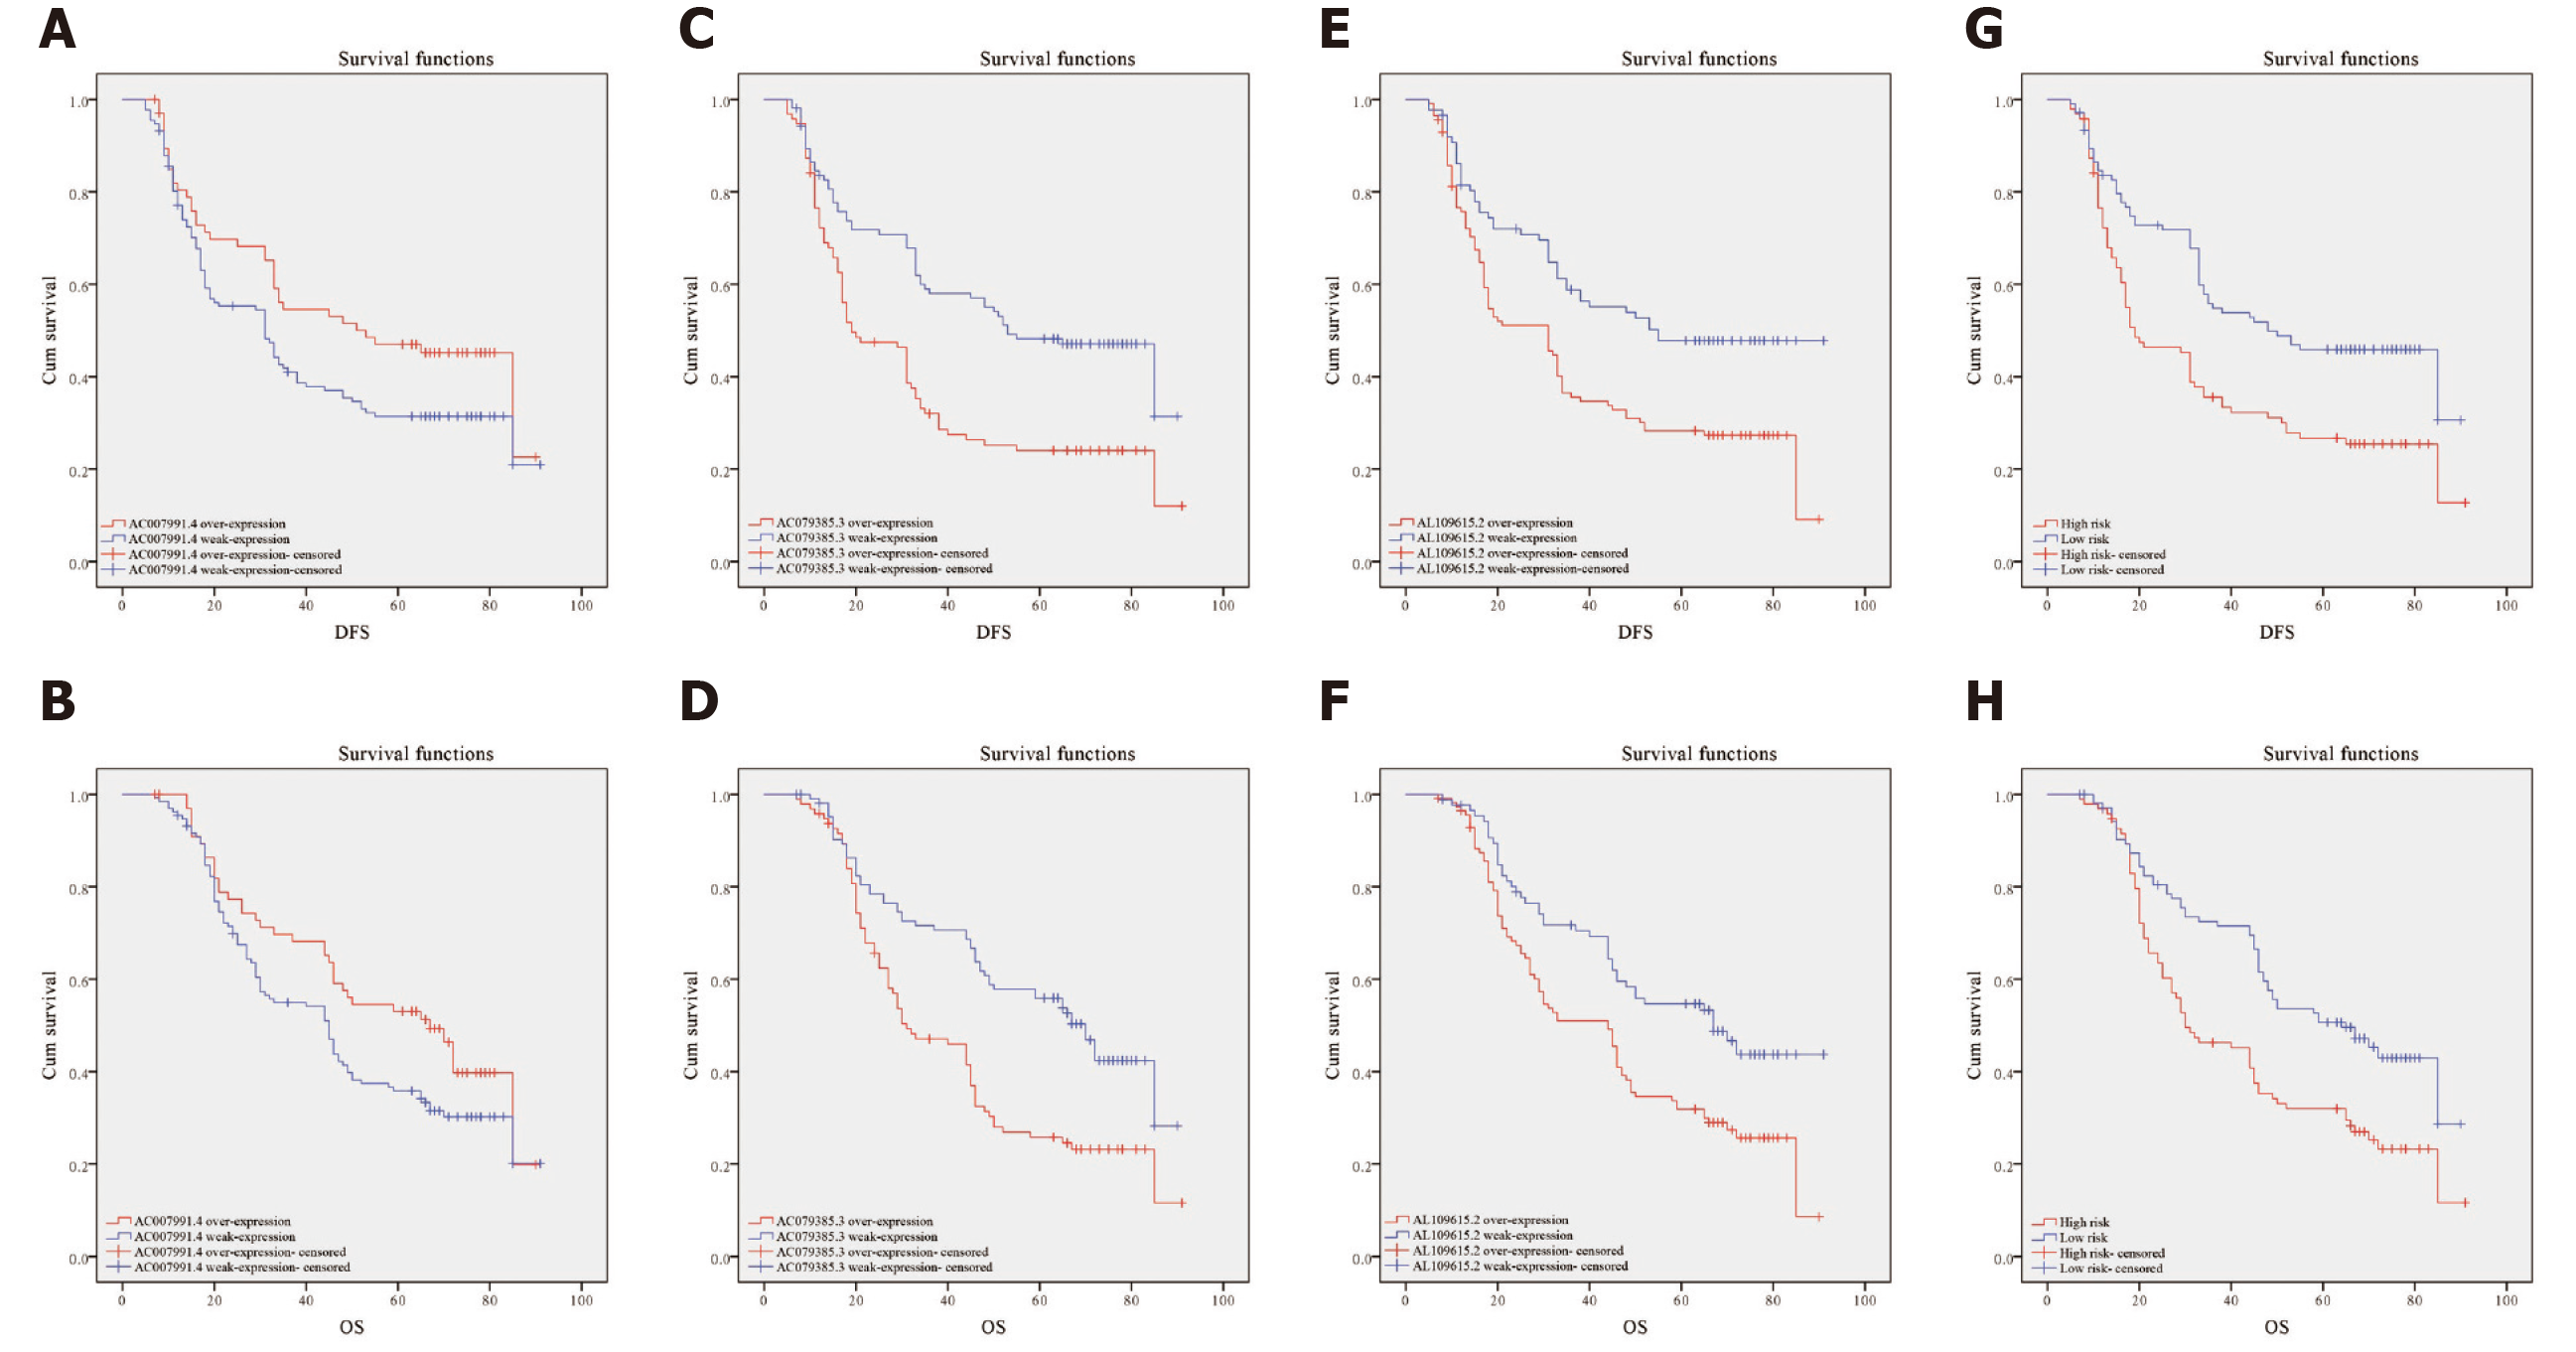
Figure 5 Kaplan-Meier curves for disease-free survival and overall survival.
A and B: Disease-free survival (DFS) and overall survival (OS) curves of 200 gastric cancer (GC) patients stratified by AC007991.4 expression (P = 0.05). The overexpression of AC007991.4 contributed to a good survival; C and D: DFS and OS curves of 200 GC patients stratified by AC079385.3 expression (P = 0.00). The overexpression of AC079385.3 contributed to an excellent survival; E and F: DFS and OS curves of 200 GC patients stratified by AL109615.2 expression (P = 0.00 and P = 0.02). The overexpression of AL109615.2 contributed to an excellent survival; G and H: DFS and OS curves of 200 GC patients stratified by the 3-long noncoding RNA model (P = 0.00). The high score of expression model contributed to a good survival. DFS: Disease-free survival; OS: Overall survival.
- Citation: Zhang J, Piao HY, Wang Y, Lou MY, Guo S, Zhao Y. Development and validation of a three-long noncoding RNA signature for predicting prognosis of patients with gastric cancer. World J Gastroenterol 2020; 26(44): 6929-6944
- URL: https://www.wjgnet.com/1007-9327/full/v26/i44/6929.htm
- DOI: https://dx.doi.org/10.3748/wjg.v26.i44.6929


