Copyright
©The Author(s) 2020.
World J Gastroenterol. Oct 14, 2020; 26(38): 5849-5862
Published online Oct 14, 2020. doi: 10.3748/wjg.v26.i38.5849
Published online Oct 14, 2020. doi: 10.3748/wjg.v26.i38.5849
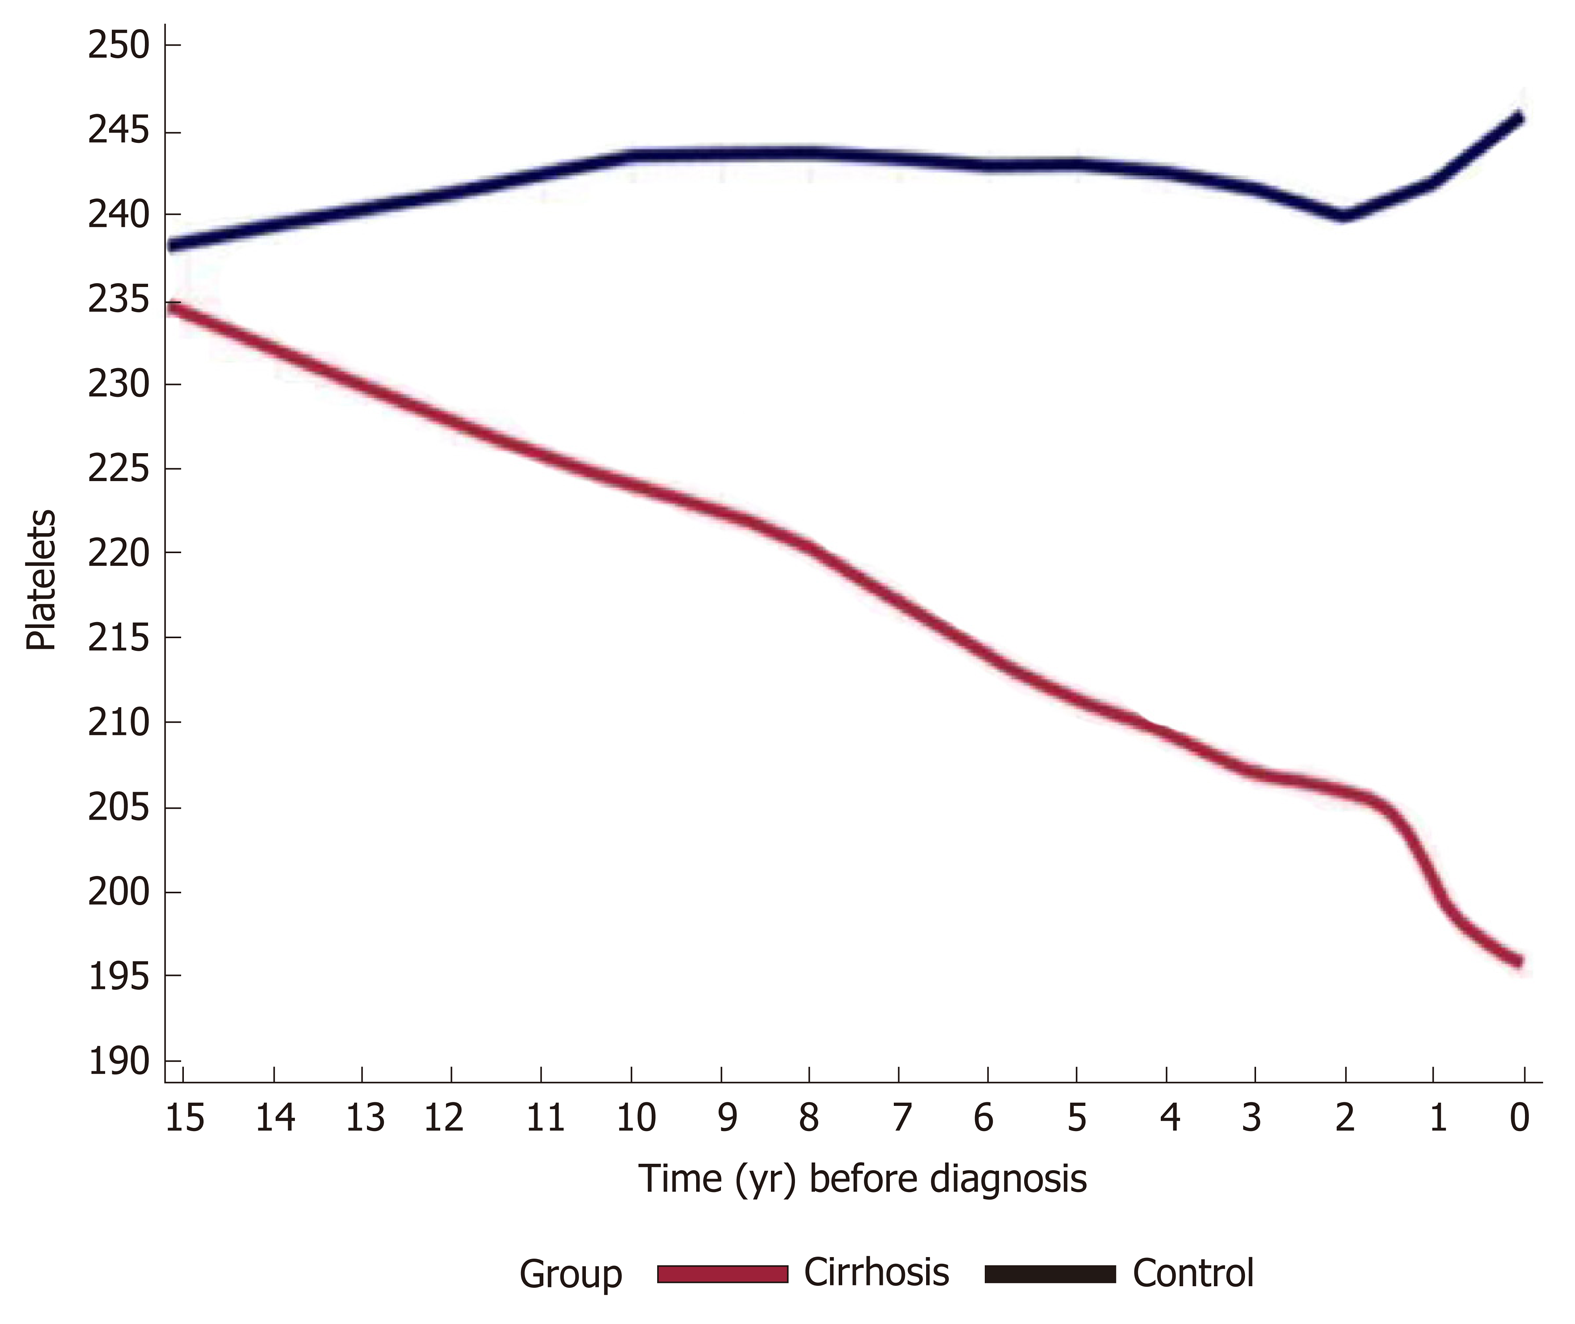
Figure 1 Trends in platelet counts across 15 years prior to cirrhosis diagnosis among cases and controls (n total = 21032, 250646 platelets measurements).
Done with locally weighted scatterplot smoothing trend. The mean platelet counts in the cirrhosis group decreased from 240000/μL to 190000/μL, starting 15 years prior to cirrhosis diagnosis, compared to stable values in the control group.
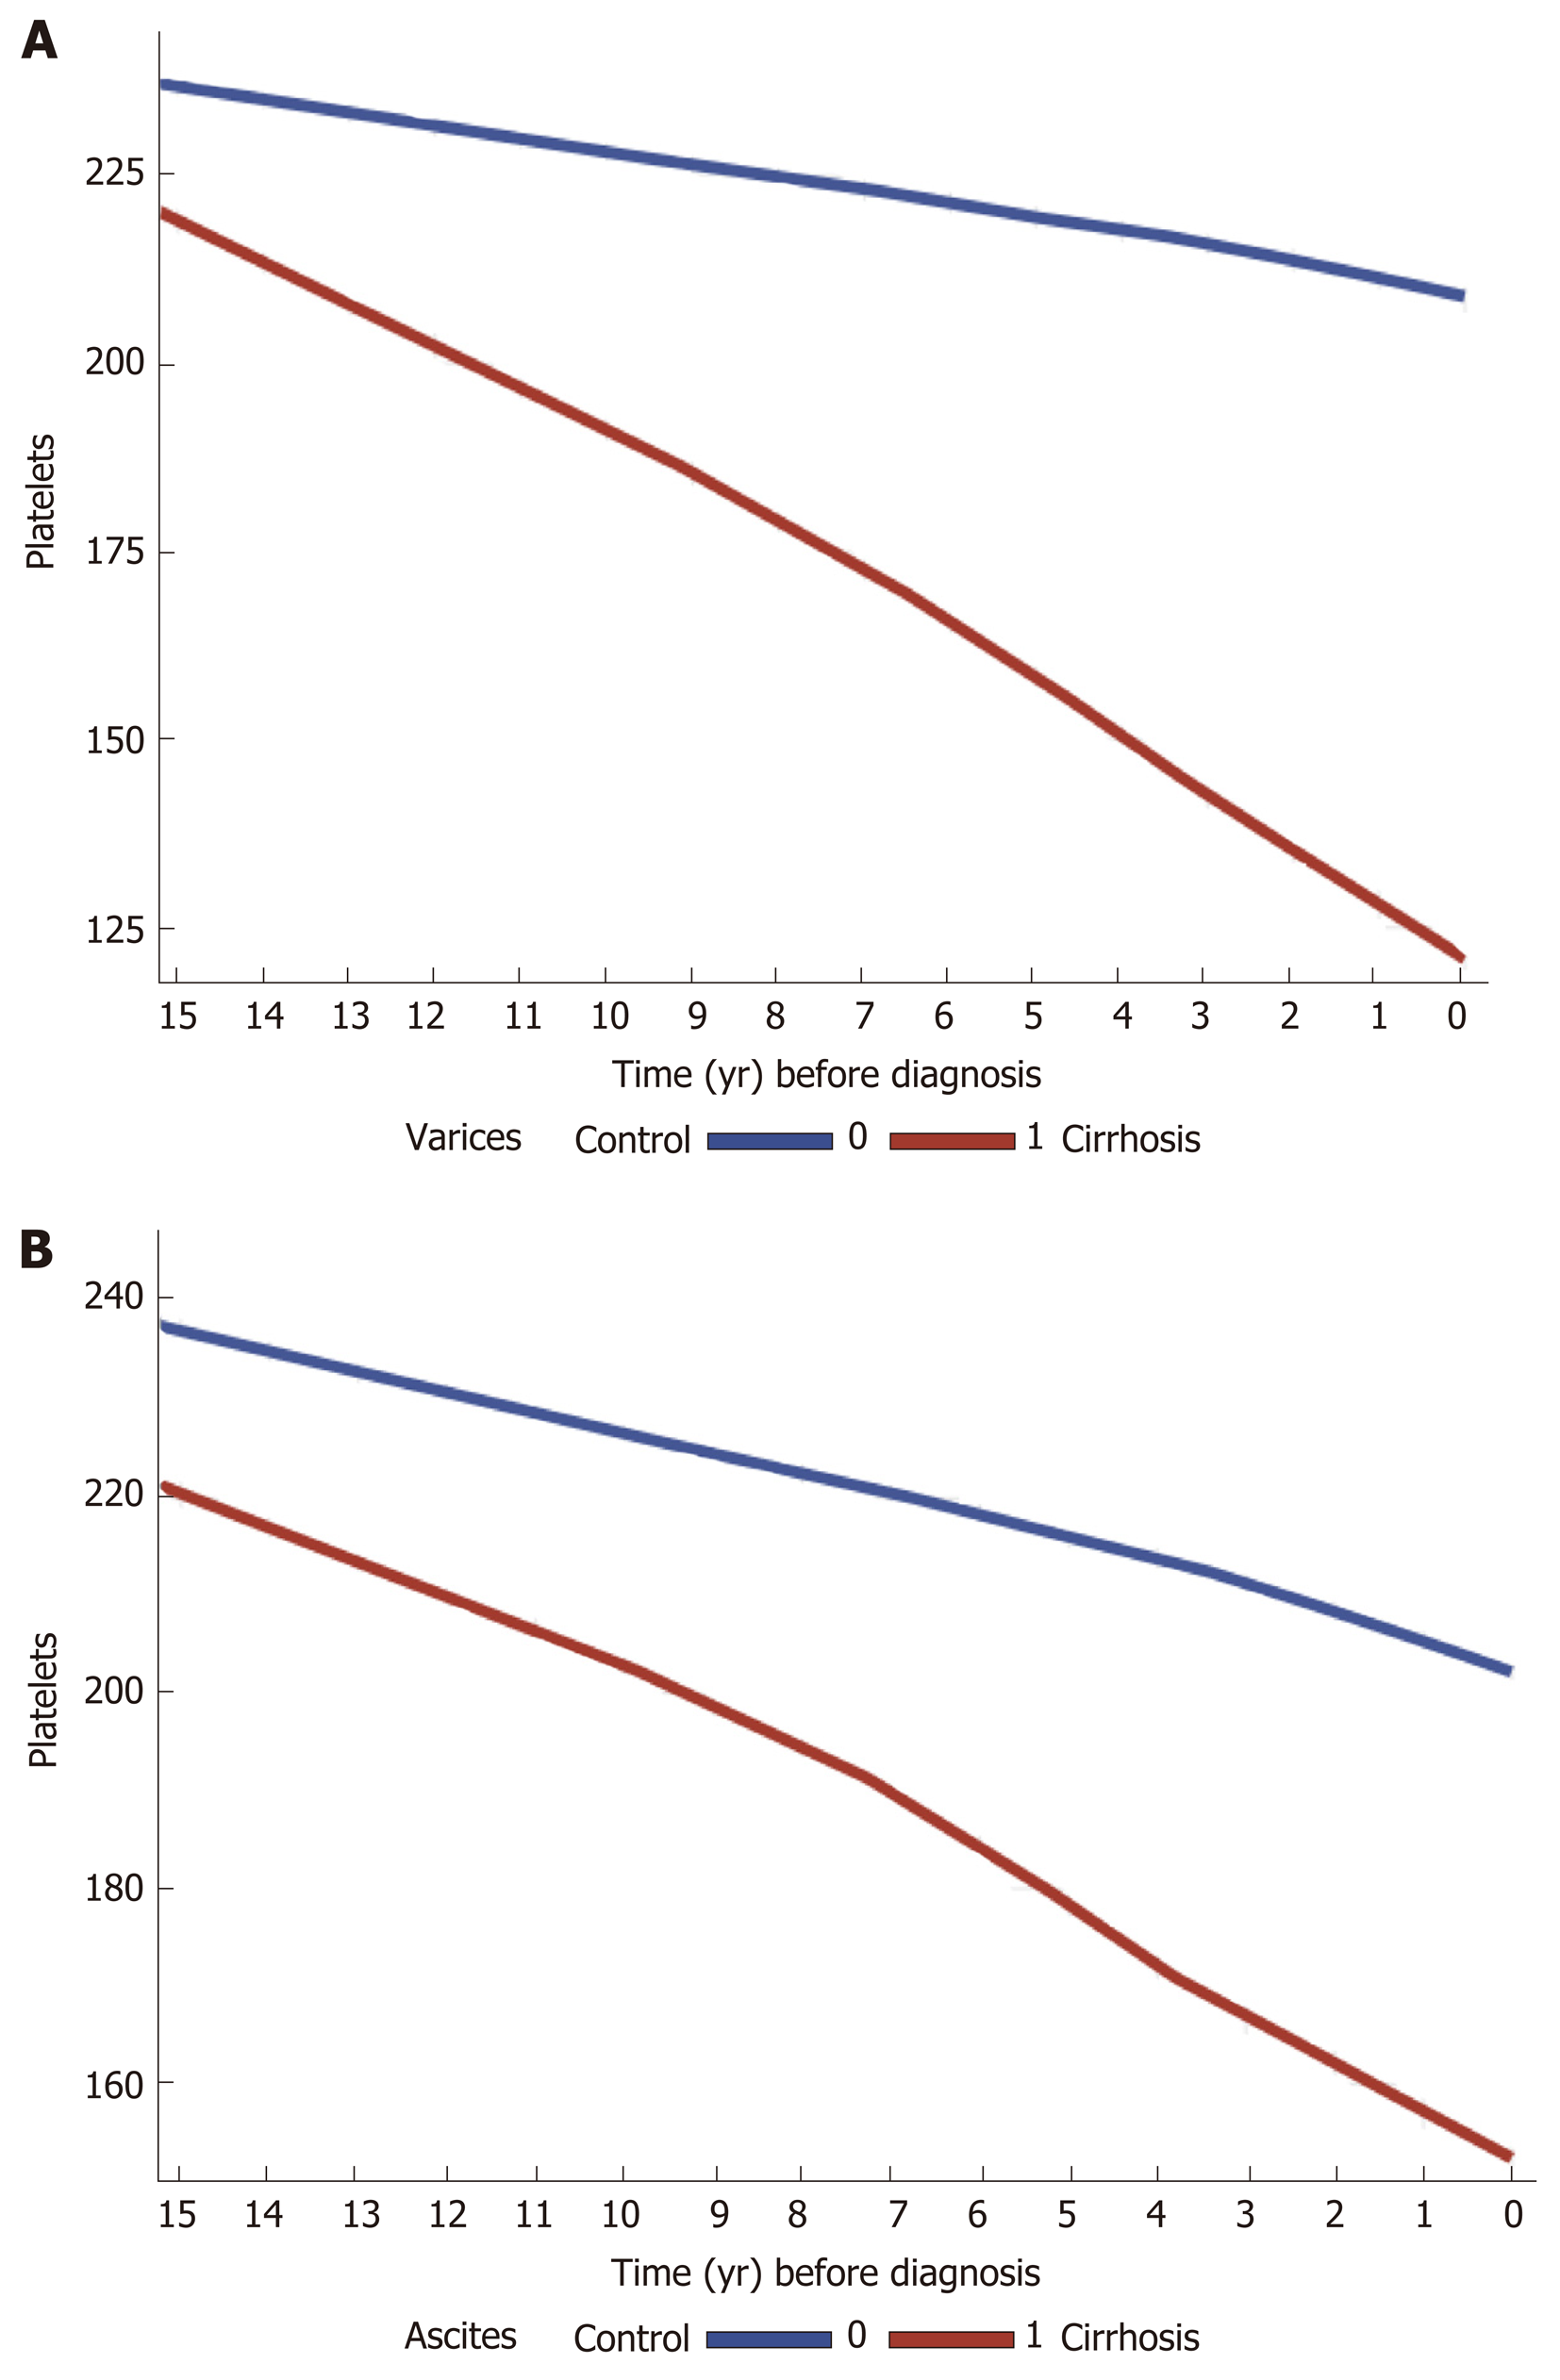
Figure 2 Trends in platelet counts across 15 years prior to cirrhosis diagnosis among cases and controls, stratified by cirrhosis complications A: Varices (n = 551) and B: Ascites (n = 450), both done with locally weighted scatterplot smoothing for trend.
In patients with complications of portal hypertension (varices and ascites), platelet counts decline is steeper compared to those with no such complications.
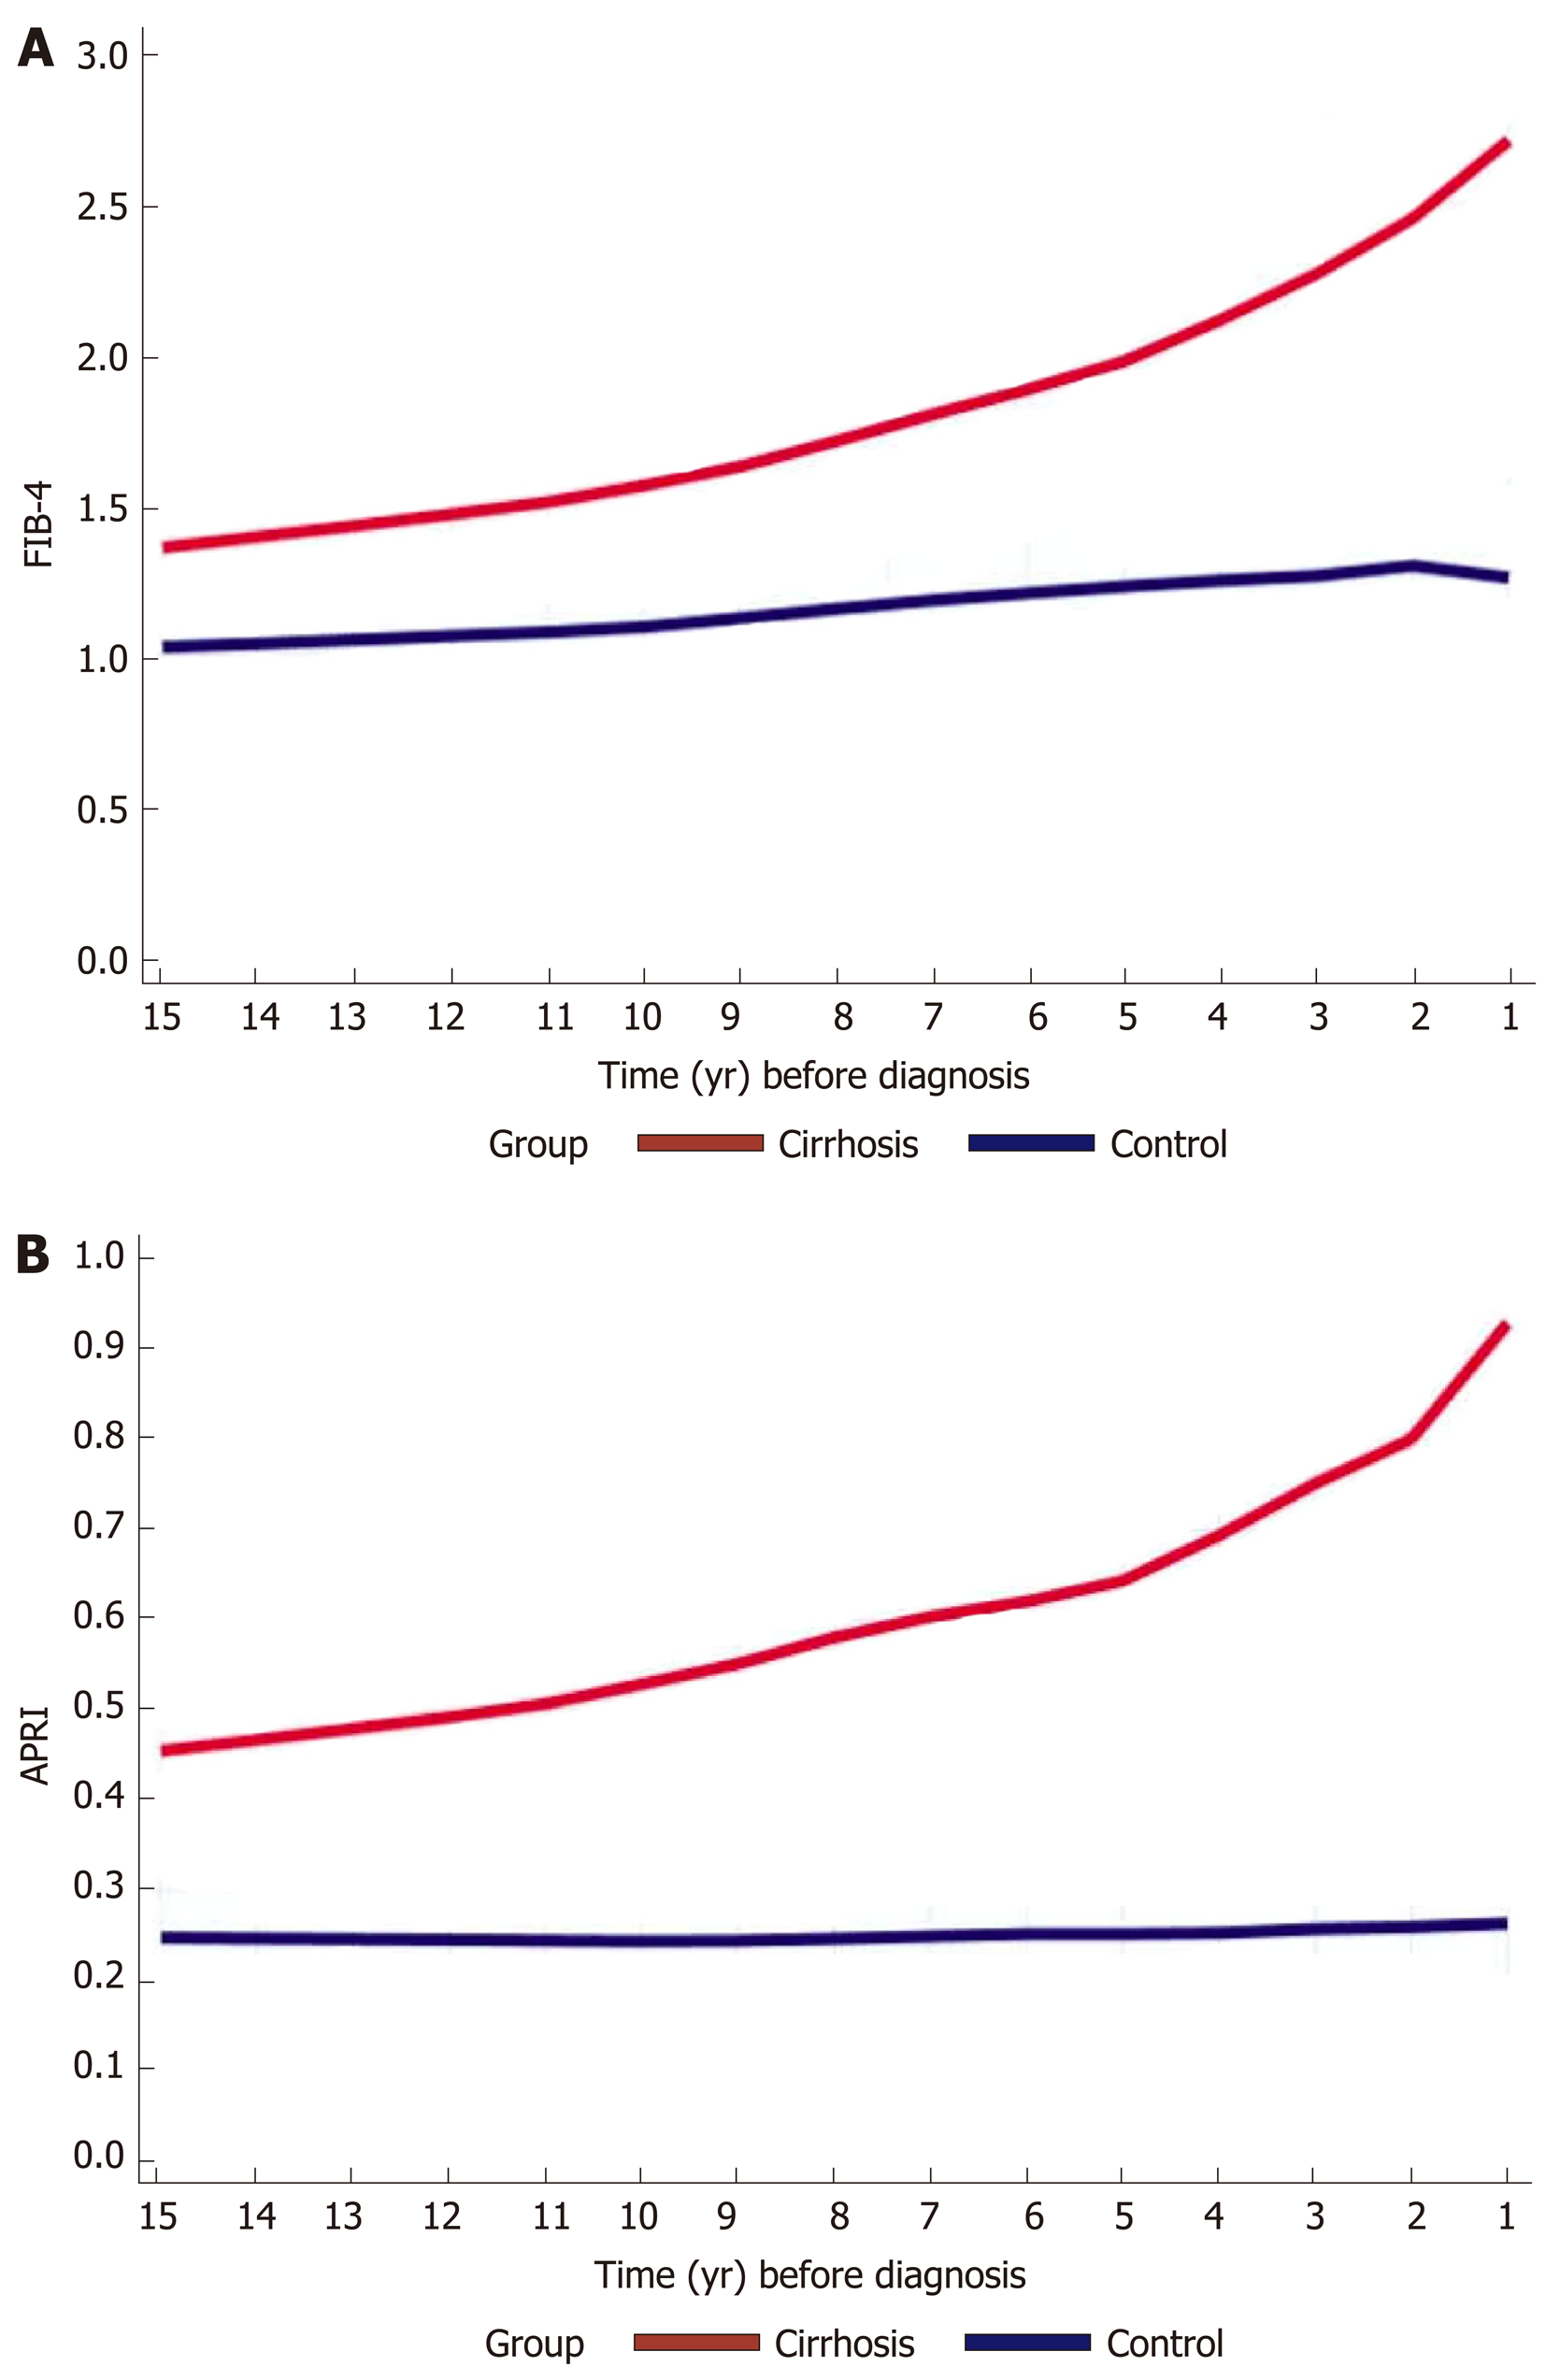
Figure 3 Trends in fibrosis-4 and aspartate aminotransferase-to-platelet ratio index scores across 15 years prior to cirrhosis diagnosis among cases and controls.
Trends in A: Fibrosis-4 and B: Aspartate aminotransferase-to-platelet ratio index scores, both done with locally weighted scatterplot smoothing trend. There is a gradual increase in both scores in the cirrhosis group compared to controls, ranging from 1.3 to 3 and 0.48 to 0.93 respectively.
- Citation: Gotlieb N, Schwartz N, Zelber-Sagi S, Chodick G, Shalev V, Shibolet O. Longitudinal decrease in platelet counts as a surrogate marker of liver fibrosis. World J Gastroenterol 2020; 26(38): 5849-5862
- URL: https://www.wjgnet.com/1007-9327/full/v26/i38/5849.htm
- DOI: https://dx.doi.org/10.3748/wjg.v26.i38.5849


